- 快召唤伙伴们来围观吧
- 微博 QQ QQ空间 贴吧
- 文档嵌入链接
- 复制
- 微信扫一扫分享
- 已成功复制到剪贴板
AI Index 2018 Annual Report
展开查看详情
1 .1
2 .AI INDEX 2018 Steering Committee Yoav Shoham (Chair) Stanford University Raymond Perrault SRI International Erik Brynjolfsson MIT Jack Clark OpenAI James Manyika McKinsey Global Institute Juan Carlos Niebles Stanford University Terah Lyons Partnership On AI John Etchemendy Stanford University Barbara Grosz Harvard University Project Manager Zoe Bauer 2
3 . AI INDEX 2018 Welcome to the AI Index 2018 Report Our Mission is to ground the conversation about AI in data. The AI Index is an effort to track, collate, distill, and visualize data relating to artificial intelligence. It aspires to be a comprehensive resource of data and analysis for policymakers, researchers, executives, journalists, and the general public to develop intuitions about the complex field of AI. How to cite this Report: Yoav Shoham, Raymond Perrault, Erik Brynjolfsson, Jack Clark, James Manyika, Juan Carlos Niebles, Terah Lyons, John Etchemendy, Barbara Grosz and Zoe Bauer, "The AI Index 2018 Annual Report”, AI Index Steering Committee, Human-Centered AI Initiative, Stanford University, Stanford, CA, December 2018. (c) 2018 by Stanford University, “The AI Index 2018 Annual Report” is made available under a Creative Commons Attribution-NoDerivatives 4.0 License (International) https://creativecommons.org/licenses/by-nd/4.0/legalcode 3
4 . AI INDEX 2018 Table of contents Introduction to the AI Index 2018 Report 5 Overview 6 Volume of Activity 8 Research Published Papers 9 Course Enrollment 21 Participation 26 Robot Software 29 Industry Startups / Investment 31 Jobs 33 Patents 35 AI Adoption Survey 36 Earnings Calls 38 Robot Installations 41 Open Source Software GitHub Project Statistics 42 Public Interest Sentiment of Media Coverage 43 Government mentions 44 Technical Performance Vision 47 Natural Language Understanding 50 Other Measures Derivative Measures 55 Government Initiatives 57 Human-Level Performance Milestones 59 What’s Missing? 63 Acknowledgements 66 Appendix 69 4
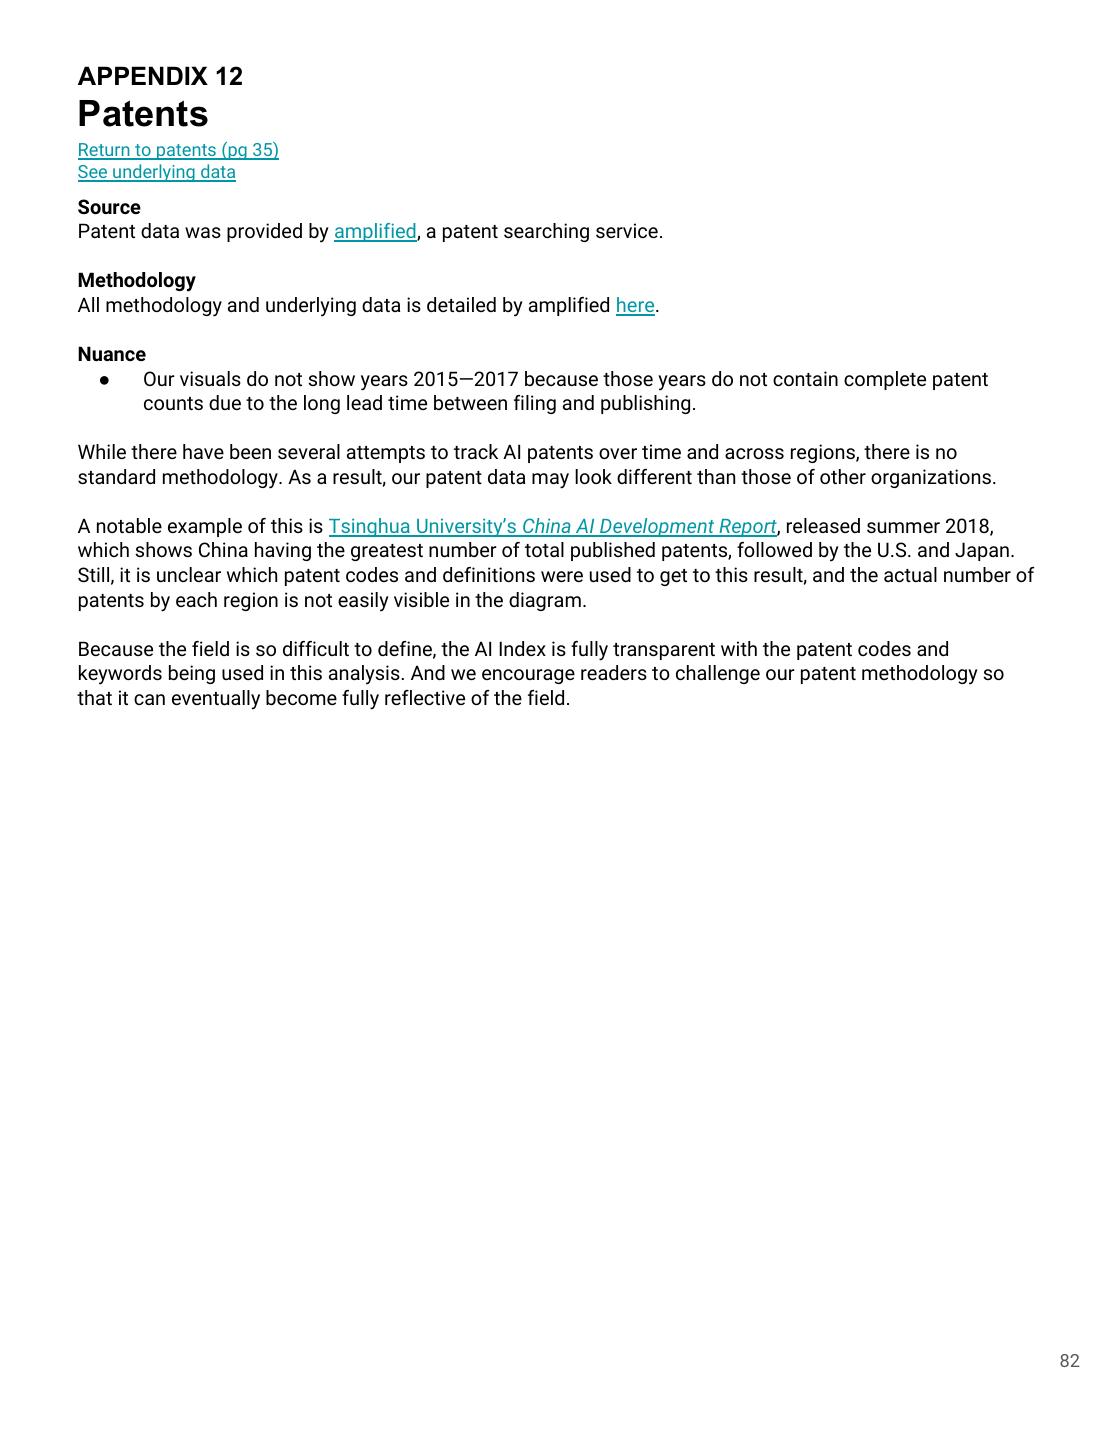
5 . AI INDEX 2018 Introduction to the AI Index 2018 Annual Report We are pleased to introduce the AI Index 2018 Annual Report. This year’s report accomplishes two objectives. First, it refreshes last year’s metrics. Second, it provides global context whenever possible. The former is critical to the Index’s mission — grounding the AI conversation means tracking volumetric and technical progress on an ongoing basis. But the latter is also essential. There is no AI story without global perspective. The 2017 report was heavily skewed towards North American activities. This reflected a limited number of global partnerships established by the project, not an intrinsic bias. This year, we begin to close the global gap. We recognize that there is a long journey ahead — one that involves further collaboration and outside participation — to make this report truly comprehensive. Still, we can assert that AI is global. 83 percent of 2017 AI papers on Scopus originate outside the U.S. 28 percent of these papers originate in Europe — the largest percentage of any region. University course enrollment in artificial intelligence (AI) and machine learning (ML) is increasing all over the world, most notably at Tsinghua in China, whose combined AI + ML 2017 course enrollment was 16x larger than it was in 2010. And there is progress beyond just the United States, China, and Europe. South Korea and Japan were the 2nd and 3rd largest producers of AI patents in 2014, after the U.S. Additionally, South Africa hosted the second Deep Learning Indaba conference, one of the world’s largest ML teaching events, which drew over 500 participants from 20+ African countries. AI’s diversity is not just geographic. Today, over 50% of the Partnership on AI’s members are nonprofits — including the ACLU, Oxford’s Future of Humanity Institute, and the United Nations Development Programme. Also, there is heightened awareness of gender and racial diversity’s importance to progress in AI. For example, we see increased participation in organizations like AI4ALL and Women in Machine Learning (WiML), which encourage involvement by underrepresented groups. 5
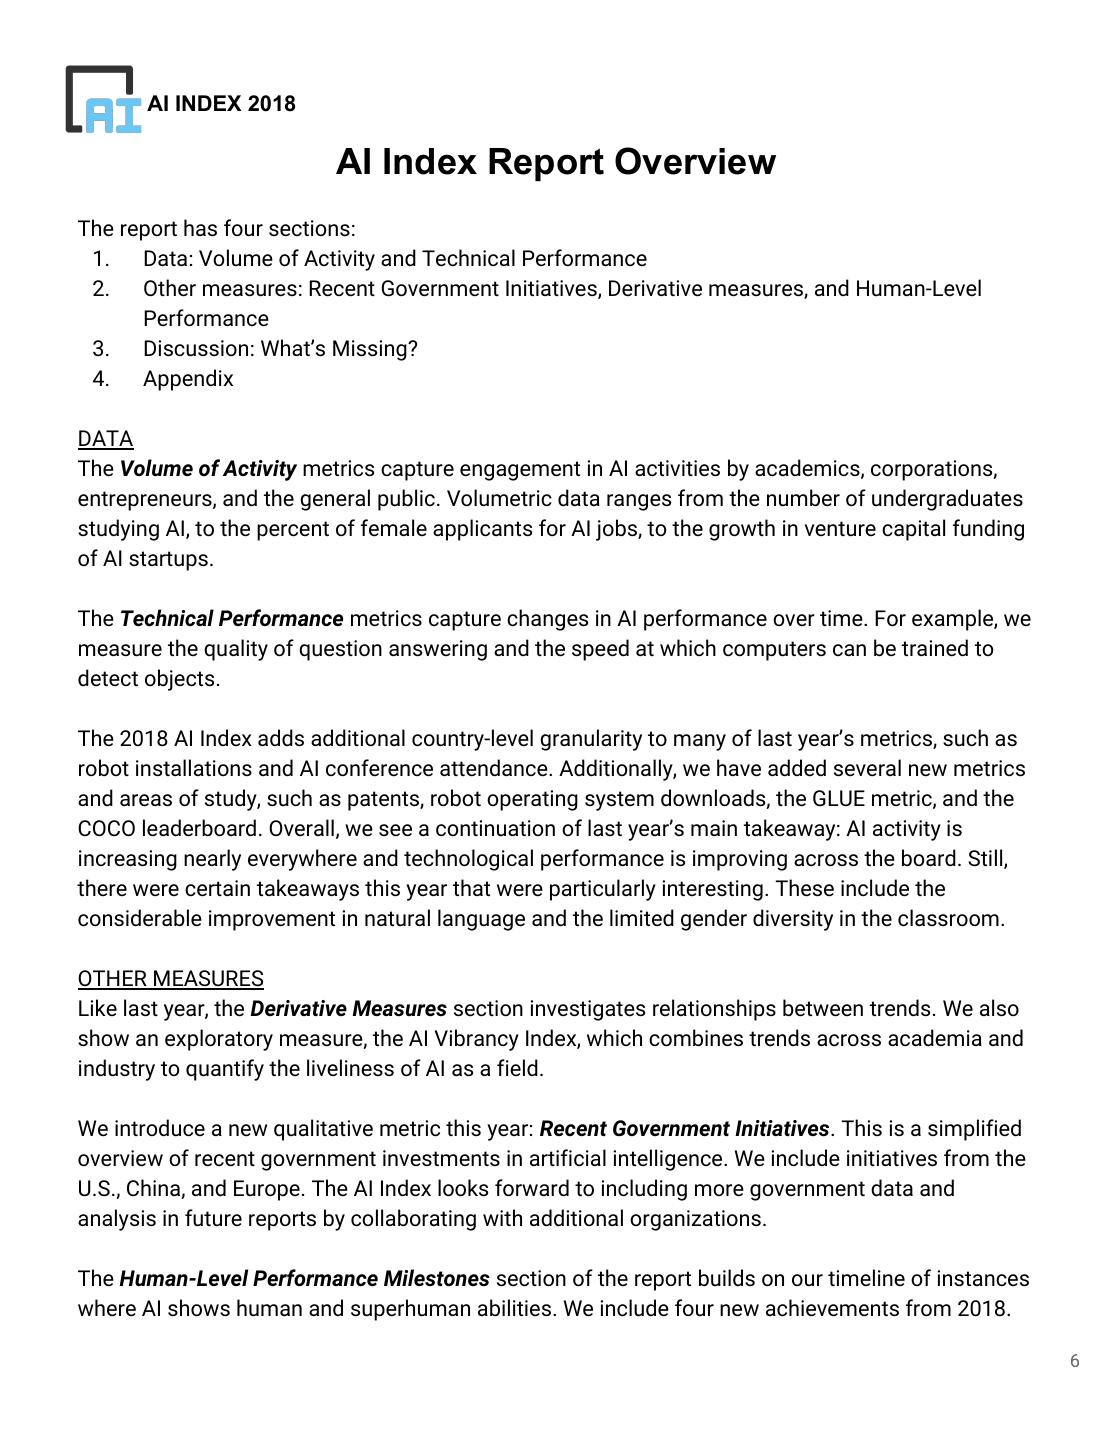
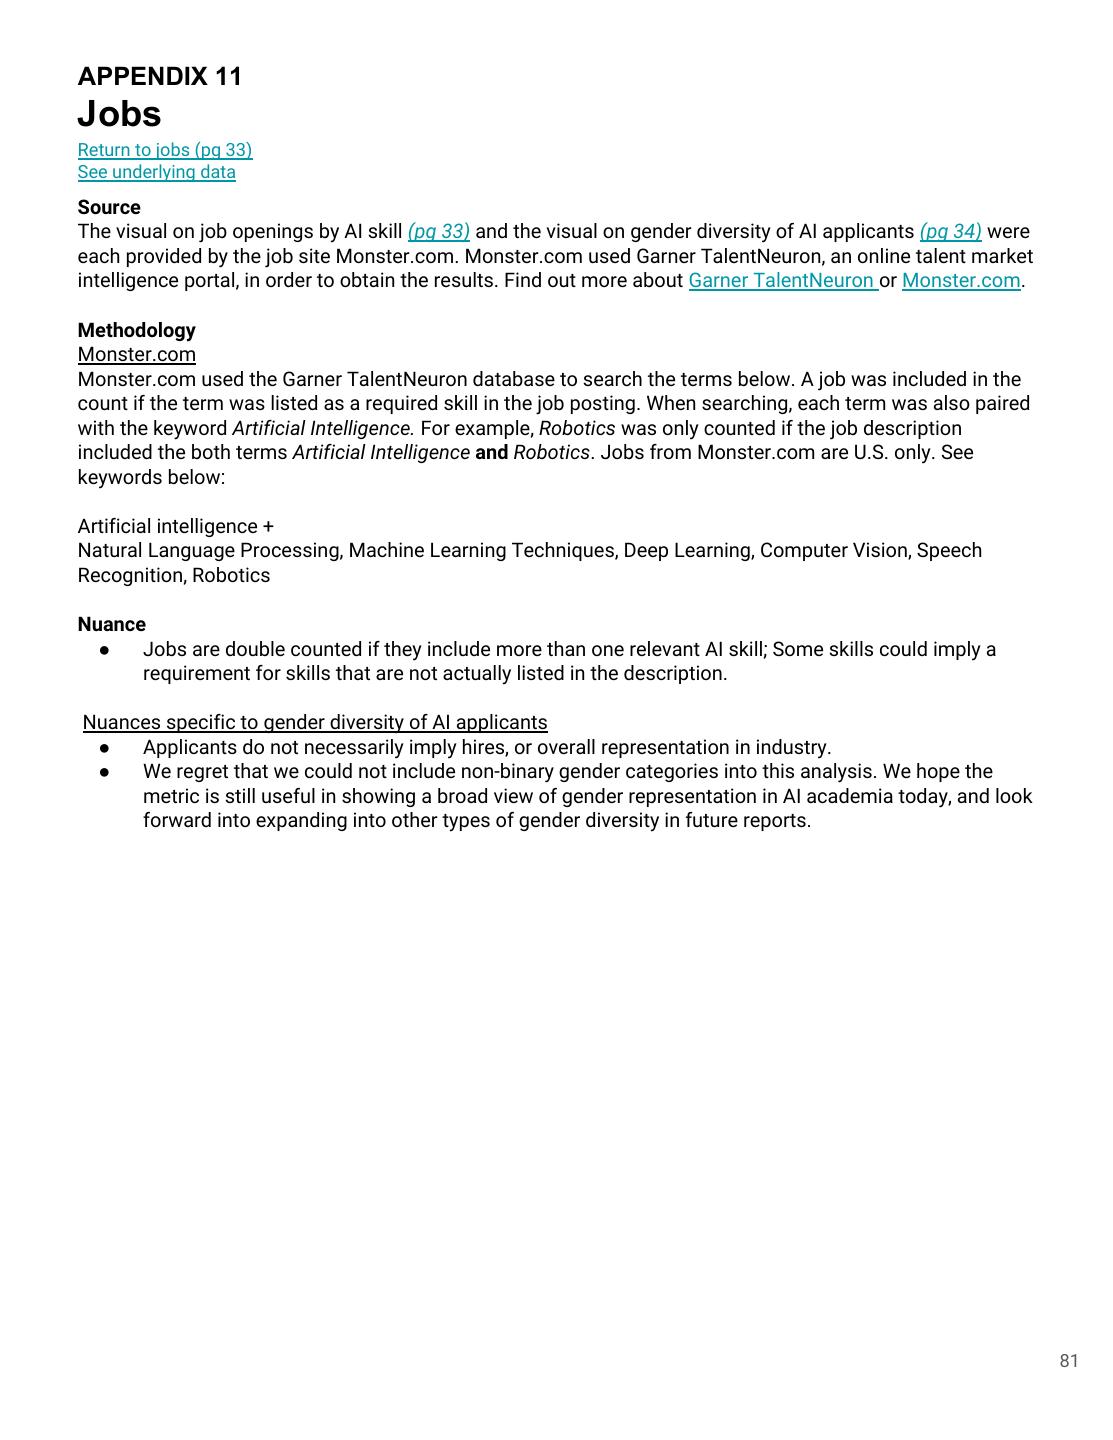
6 . AI INDEX 2018 AI Index Report Overview The report has four sections: 1. Data: Volume of Activity and Technical Performance 2. Other measures: Recent Government Initiatives, Derivative measures, and Human-Level Performance 3. Discussion: What’s Missing? 4. Appendix DATA The Volume of Activity metrics capture engagement in AI activities by academics, corporations, entrepreneurs, and the general public. Volumetric data ranges from the number of undergraduates studying AI, to the percent of female applicants for AI jobs, to the growth in venture capital funding of AI startups. The Technical Performance metrics capture changes in AI performance over time. For example, we measure the quality of question answering and the speed at which computers can be trained to detect objects. The 2018 AI Index adds additional country-level granularity to many of last year’s metrics, such as robot installations and AI conference attendance. Additionally, we have added several new metrics and areas of study, such as patents, robot operating system downloads, the GLUE metric, and the COCO leaderboard. Overall, we see a continuation of last year’s main takeaway: AI activity is increasing nearly everywhere and technological performance is improving across the board. Still, there were certain takeaways this year that were particularly interesting. These include the considerable improvement in natural language and the limited gender diversity in the classroom. OTHER MEASURES Like last year, the Derivative Measures section investigates relationships between trends. We also show an exploratory measure, the AI Vibrancy Index, which combines trends across academia and industry to quantify the liveliness of AI as a field. We introduce a new qualitative metric this year: Recent Government Initiatives. This is a simplified overview of recent government investments in artificial intelligence. We include initiatives from the U.S., China, and Europe. The AI Index looks forward to including more government data and analysis in future reports by collaborating with additional organizations. The Human-Level Performance Milestones section of the report builds on our timeline of instances where AI shows human and superhuman abilities. We include four new achievements from 2018. 6
7 . AI INDEX 2018 AI Index Report Overview (continued) Finally, to start a conversation in the AI community, the What’s Missing? section presents suggestions from a few experts in the field, who offer ideas about how the AI Index could be made more comprehensive and representative. APPENDIX The Appendix supplies readers with a fully transparent description of sources, methodologies, and nuances. Our appendix also houses underlying data for nearly every graph in the report. We hope that each member of the AI community interacts with the data most relevant to their work and interests. SYMBOLS We earmark pages with the globe symbol below when discussing AI’s universality. This includes country comparisons, deep dives into regions outside of the U.S., and data on diversity in the AI community. 7
8 .AI INDEX 2018 VOLUME OF ACTIVITY 8
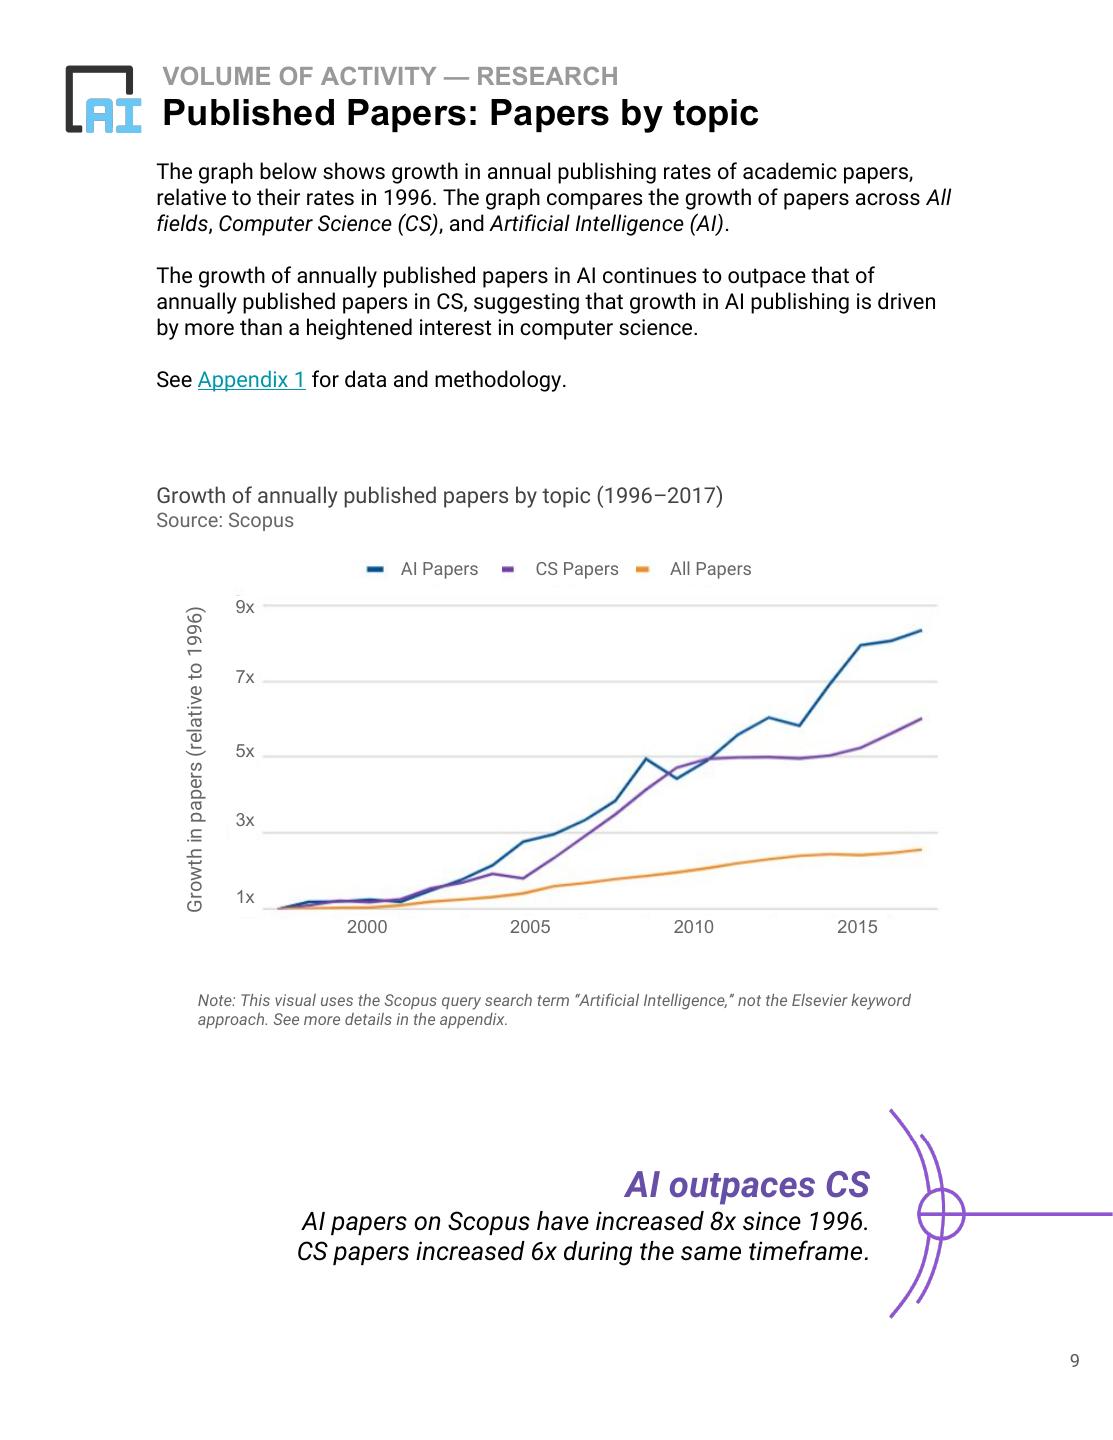
9 .VOLUME OF ACTIVITY — RESEARCH Published Papers: Papers by topic The graph below shows growth in annual publishing rates of academic papers, relative to their rates in 1996. The graph compares the growth of papers across All fields, Computer Science (CS), and Artificial Intelligence (AI). The growth of annually published papers in AI continues to outpace that of annually published papers in CS, suggesting that growth in AI publishing is driven by more than a heightened interest in computer science. See Appendix 1 for data and methodology. Growth of annually published papers by topic (1996–2017) Source: Scopus AI Papers CS Papers All Papers 9x Growth in papers (relative to 1996) 7x 5x 3x 1x 2000 2005 2010 2015 Note: This visual uses the Scopus query search term “Artificial Intelligence,” not the Elsevier keyword approach. See more details in the appendix. AI outpaces CS AI papers on Scopus have increased 8x since 1996. CS papers increased 6x during the same timeframe. 9
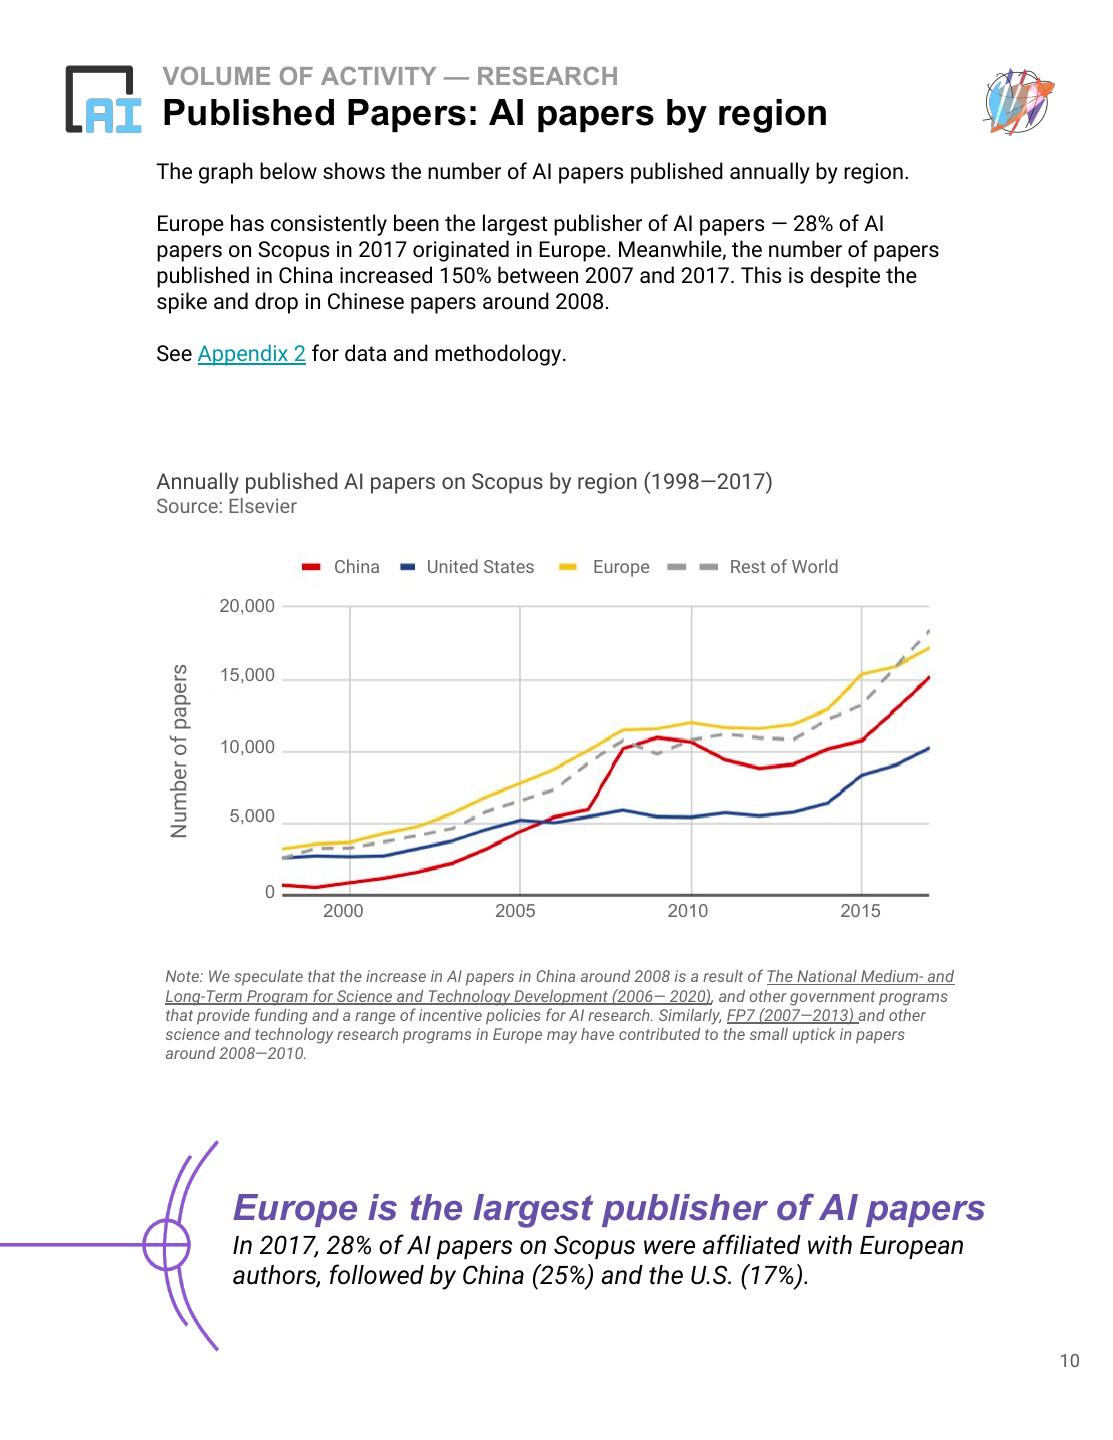
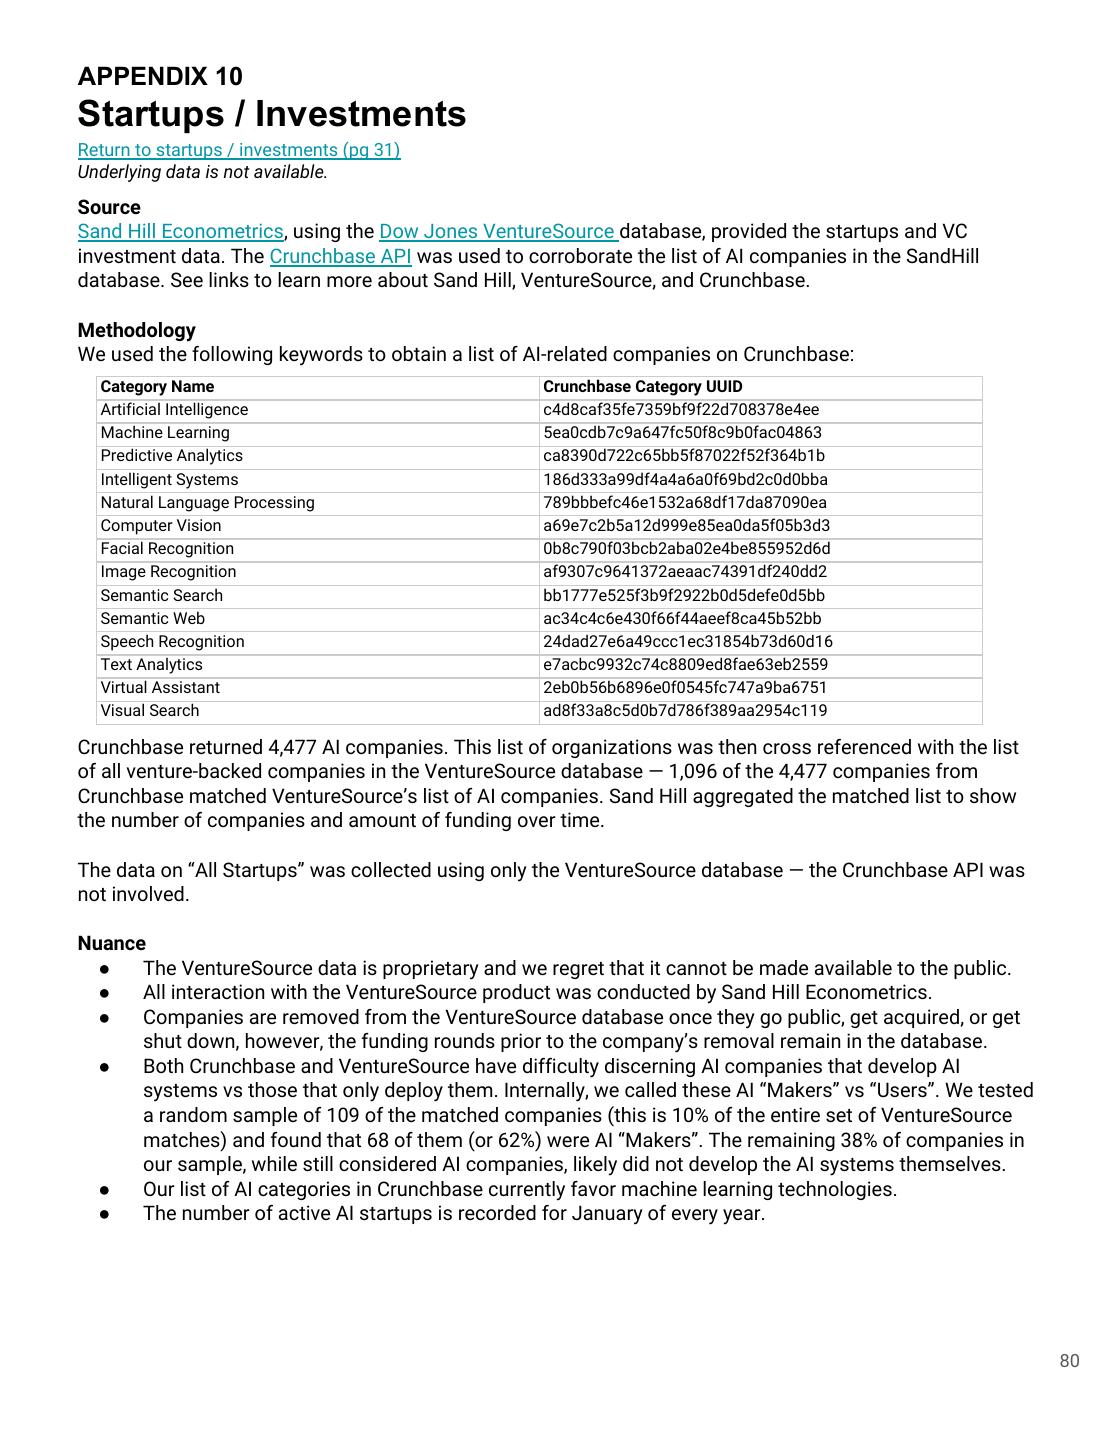
10 .VOLUME OF ACTIVITY — RESEARCH Published Papers: AI papers by region The graph below shows the number of AI papers published annually by region. Europe has consistently been the largest publisher of AI papers — 28% of AI papers on Scopus in 2017 originated in Europe. Meanwhile, the number of papers published in China increased 150% between 2007 and 2017. This is despite the spike and drop in Chinese papers around 2008. See Appendix 2 for data and methodology. Annually published AI papers on Scopus by region (1998—2017) Source: Elsevier China United States Europe Rest of World 20,000 Number of papers 15,000 10,000 5,000 0 2000 2005 2010 2015 Note: We speculate that the increase in AI papers in China around 2008 is a result of The National Medium- and Long-Term Program for Science and Technology Development (2006— 2020), and other government programs that provide funding and a range of incentive policies for AI research. Similarly, FP7 (2007—2013) and other science and technology research programs in Europe may have contributed to the small uptick in papers around 2008—2010. Europe is the largest publisher of AI papers In 2017, 28% of AI papers on Scopus were affiliated with European authors, followed by China (25%) and the U.S. (17%). 10
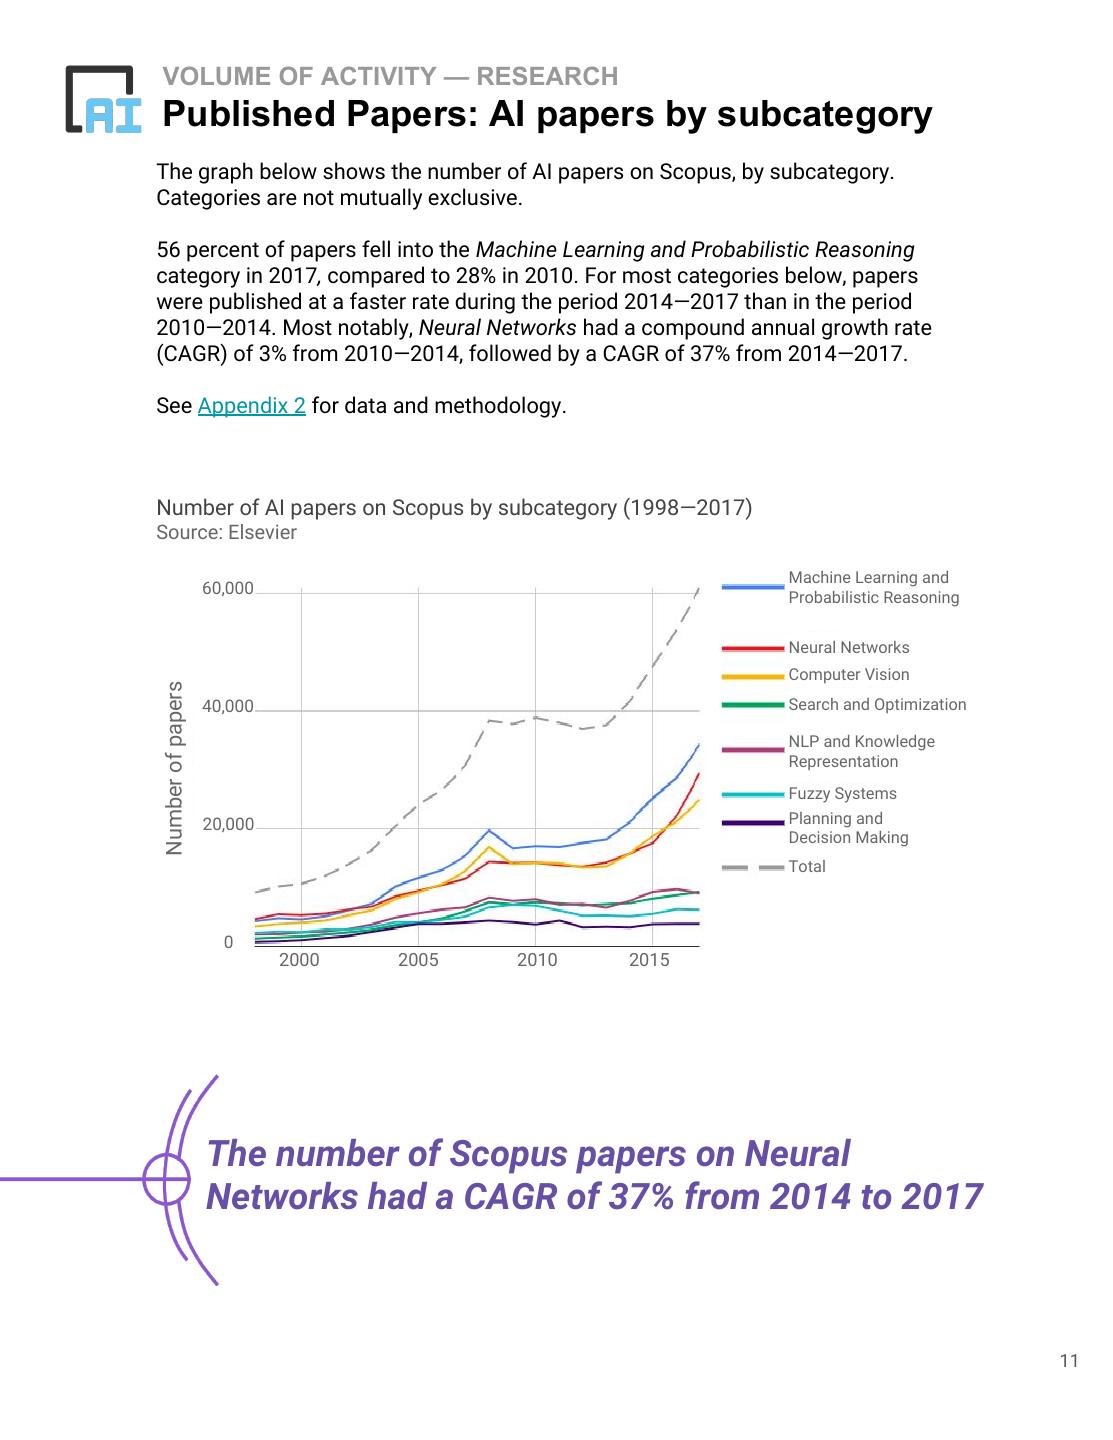
11 .VOLUME OF ACTIVITY — RESEARCH Published Papers: AI papers by subcategory The graph below shows the number of AI papers on Scopus, by subcategory. Categories are not mutually exclusive. 56 percent of papers fell into the Machine Learning and Probabilistic Reasoning category in 2017, compared to 28% in 2010. For most categories below, papers were published at a faster rate during the period 2014—2017 than in the period 2010—2014. Most notably, Neural Networks had a compound annual growth rate (CAGR) of 3% from 2010—2014, followed by a CAGR of 37% from 2014—2017. See Appendix 2 for data and methodology. Number of AI papers on Scopus by subcategory (1998—2017) Source: Elsevier Machine Learning and 60,000 Probabilistic Reasoning Neural Networks Computer Vision Number of papers 40,000 Search and Optimization NLP and Knowledge Representation Fuzzy Systems 20,000 Planning and Decision Making Total 0 2000 2005 2010 2015 The number of Scopus papers on Neural Networks had a CAGR of 37% from 2014 to 2017 11
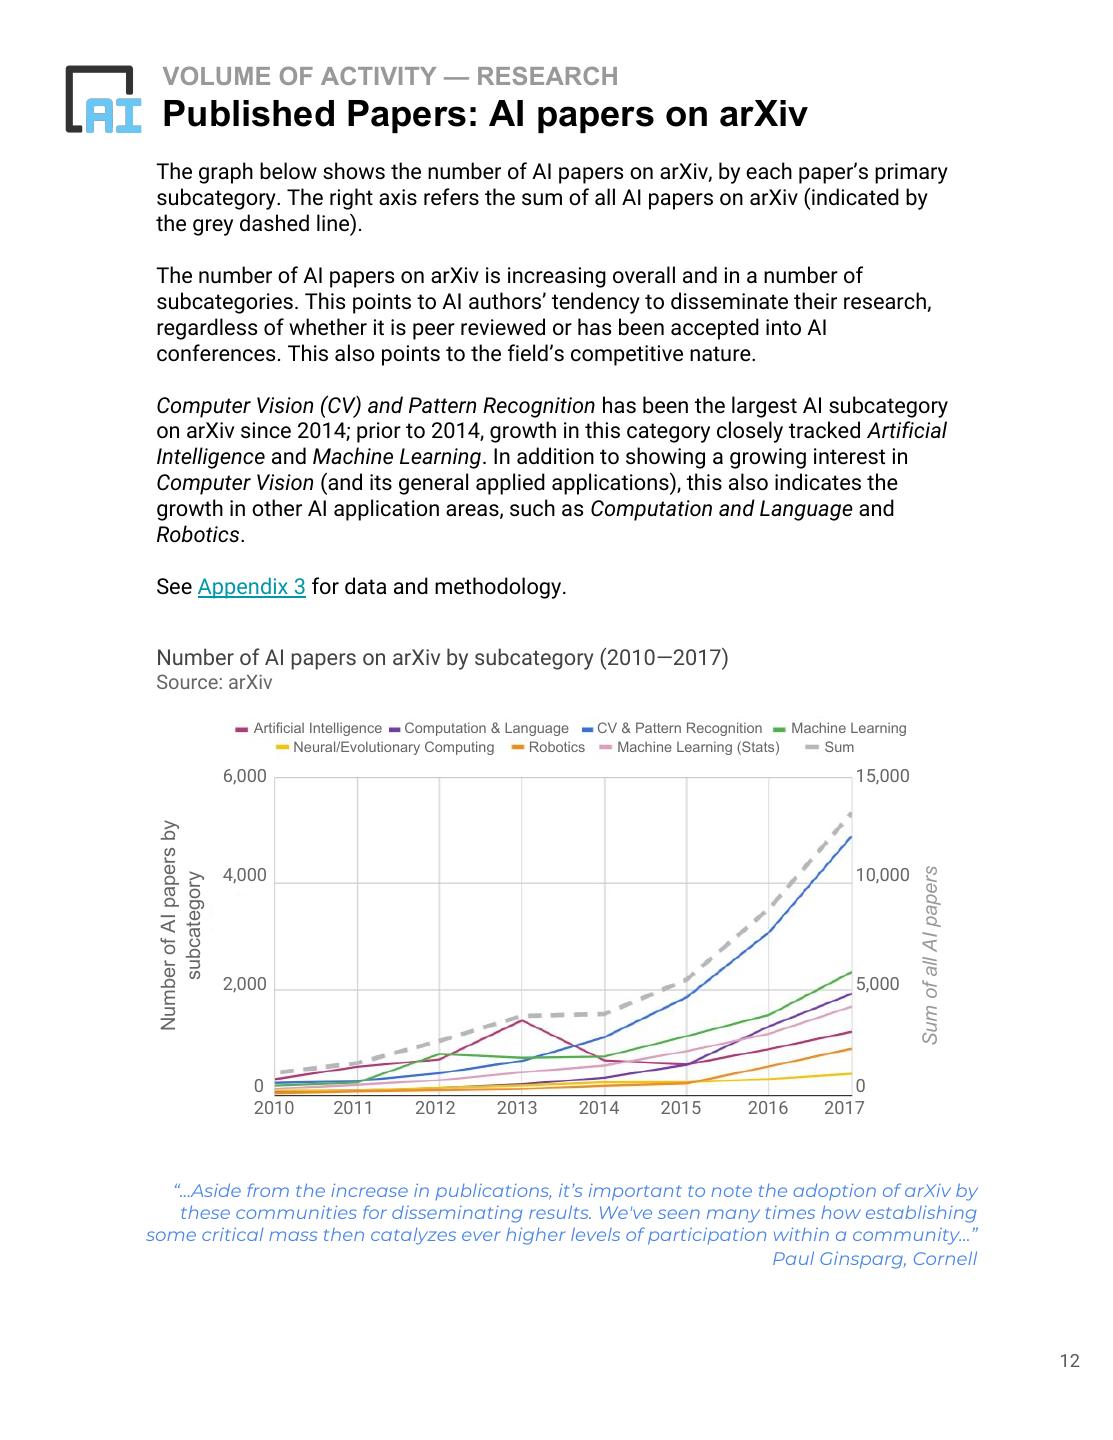
12 . VOLUME OF ACTIVITY — RESEARCH Published Papers: AI papers on arXiv The graph below shows the number of AI papers on arXiv, by each paper’s primary subcategory. The right axis refers the sum of all AI papers on arXiv (indicated by the grey dashed line). The number of AI papers on arXiv is increasing overall and in a number of subcategories. This points to AI authors’ tendency to disseminate their research, regardless of whether it is peer reviewed or has been accepted into AI conferences. This also points to the field’s competitive nature. Computer Vision (CV) and Pattern Recognition has been the largest AI subcategory on arXiv since 2014; prior to 2014, growth in this category closely tracked Artificial Intelligence and Machine Learning. In addition to showing a growing interest in Computer Vision (and its general applied applications), this also indicates the growth in other AI application areas, such as Computation and Language and Robotics. See Appendix 3 for data and methodology. Number of AI papers on arXiv by subcategory (2010—2017) Source: arXiv Artificial Intelligence Computation & Language CV & Pattern Recognition Machine Learning Neural/Evolutionary Computing Robotics Machine Learning (Stats) Sum 6,000 15,000 Number of AI papers by Sum of all AI papers 4,000 10,000 subcategory 2,000 5,000 0 0 2010 2011 2012 2013 2014 2015 2016 2017 “...Aside from the increase in publications, it’s important to note the adoption of arXiv by these communities for disseminating results. We've seen many times how establishing some critical mass then catalyzes ever higher levels of participation within a community...” Paul Ginsparg, Cornell 12
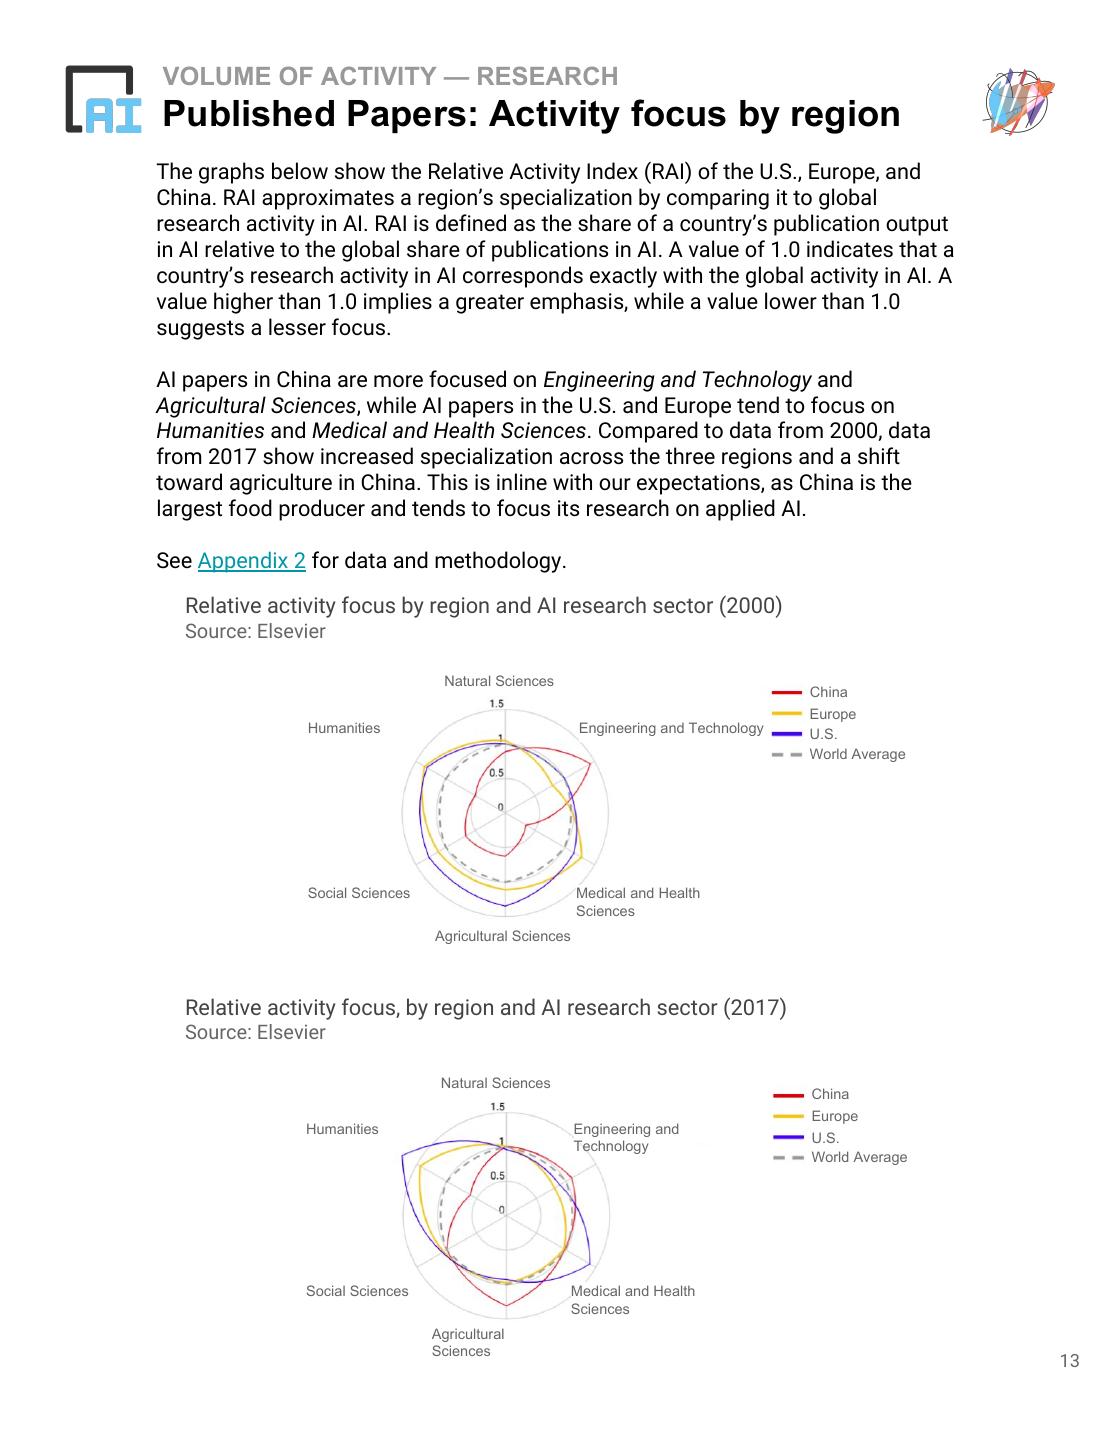
13 .VOLUME OF ACTIVITY — RESEARCH Published Papers: Activity focus by region The graphs below show the Relative Activity Index (RAI) of the U.S., Europe, and China. RAI approximates a region’s specialization by comparing it to global research activity in AI. RAI is defined as the share of a country’s publication output in AI relative to the global share of publications in AI. A value of 1.0 indicates that a country’s research activity in AI corresponds exactly with the global activity in AI. A value higher than 1.0 implies a greater emphasis, while a value lower than 1.0 suggests a lesser focus. AI papers in China are more focused on Engineering and Technology and Agricultural Sciences, while AI papers in the U.S. and Europe tend to focus on Humanities and Medical and Health Sciences. Compared to data from 2000, data from 2017 show increased specialization across the three regions and a shift toward agriculture in China. This is inline with our expectations, as China is the largest food producer and tends to focus its research on applied AI. See Appendix 2 for data and methodology. Relative activity focus by region and AI research sector (2000) Source: Elsevier Natural Sciences China Europe Humanities Engineering and Technology U.S. World Average Social Sciences Medical and Health Sciences Agricultural Sciences Relative activity focus, by region and AI research sector (2017) Source: Elsevier Natural Sciences China Europe Humanities Engineering and U.S. Technology World Average Social Sciences Medical and Health Sciences Agricultural Sciences 13
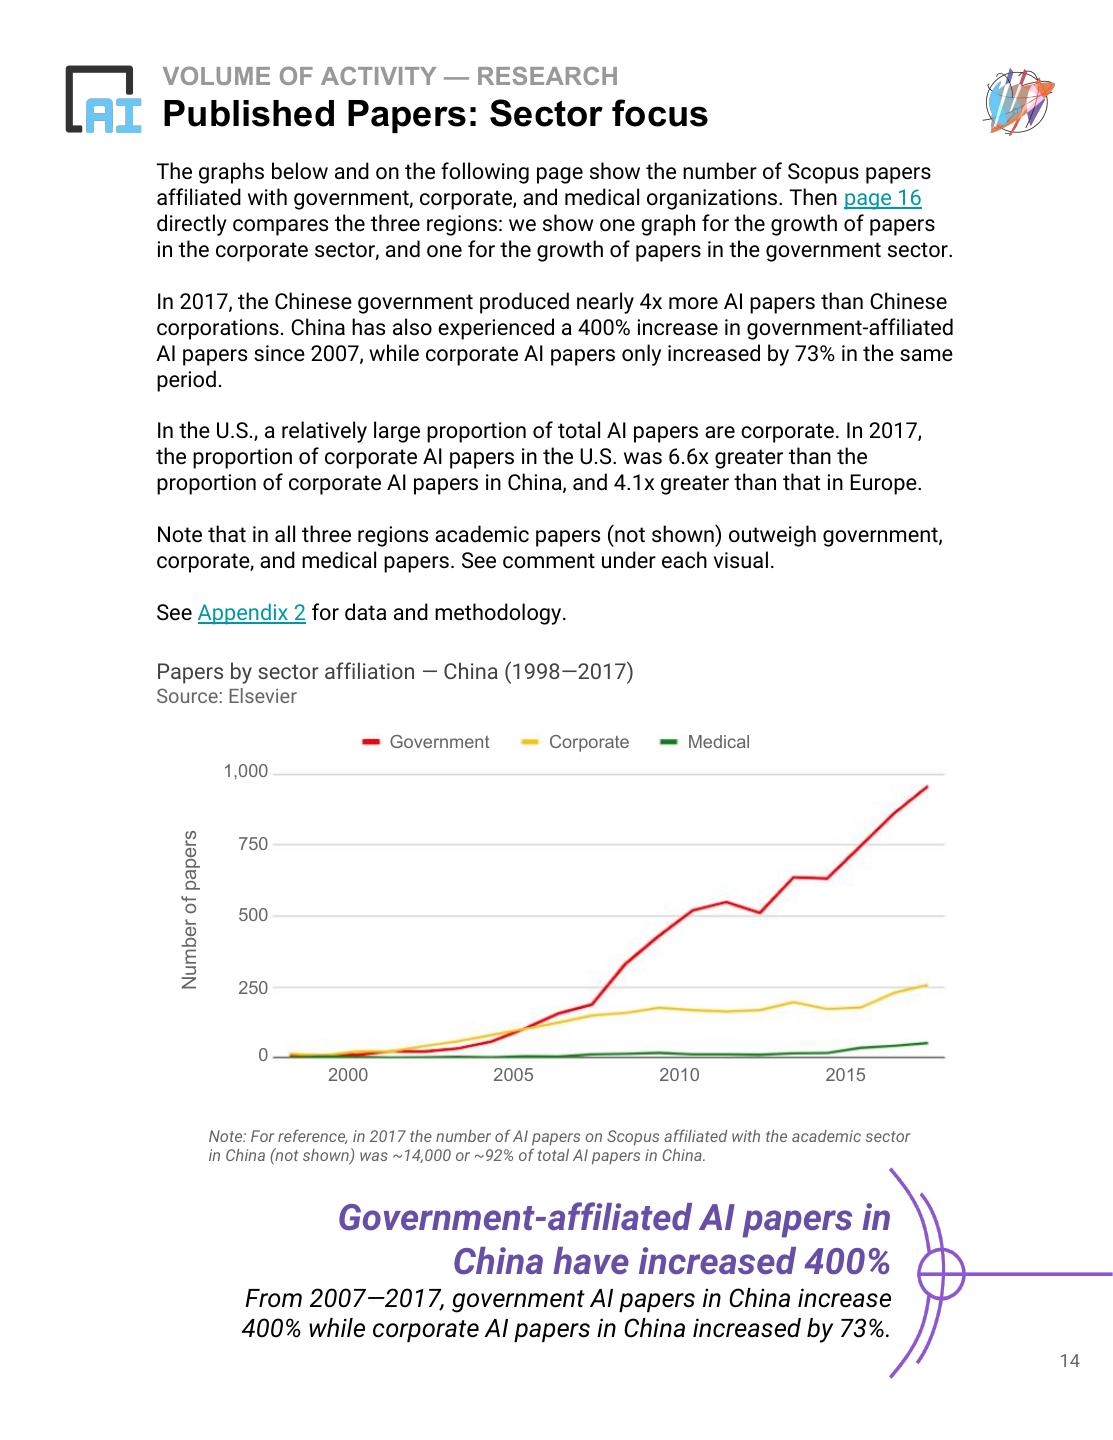
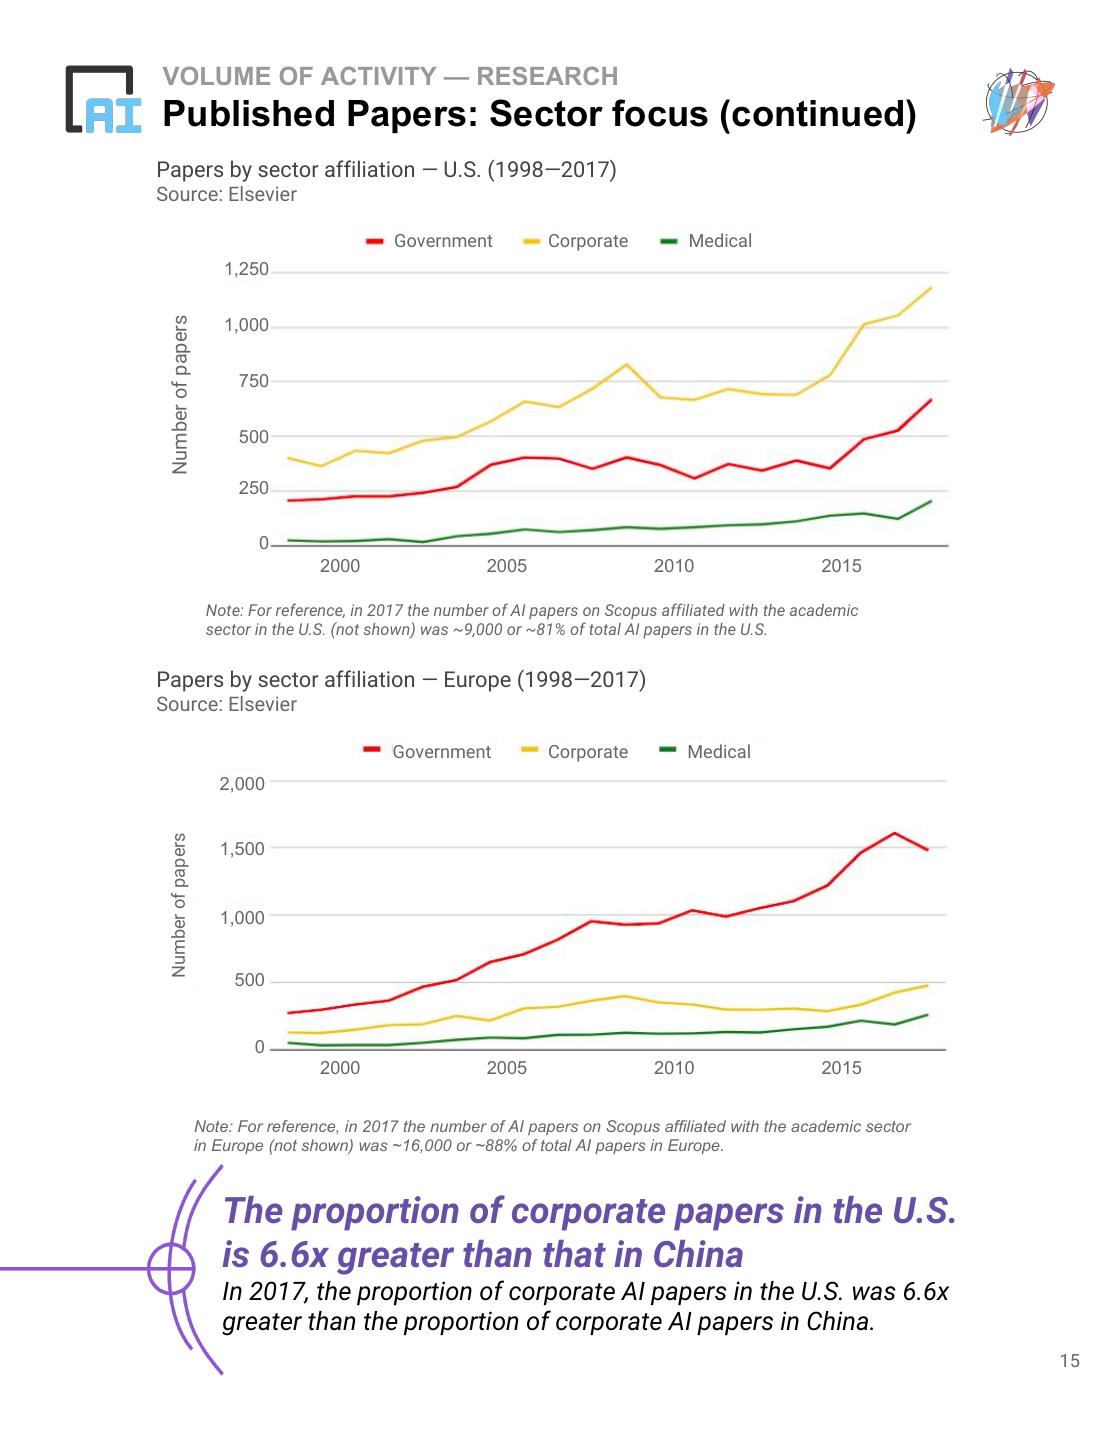
14 .VOLUME OF ACTIVITY — RESEARCH Published Papers: Sector focus The graphs below and on the following page show the number of Scopus papers affiliated with government, corporate, and medical organizations. Then page 16 directly compares the three regions: we show one graph for the growth of papers in the corporate sector, and one for the growth of papers in the government sector. In 2017, the Chinese government produced nearly 4x more AI papers than Chinese corporations. China has also experienced a 400% increase in government-affiliated AI papers since 2007, while corporate AI papers only increased by 73% in the same period. In the U.S., a relatively large proportion of total AI papers are corporate. In 2017, the proportion of corporate AI papers in the U.S. was 6.6x greater than the proportion of corporate AI papers in China, and 4.1x greater than that in Europe. Note that in all three regions academic papers (not shown) outweigh government, corporate, and medical papers. See comment under each visual. See Appendix 2 for data and methodology. Papers by sector affiliation — China (1998—2017) Source: Elsevier Government Corporate Medical 1,000 Number of papers 750 500 250 0 2000 2005 2010 2015 Note: For reference, in 2017 the number of AI papers on Scopus affiliated with the academic sector in China (not shown) was ~14,000 or ~92% of total AI papers in China. Government-affiliated AI papers in China have increased 400% From 2007—2017, government AI papers in China increase 400% while corporate AI papers in China increased by 73%. 14
15 .VOLUME OF ACTIVITY — RESEARCH Published Papers: Sector focus (continued) Papers by sector affiliation — U.S. (1998—2017) Source: Elsevier Government Corporate Medical 1,250 Number of papers 1,000 750 500 250 0 2000 2005 2010 2015 Note: For reference, in 2017 the number of AI papers on Scopus affiliated with the academic sector in the U.S. (not shown) was ~9,000 or ~81% of total AI papers in the U.S. Papers by sector affiliation — Europe (1998—2017) Source: Elsevier Government Corporate Medical 2,000 Number of papers 1,500 1,000 500 0 2000 2005 2010 2015 Note: For reference, in 2017 the number of AI papers on Scopus affiliated with the academic sector in Europe (not shown) was ~16,000 or ~88% of total AI papers in Europe. The proportion of corporate papers in the U.S. is 6.6x greater than that in China In 2017, the proportion of corporate AI papers in the U.S. was 6.6x greater than the proportion of corporate AI papers in China. 15
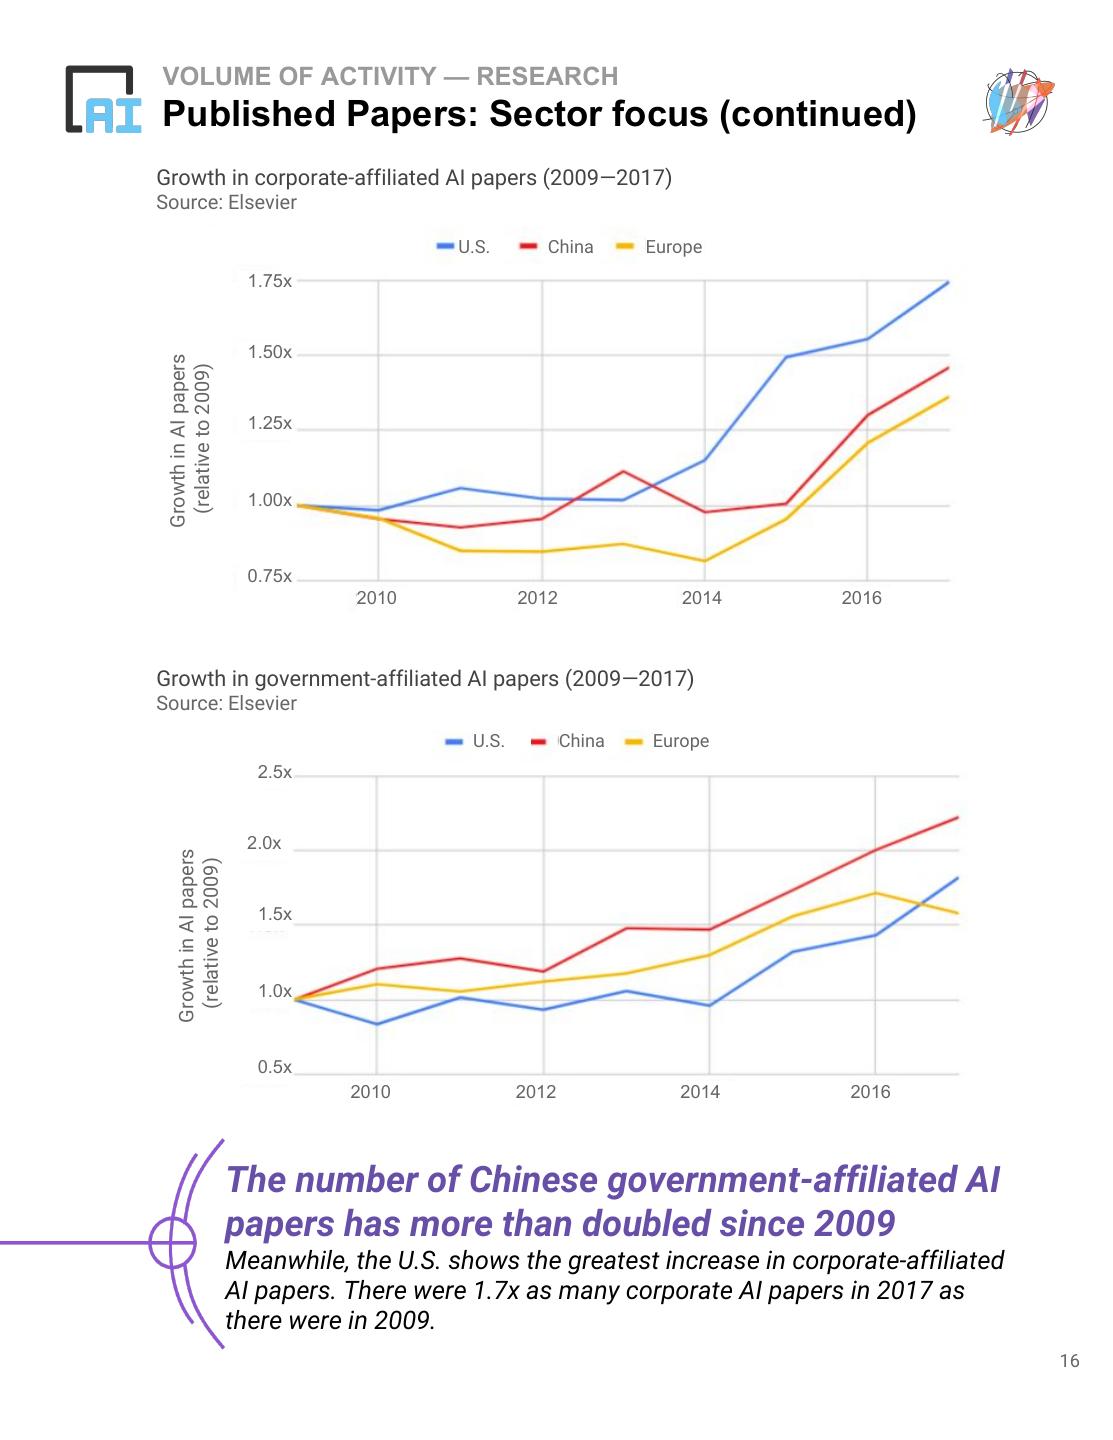
16 .VOLUME OF ACTIVITY — RESEARCH Published Papers: Sector focus (continued) Growth in corporate-affiliated AI papers (2009—2017) Source: Elsevier U.S. China Europe 1.75x 1.50x Growth in AI papers (relative to 2009) 1.25x 1.00x 0.75x 2010 2012 2014 2016 Growth in government-affiliated AI papers (2009—2017) Source: Elsevier U.S. China Europe 2.5x 2.0x Growth in AI papers (relative to 2009) 1.5x 1.0x 0.5x 2010 2012 2014 2016 The number of Chinese government-affiliated AI papers has more than doubled since 2009 Meanwhile, the U.S. shows the greatest increase in corporate-affiliated AI papers. There were 1.7x as many corporate AI papers in 2017 as there were in 2009. 16
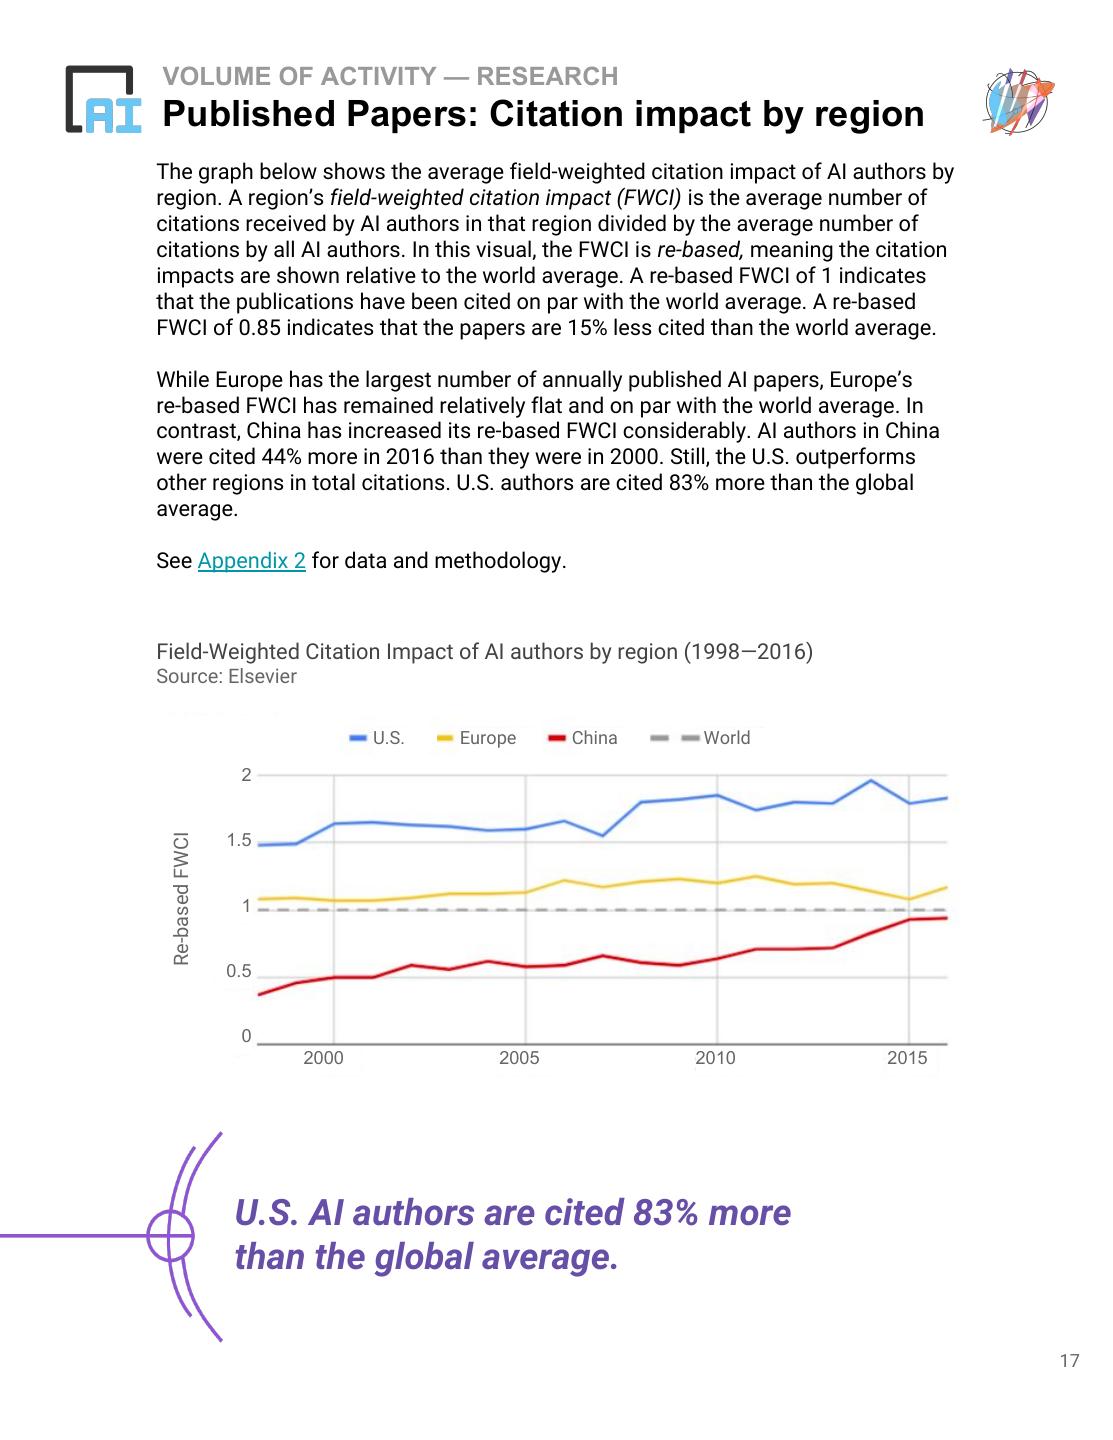
17 .VOLUME OF ACTIVITY — RESEARCH Published Papers: Citation impact by region The graph below shows the average field-weighted citation impact of AI authors by region. A region’s field-weighted citation impact (FWCI) is the average number of citations received by AI authors in that region divided by the average number of citations by all AI authors. In this visual, the FWCI is re-based, meaning the citation impacts are shown relative to the world average. A re-based FWCI of 1 indicates that the publications have been cited on par with the world average. A re-based FWCI of 0.85 indicates that the papers are 15% less cited than the world average. While Europe has the largest number of annually published AI papers, Europe’s re-based FWCI has remained relatively flat and on par with the world average. In contrast, China has increased its re-based FWCI considerably. AI authors in China were cited 44% more in 2016 than they were in 2000. Still, the U.S. outperforms other regions in total citations. U.S. authors are cited 83% more than the global average. See Appendix 2 for data and methodology. Field-Weighted Citation Impact of AI authors by region (1998—2016) Source: Elsevier U.S. Europe China World 2 Re-based FWCI 1.5 1 0.5 0 2000 2005 2010 2015 U.S. AI authors are cited 83% more than the global average. 17
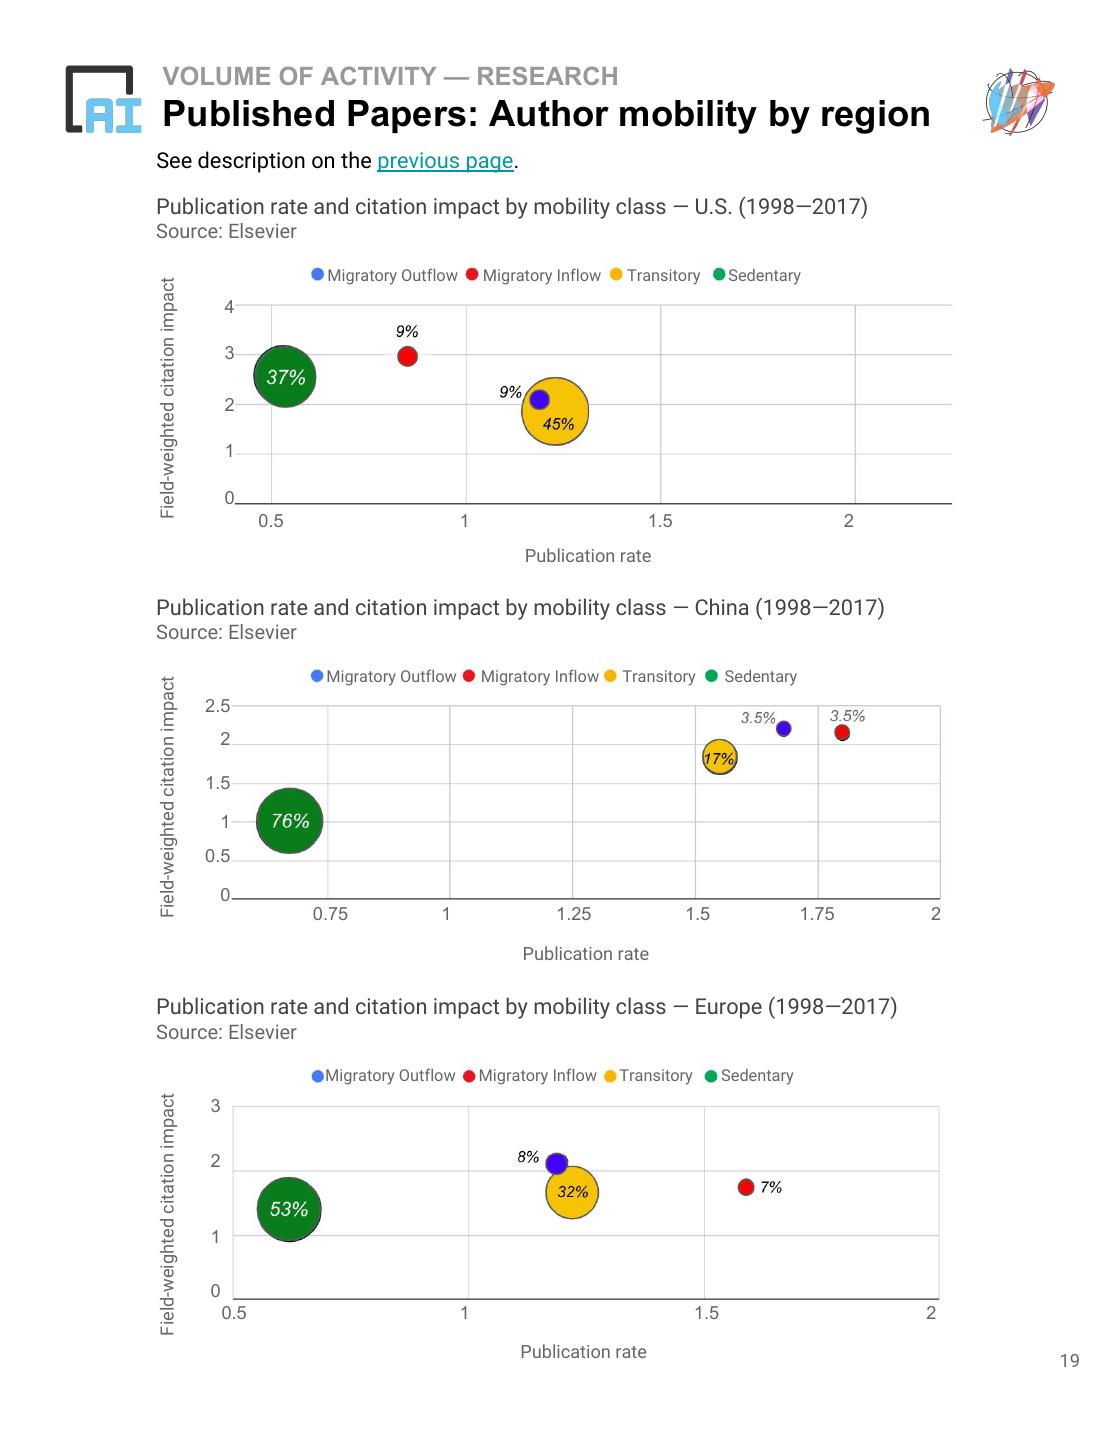
18 .VOLUME OF ACTIVITY — RESEARCH Published Papers: Author mobility by region The graphs on the following page show the effect of international mobility on the publication rate and the citation impact of AI authors. We look at four mobility classes: Sedentary, Transitory, Migratory Inflow and Migratory Outflow. Sedentary authors are active researchers who have not published outside of their home region. Transitory authors have published in a region outside their home for two years or less. Migratory authors contribute papers to a region other than their own for two or more years. Whether an author is considered migratory inflow or migratory outflow depends on the perspective of the graph. The x-axis shows the relative publication rate — the average number of publications for authors in each class divided by the average number of publications for that region overall. The y-axis shows the field-weighted citation impact (FWCI) — the average number of citations received by authors in each mobility class divided by the average number of citations for the region overall. Only AI authors were considered in this analysis. An author is an “AI author” if at least 30% of his or her papers cover artificial intelligence. An author’s home region is the region where they published their first paper. … Across the U.S., China, and Europe, the publication rate is lowest for sedentary authors. Additionally, in the three regions, migratory authors (a combination of migratory inflow and outflow) have the highest FWCI. So, authors that move tend to have a greater number of citations and tend to publish more frequently. Of the three regions, China has the largest proportion of sedentary AI authors (76%), followed by Europe (52%), and then the U.S. (38%). Though a larger proportion of Chinese authors are sedentary, non-sedentary authors in China tend to have higher publication rates than non-sedentary authors in the other two regions. In other words, while geographically mobile Chinese authors are relatively few, they tend to be more productive than the average mobile author elsewhere. See Appendix 2 for data and methodology. Mobile authors have a greater number of citations and publish more frequently 18
19 . VOLUME OF ACTIVITY — RESEARCH Published Papers: Author mobility by region See description on the previous page. Publication rate and citation impact by mobility class — U.S. (1998—2017) Source: Elsevier Migratory Outflow Migratory Inflow Transitory Sedentary Field-weighted citation impact 4 3 2 1 0 0.5 1 1.5 2 Publication rate Publication rate and citation impact by mobility class — China (1998—2017) Source: Elsevier Migratory Outflow Migratory Inflow Transitory Sedentary Field-weighted citation impact 2.5 2 1.5 1 0.5 0 0.75 1 1.25 1.5 1.75 2 Publication rate Publication rate and citation impact by mobility class — Europe (1998—2017) Source: Elsevier Migratory Outflow Migratory Inflow Transitory Sedentary Field-weighted citation impact 3 2 1 0 0.5 1 1.5 2 Publication rate 19
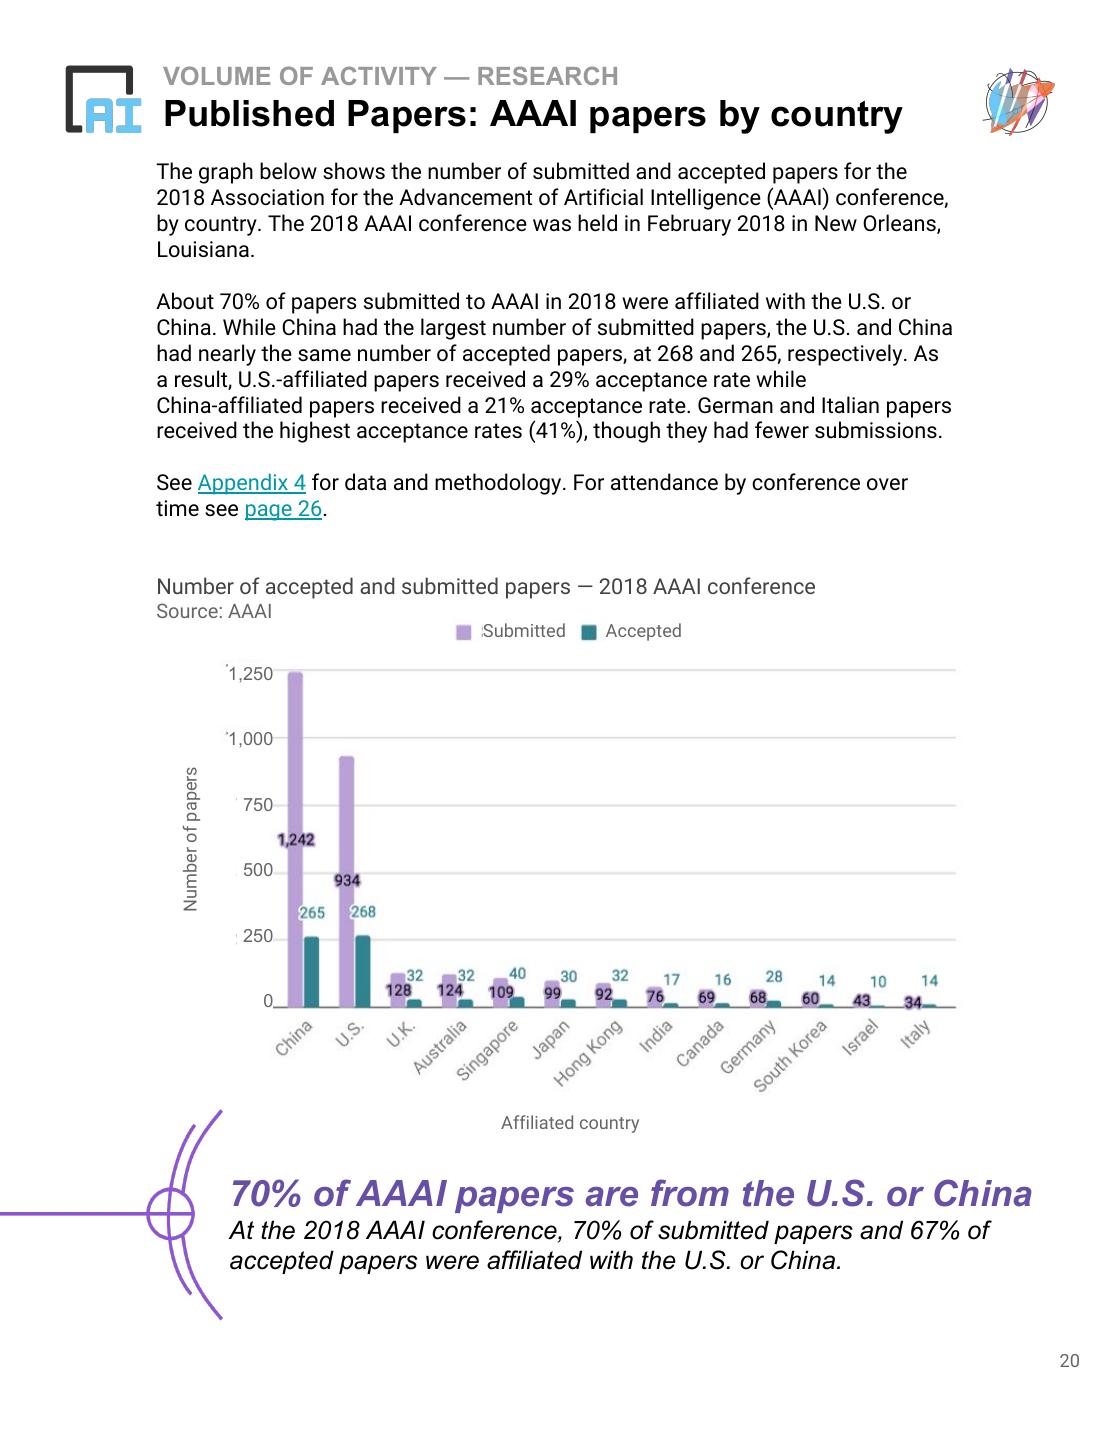
20 .VOLUME OF ACTIVITY — RESEARCH Published Papers: AAAI papers by country The graph below shows the number of submitted and accepted papers for the 2018 Association for the Advancement of Artificial Intelligence (AAAI) conference, by country. The 2018 AAAI conference was held in February 2018 in New Orleans, Louisiana. About 70% of papers submitted to AAAI in 2018 were affiliated with the U.S. or China. While China had the largest number of submitted papers, the U.S. and China had nearly the same number of accepted papers, at 268 and 265, respectively. As a result, U.S.-affiliated papers received a 29% acceptance rate while China-affiliated papers received a 21% acceptance rate. German and Italian papers received the highest acceptance rates (41%), though they had fewer submissions. See Appendix 4 for data and methodology. For attendance by conference over time see page 26. Number of accepted and submitted papers — 2018 AAAI conference Source: AAAI Submitted Accepted 1,250 1,000 Number of papers 750 500 250 0 Affiliated country 70% of AAAI papers are from the U.S. or China At the 2018 AAAI conference, 70% of submitted papers and 67% of accepted papers were affiliated with the U.S. or China. 20
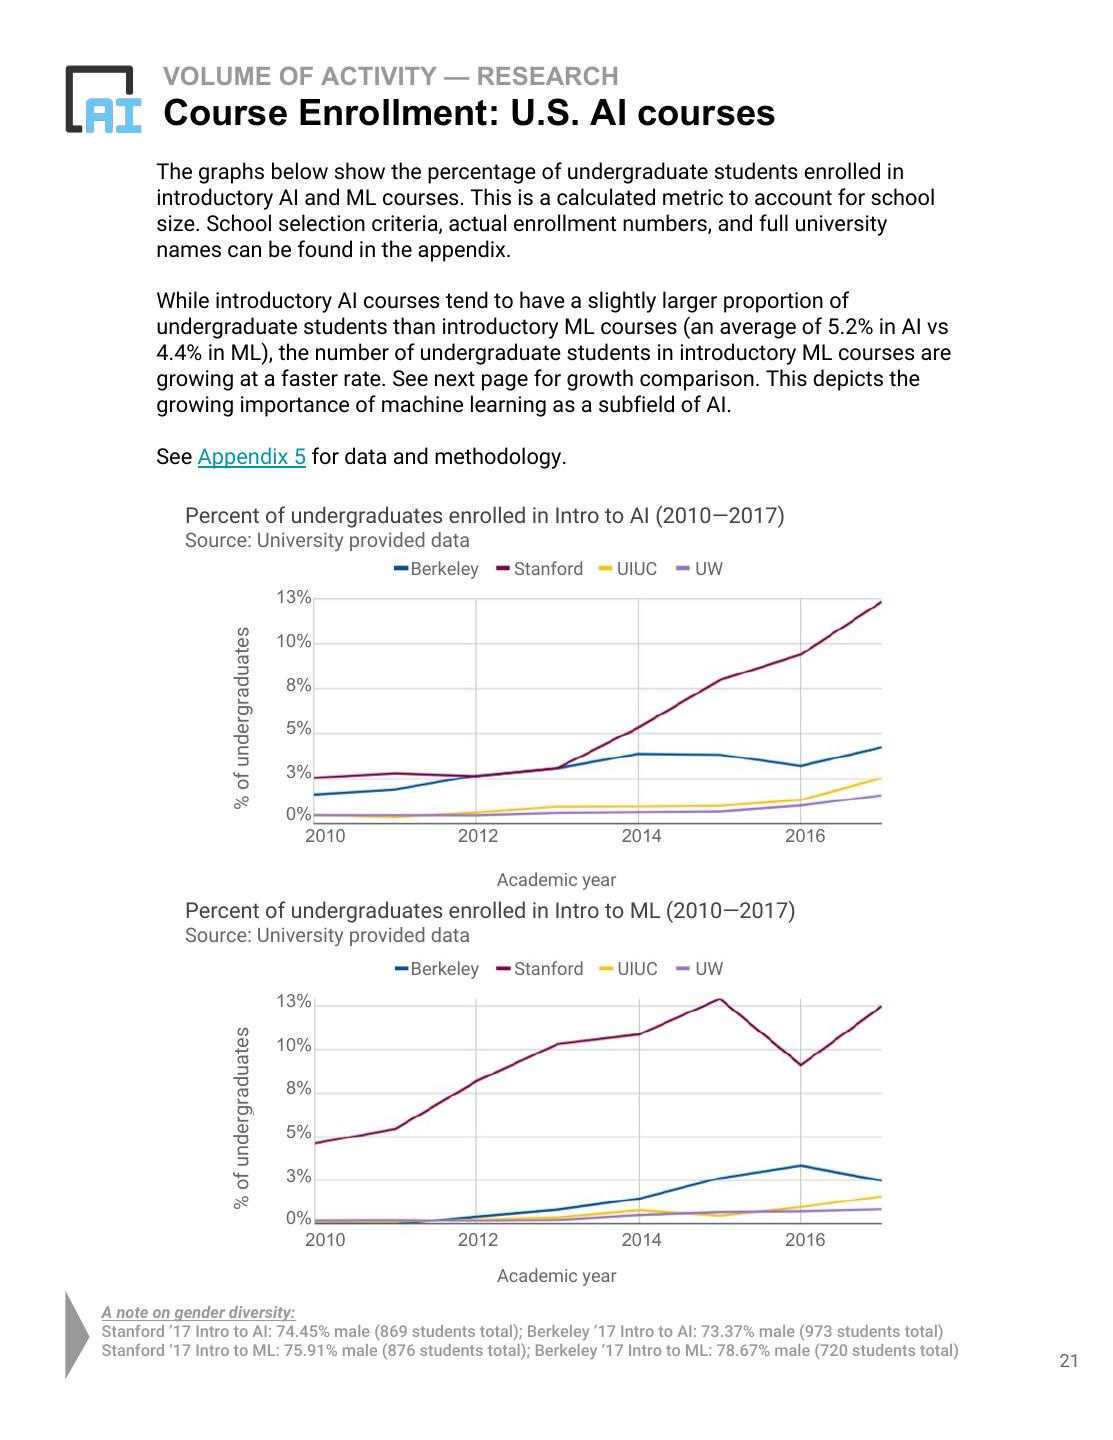
21 . VOLUME OF ACTIVITY — RESEARCH Course Enrollment: U.S. AI courses The graphs below show the percentage of undergraduate students enrolled in introductory AI and ML courses. This is a calculated metric to account for school size. School selection criteria, actual enrollment numbers, and full university names can be found in the appendix. While introductory AI courses tend to have a slightly larger proportion of undergraduate students than introductory ML courses (an average of 5.2% in AI vs 4.4% in ML), the number of undergraduate students in introductory ML courses are growing at a faster rate. See next page for growth comparison. This depicts the growing importance of machine learning as a subfield of AI. See Appendix 5 for data and methodology. Percent of undergraduates enrolled in Intro to AI (2010—2017) Source: University provided data Berkeley Stanford UIUC UW 13% % of undergraduates 10% 8% 5% 3% 0% 2010 2012 2014 2016 Academic year Percent of undergraduates enrolled in Intro to ML (2010—2017) Source: University provided data Berkeley Stanford UIUC UW 13% % of undergraduates 10% 8% 5% 3% 0% 2010 2012 2014 2016 Academic year A note on gender diversity: Stanford ’17 Intro to AI: 74.45% male (869 students total); Berkeley ‘17 Intro to AI: 73.37% male (973 students total) Stanford ‘17 Intro to ML: 75.91% male (876 students total); Berkeley ‘17 Intro to ML: 78.67% male (720 students total) 21
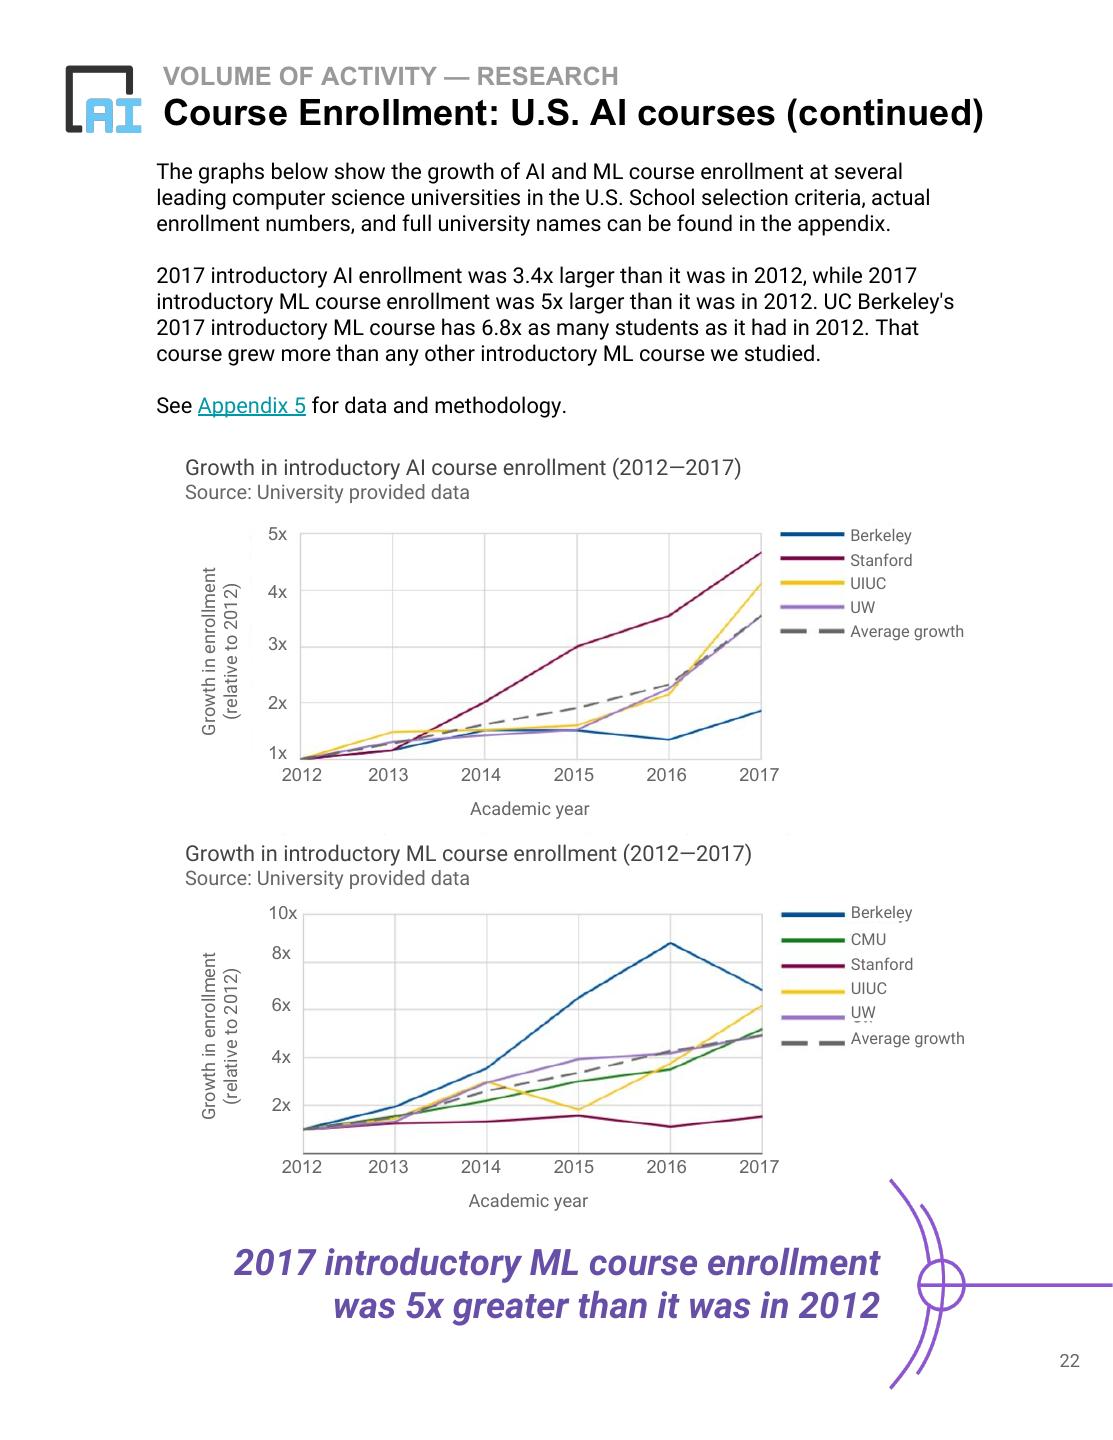
22 .VOLUME OF ACTIVITY — RESEARCH Course Enrollment: U.S. AI courses (continued) The graphs below show the growth of AI and ML course enrollment at several leading computer science universities in the U.S. School selection criteria, actual enrollment numbers, and full university names can be found in the appendix. 2017 introductory AI enrollment was 3.4x larger than it was in 2012, while 2017 introductory ML course enrollment was 5x larger than it was in 2012. UC Berkeley's 2017 introductory ML course has 6.8x as many students as it had in 2012. That course grew more than any other introductory ML course we studied. See Appendix 5 for data and methodology. Growth in introductory AI course enrollment (2012—2017) Source: University provided data 5x Berkeley Stanford Growth in enrollment UIUC (relative to 2012) 4x UW Average growth 3x 2x 1x 2012 2013 2014 2015 2016 2017 Academic year Growth in introductory ML course enrollment (2012—2017) Source: University provided data 10x Berkeley CMU 8x Growth in enrollment Stanford (relative to 2012) UIUC 6x UW Average growth 4x 2x 2012 2013 2014 2015 2016 2017 Academic year 2017 introductory ML course enrollment was 5x greater than it was in 2012 22
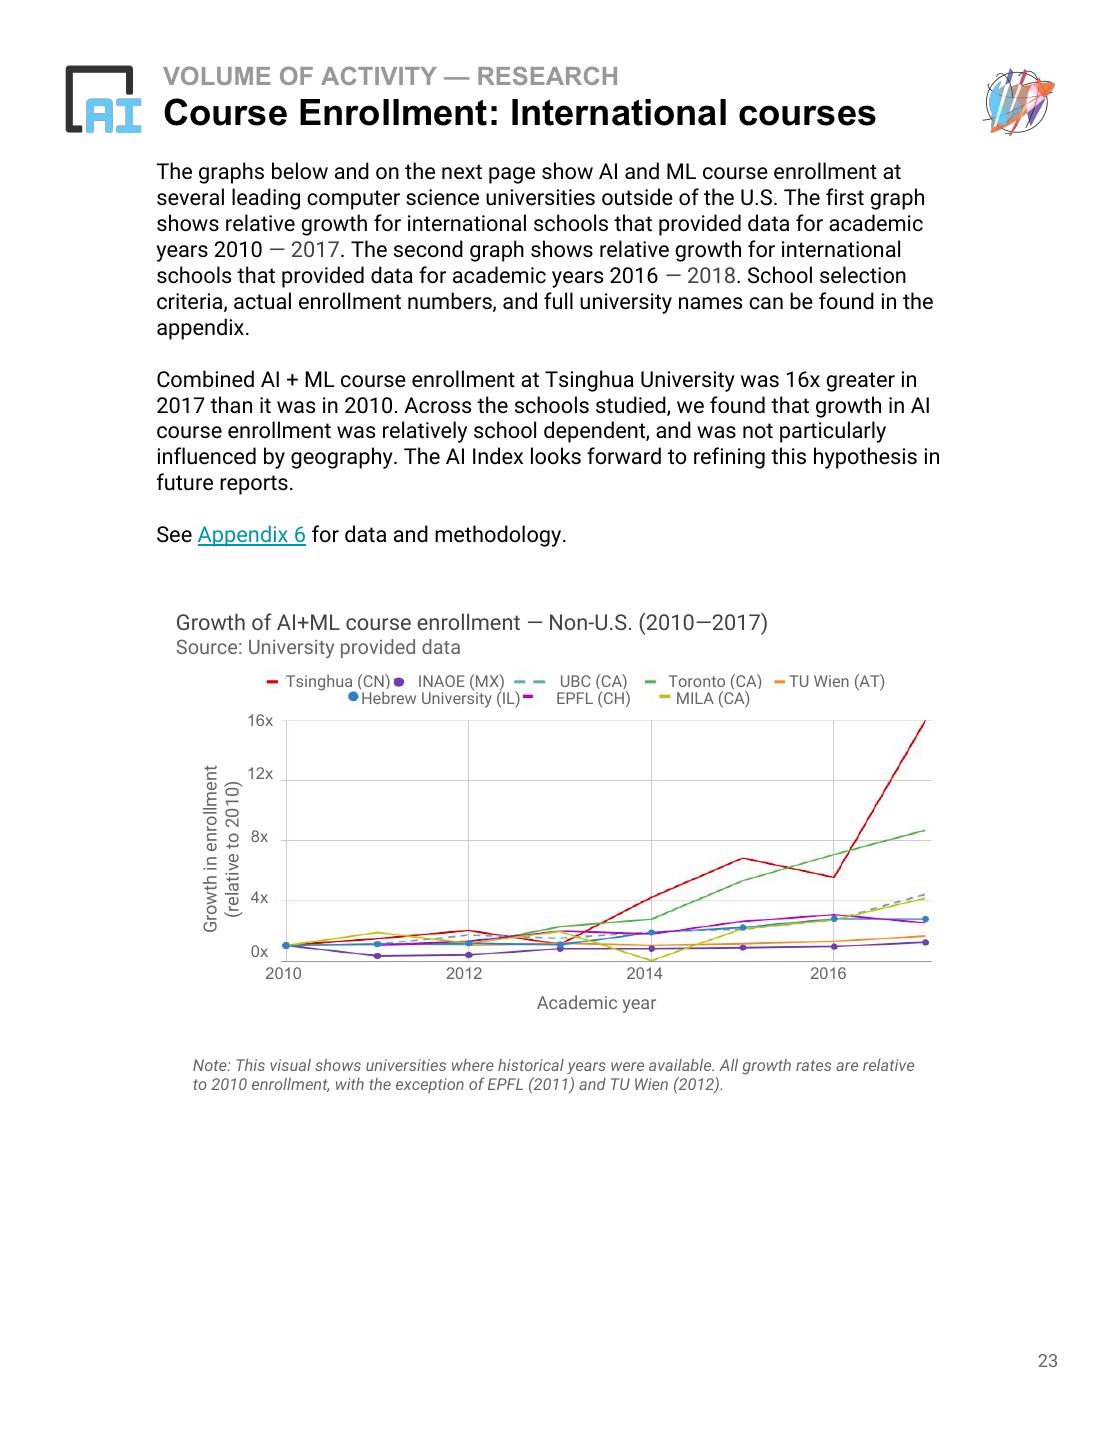
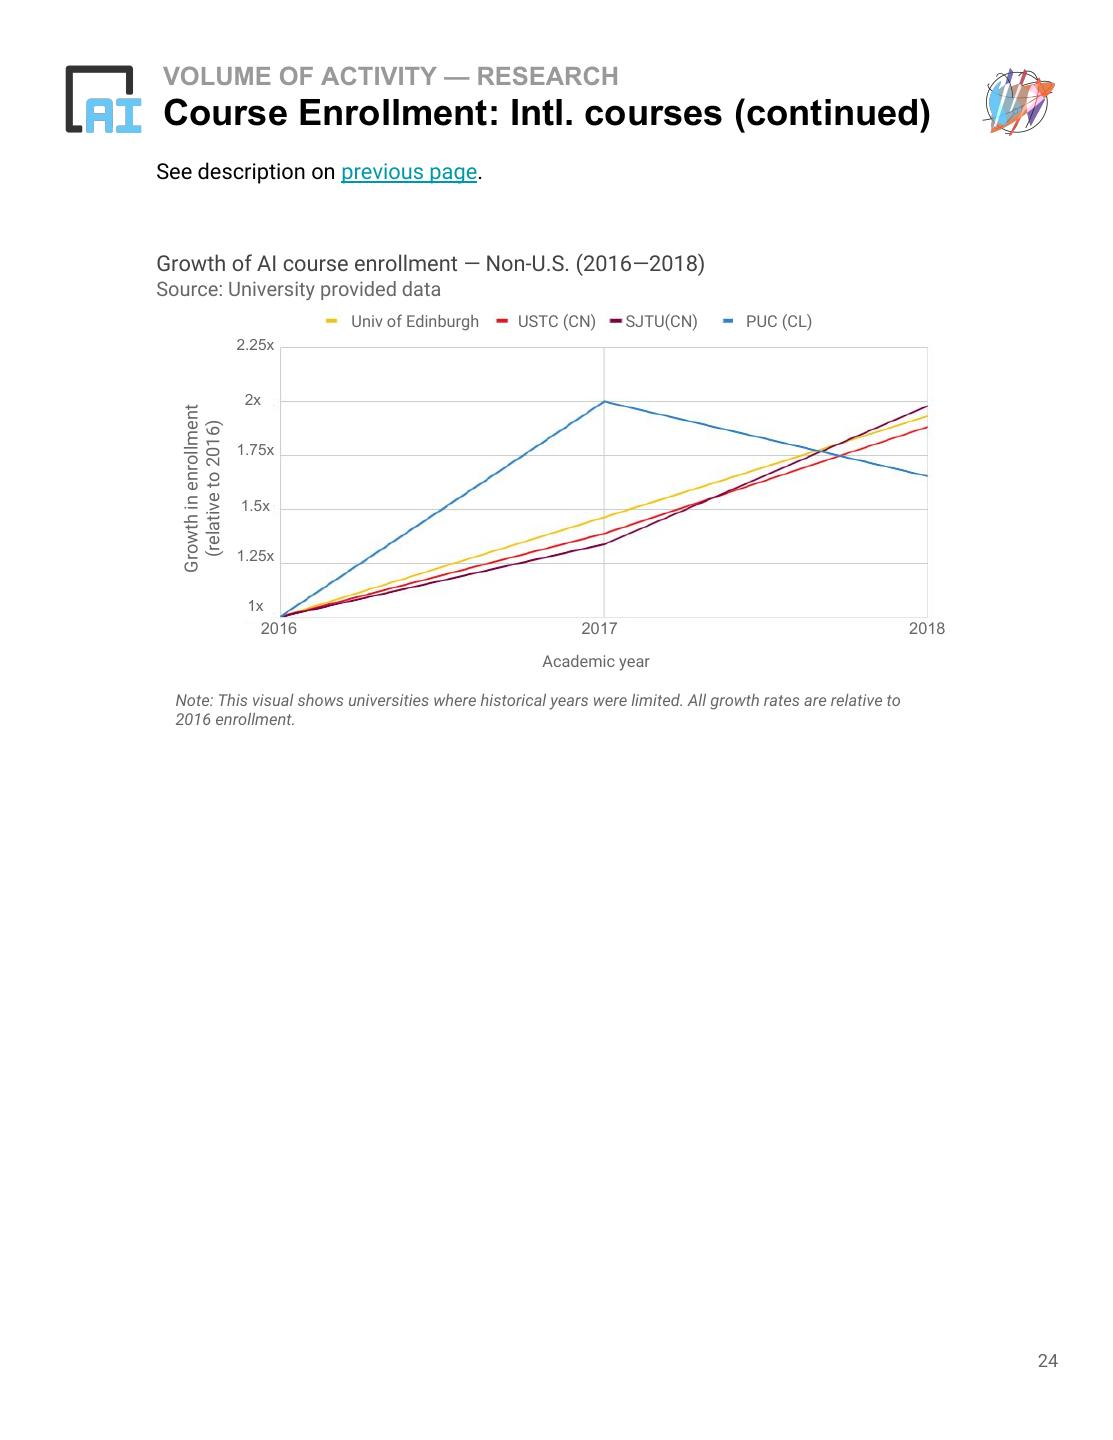
23 .VOLUME OF ACTIVITY — RESEARCH Course Enrollment: International courses The graphs below and on the next page show AI and ML course enrollment at several leading computer science universities outside of the U.S. The first graph shows relative growth for international schools that provided data for academic years 2010 — 2017. The second graph shows relative growth for international schools that provided data for academic years 2016 — 2018. School selection criteria, actual enrollment numbers, and full university names can be found in the appendix. Combined AI + ML course enrollment at Tsinghua University was 16x greater in 2017 than it was in 2010. Across the schools studied, we found that growth in AI course enrollment was relatively school dependent, and was not particularly influenced by geography. The AI Index looks forward to refining this hypothesis in future reports. See Appendix 6 for data and methodology. Growth of AI+ML course enrollment — Non-U.S. (2010—2017) Source: University provided data Tsinghua (CN) INAOE (MX) UBC (CA) Toronto (CA) TU Wien (AT) Hebrew University (IL) EPFL (CH) MILA (CA) 16x Growth in enrollment 12x (relative to 2010) 8x 4x 0x 2010 2012 2014 2016 Academic year Note: This visual shows universities where historical years were available. All growth rates are relative to 2010 enrollment, with the exception of EPFL (2011) and TU Wien (2012). 23
24 .VOLUME OF ACTIVITY — RESEARCH Course Enrollment: Intl. courses (continued) See description on previous page. Growth of AI course enrollment — Non-U.S. (2016—2018) Source: University provided data Univ of Edinburgh USTC (CN) SJTU(CN) PUC (CL) 2.25x 2x Growth in enrollment (relative to 2016) 1.75x 1.5x 1.25x 1x 2016 2017 2018 Academic year Note: This visual shows universities where historical years were limited. All growth rates are relative to 2016 enrollment. 24
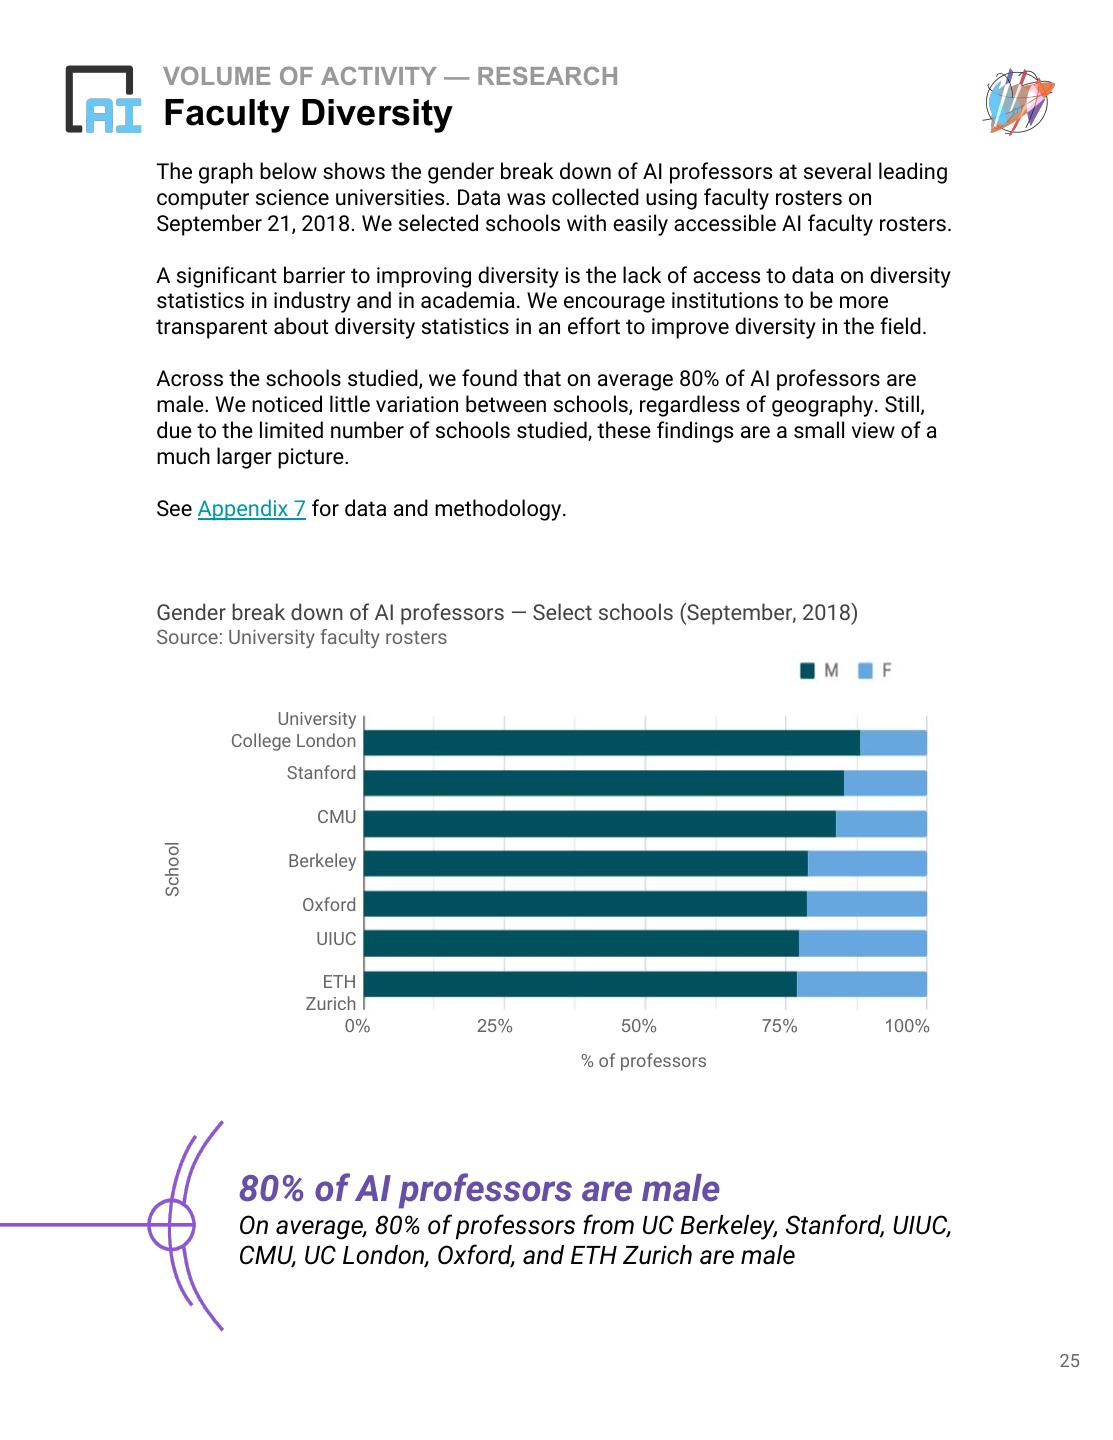
25 .VOLUME OF ACTIVITY — RESEARCH Faculty Diversity The graph below shows the gender break down of AI professors at several leading computer science universities. Data was collected using faculty rosters on September 21, 2018. We selected schools with easily accessible AI faculty rosters. A significant barrier to improving diversity is the lack of access to data on diversity statistics in industry and in academia. We encourage institutions to be more transparent about diversity statistics in an effort to improve diversity in the field. Across the schools studied, we found that on average 80% of AI professors are male. We noticed little variation between schools, regardless of geography. Still, due to the limited number of schools studied, these findings are a small view of a much larger picture. See Appendix 7 for data and methodology. Gender break down of AI professors — Select schools (September, 2018) Source: University faculty rosters M F University College London Stanford CMU School Berkeley Oxford UIUC ETH Zurich 0% 25% 50% 75% 100% % of professors 80% of AI professors are male On average, 80% of professors from UC Berkeley, Stanford, UIUC, CMU, UC London, Oxford, and ETH Zurich are male 25
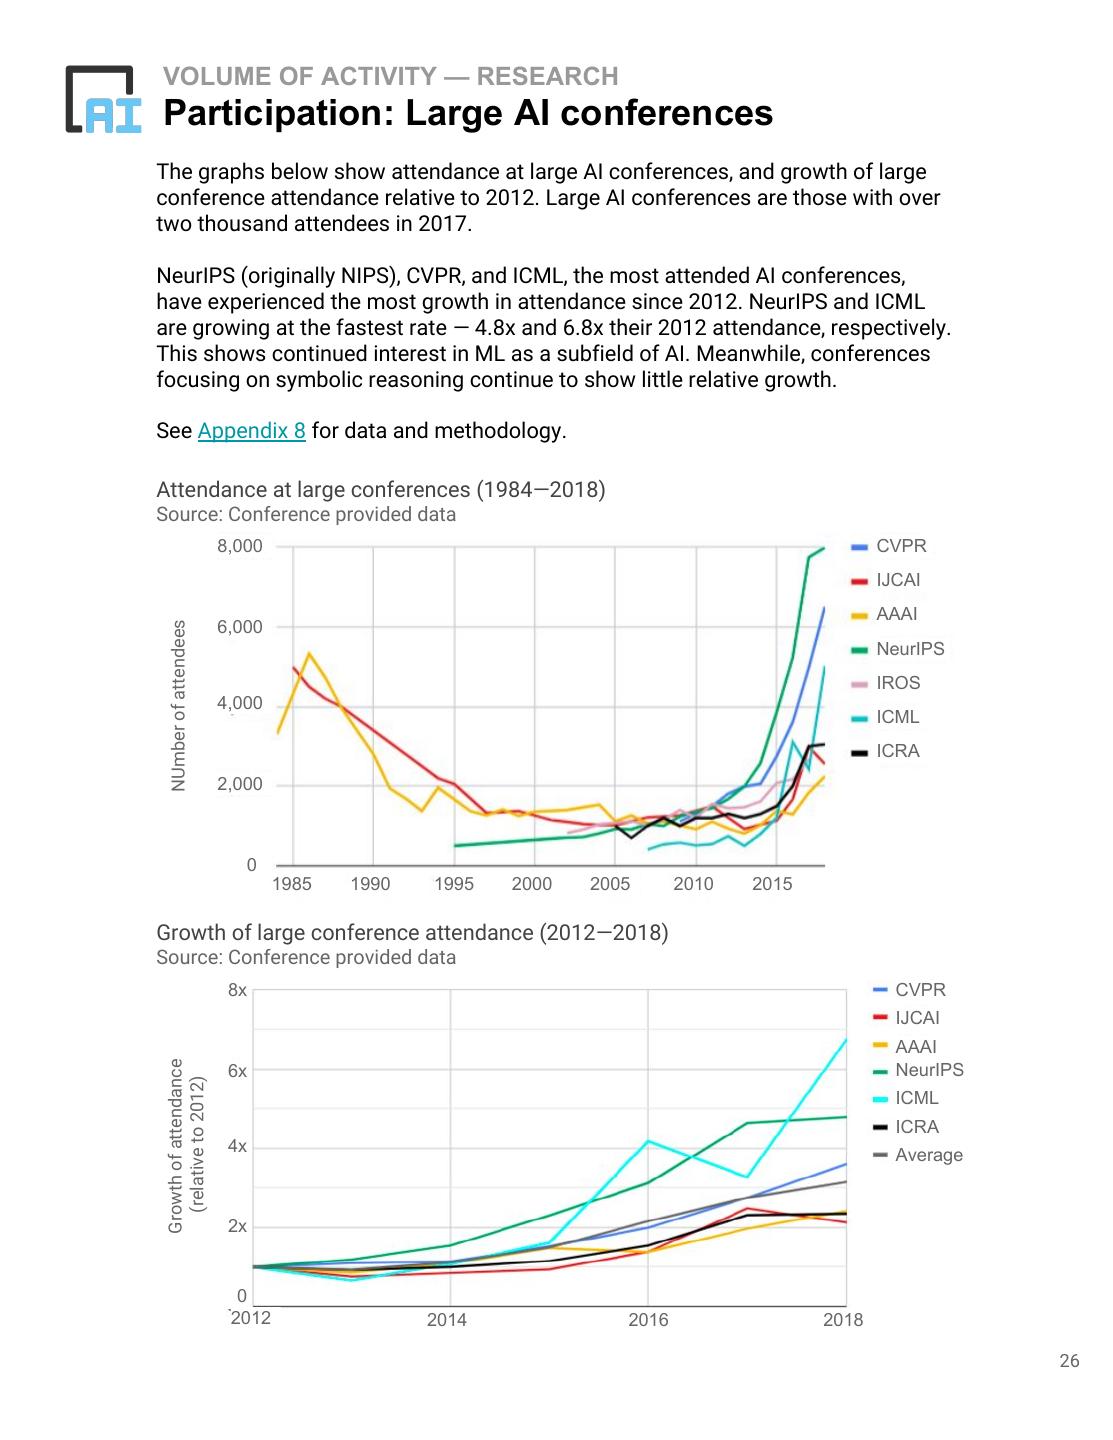
26 .VOLUME OF ACTIVITY — RESEARCH Participation: Large AI conferences The graphs below show attendance at large AI conferences, and growth of large conference attendance relative to 2012. Large AI conferences are those with over two thousand attendees in 2017. NeurIPS (originally NIPS), CVPR, and ICML, the most attended AI conferences, have experienced the most growth in attendance since 2012. NeurIPS and ICML are growing at the fastest rate — 4.8x and 6.8x their 2012 attendance, respectively. This shows continued interest in ML as a subfield of AI. Meanwhile, conferences focusing on symbolic reasoning continue to show little relative growth. See Appendix 8 for data and methodology. Attendance at large conferences (1984—2018) Source: Conference provided data 8,000 CVPR IJCAI AAAI NUmber of attendees 6,000 NeurIPS IROS 4,000 ICML ICRA 2,000 0 1985 1990 1995 2000 2005 2010 2015 Growth of large conference attendance (2012—2018) Source: Conference provided data 8x CVPR IJCAI AAAI Growth of attendance 6x NeurIPS (relative to 2012) ICML ICRA 4x Average 2x 0 2012 2014 2016 2018 26
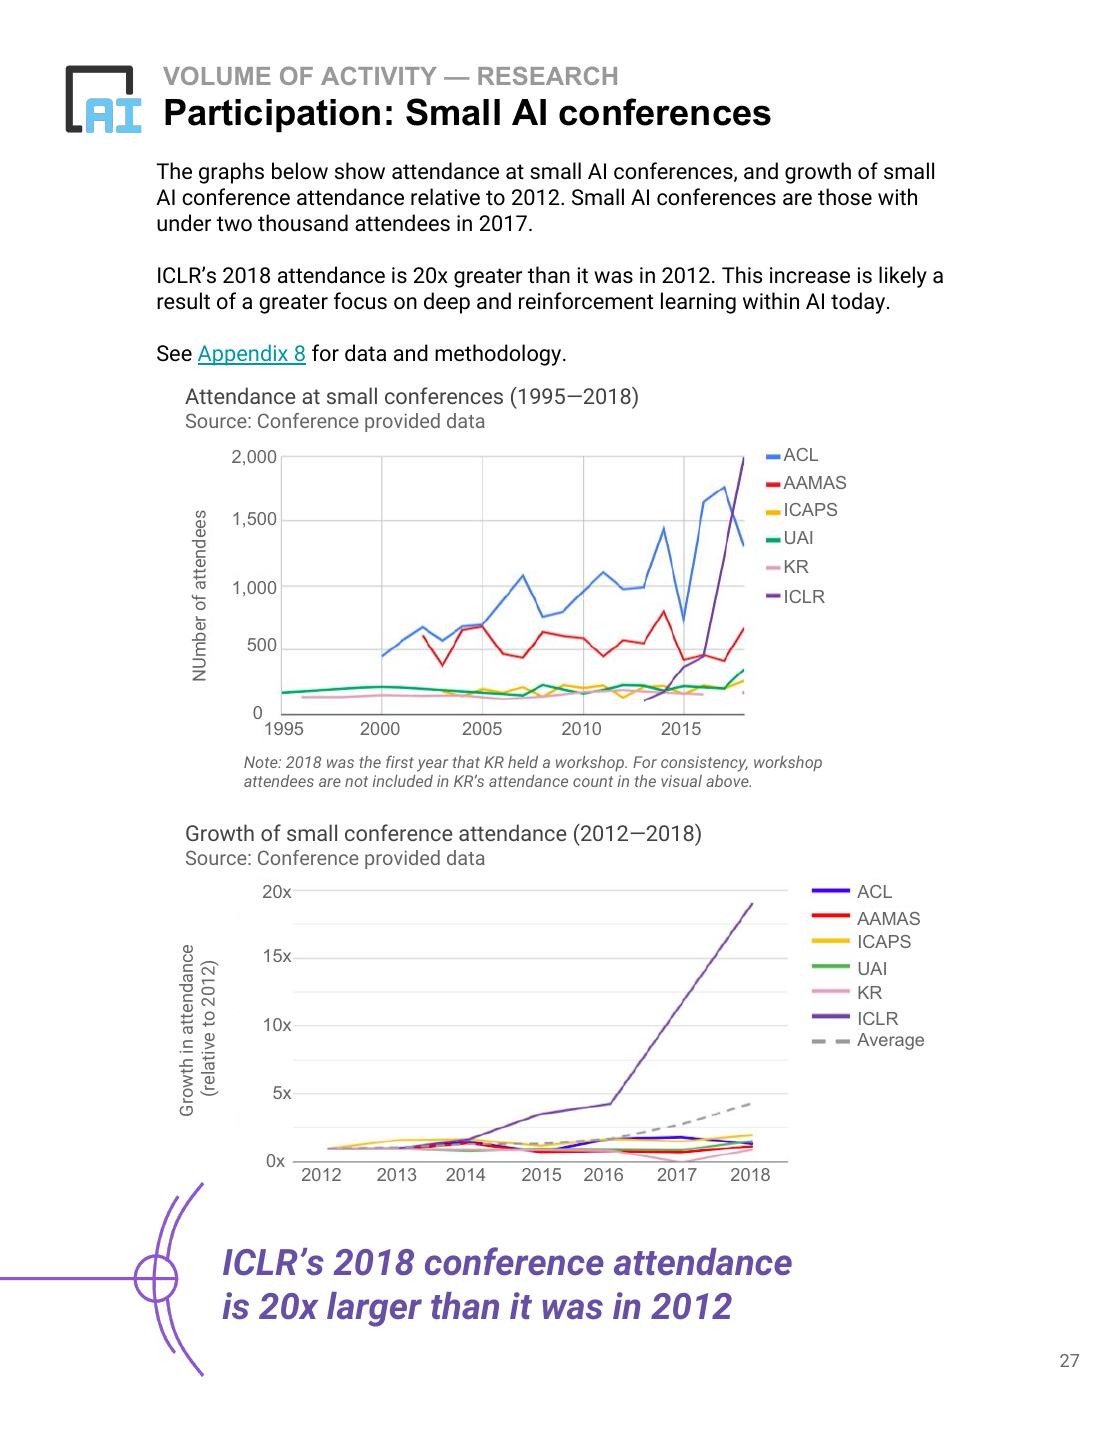
27 .VOLUME OF ACTIVITY — RESEARCH Participation: Small AI conferences The graphs below show attendance at small AI conferences, and growth of small AI conference attendance relative to 2012. Small AI conferences are those with under two thousand attendees in 2017. ICLR’s 2018 attendance is 20x greater than it was in 2012. This increase is likely a result of a greater focus on deep and reinforcement learning within AI today. See Appendix 8 for data and methodology. Attendance at small conferences (1995—2018) Source: Conference provided data 2,000 ACL AAMAS ICAPS NUmber of attendees 1,500 UAI KR 1,000 ICLR 500 0 1995 2000 2005 2010 2015 Note: 2018 was the first year that KR held a workshop. For consistency, workshop attendees are not included in KR’s attendance count in the visual above. Growth of small conference attendance (2012—2018) Source: Conference provided data 20x ACL AAMAS ICAPS Growth in attendance 15x (relative to 2012) UAI KR 10x ICLR Average 5x 0x 2012 2013 2014 2015 2016 2017 2018 ICLR’s 2018 conference attendance is 20x larger than it was in 2012 27
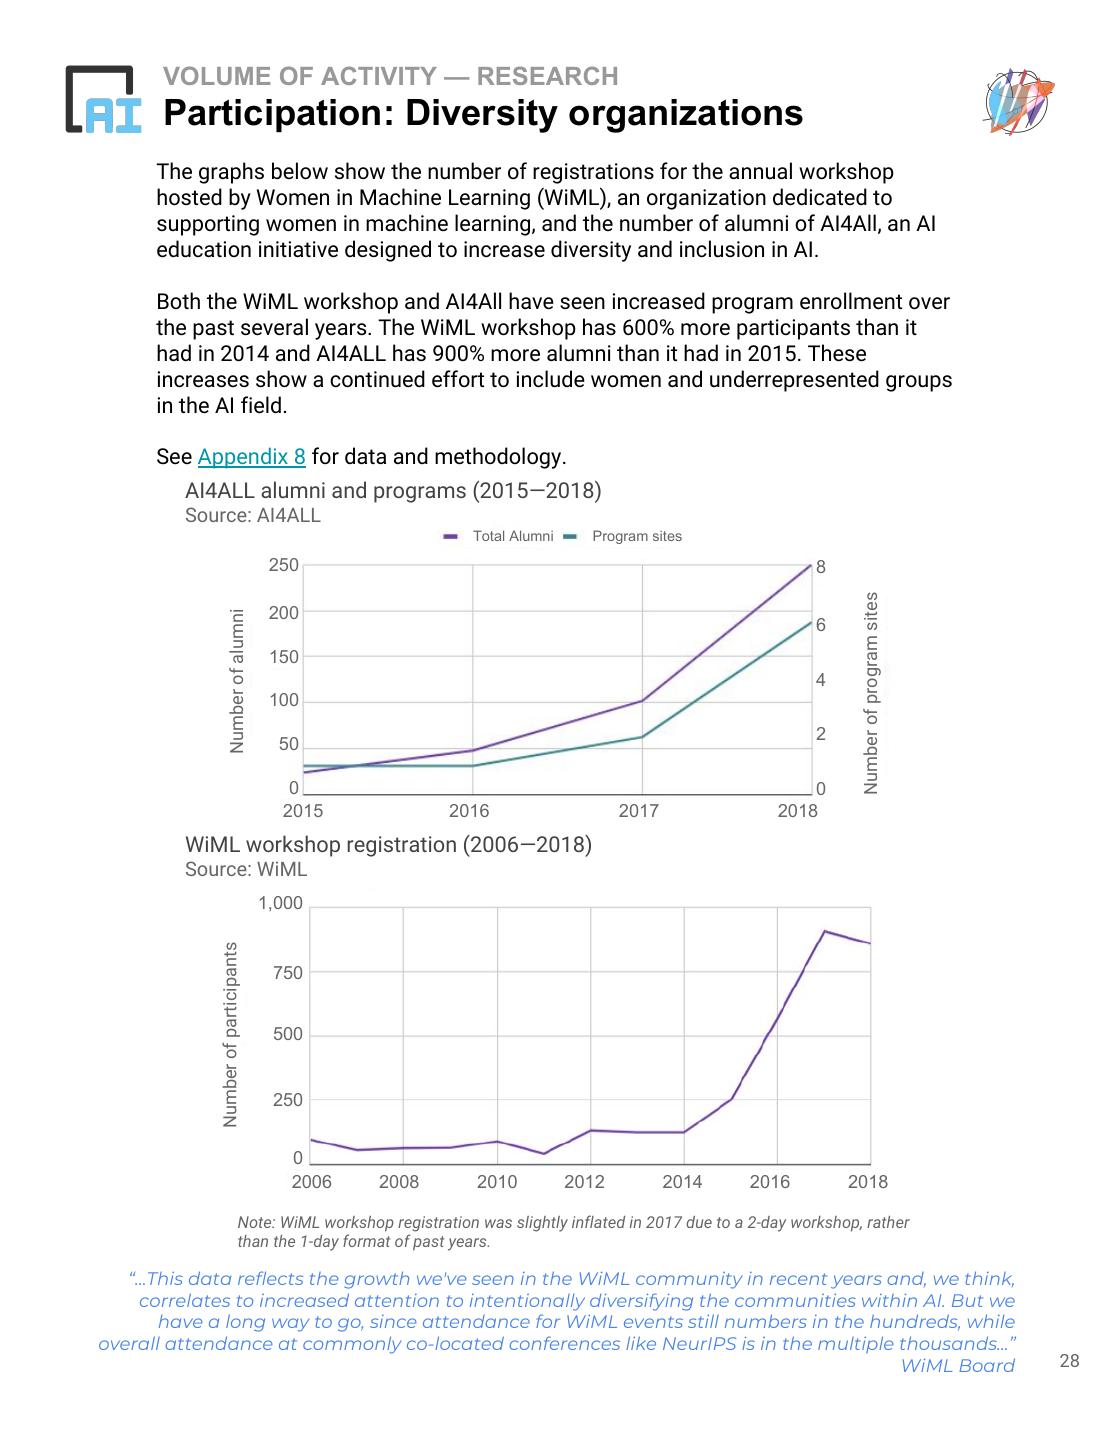
28 . VOLUME OF ACTIVITY — RESEARCH Participation: Diversity organizations The graphs below show the number of registrations for the annual workshop hosted by Women in Machine Learning (WiML), an organization dedicated to supporting women in machine learning, and the number of alumni of AI4All, an AI education initiative designed to increase diversity and inclusion in AI. Both the WiML workshop and AI4All have seen increased program enrollment over the past several years. The WiML workshop has 600% more participants than it had in 2014 and AI4ALL has 900% more alumni than it had in 2015. These increases show a continued effort to include women and underrepresented groups in the AI field. See Appendix 8 for data and methodology. AI4ALL alumni and programs (2015—2018) Source: AI4ALL Total Alumni Program sites 250 8 Number of program sites 200 Number of alumni 6 150 4 100 2 50 0 0 2015 2016 2017 2018 WiML workshop registration (2006—2018) Source: WiML 1,000 Number of participants 750 500 250 0 2006 2008 2010 2012 2014 2016 2018 Note: WiML workshop registration was slightly inflated in 2017 due to a 2-day workshop, rather than the 1-day format of past years. “...This data reflects the growth we've seen in the WiML community in recent years and, we think, correlates to increased attention to intentionally diversifying the communities within AI. But we have a long way to go, since attendance for WiML events still numbers in the hundreds, while overall attendance at commonly co-located conferences like NeurIPS is in the multiple thousands...” WiML Board 28
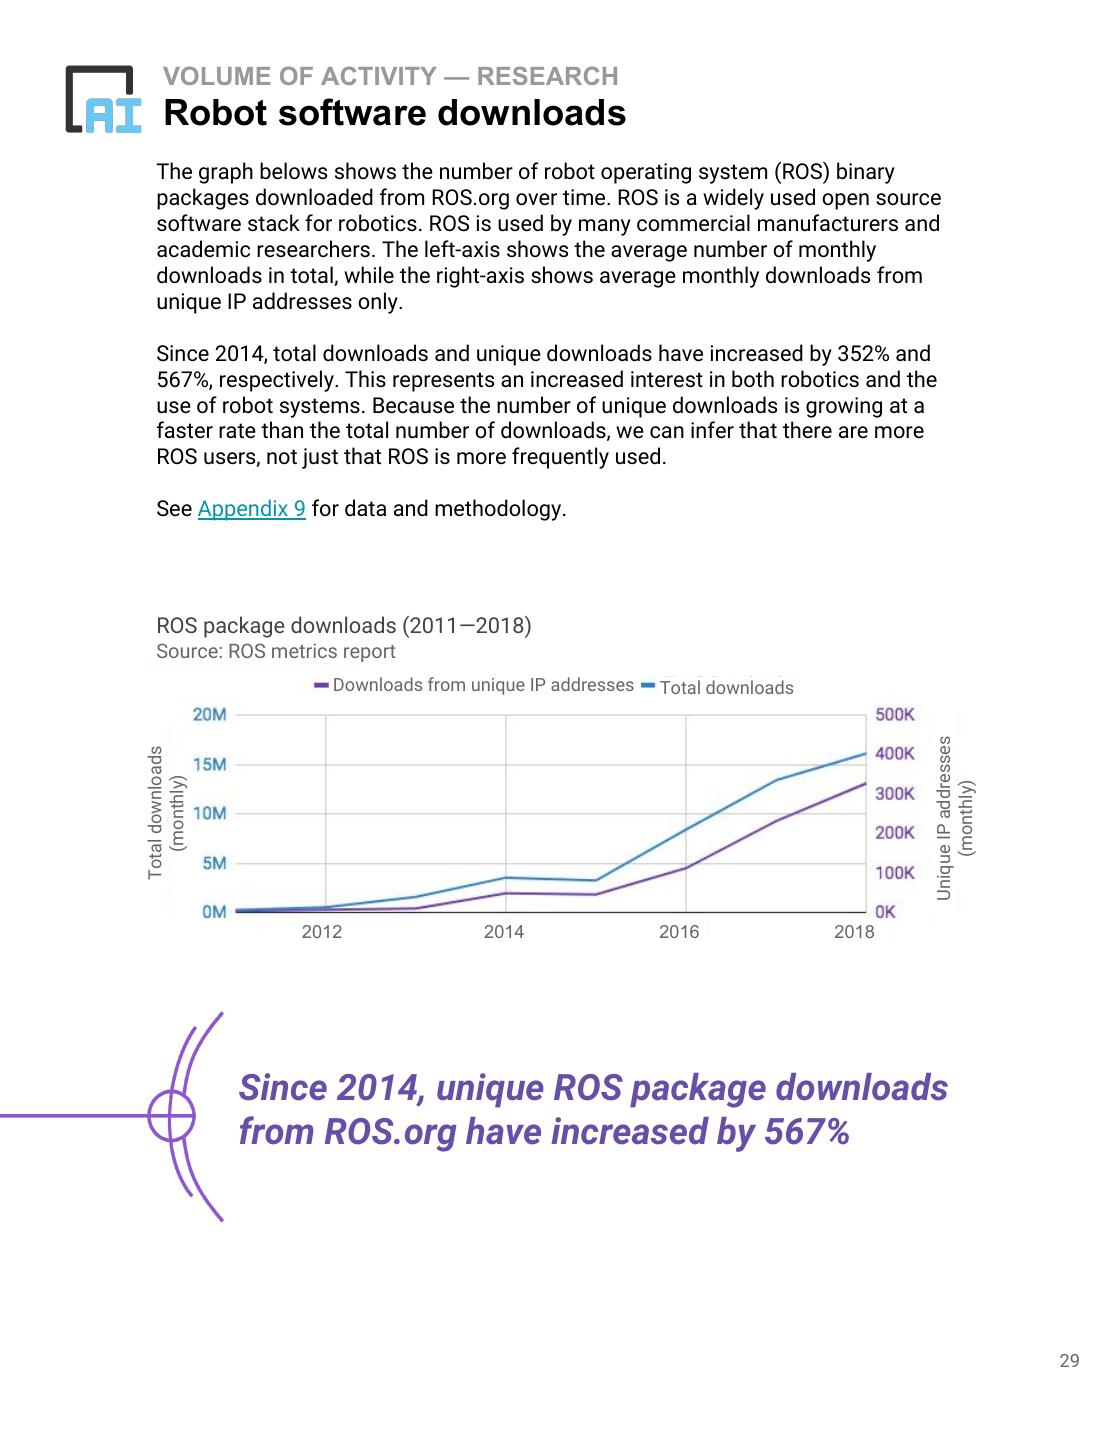
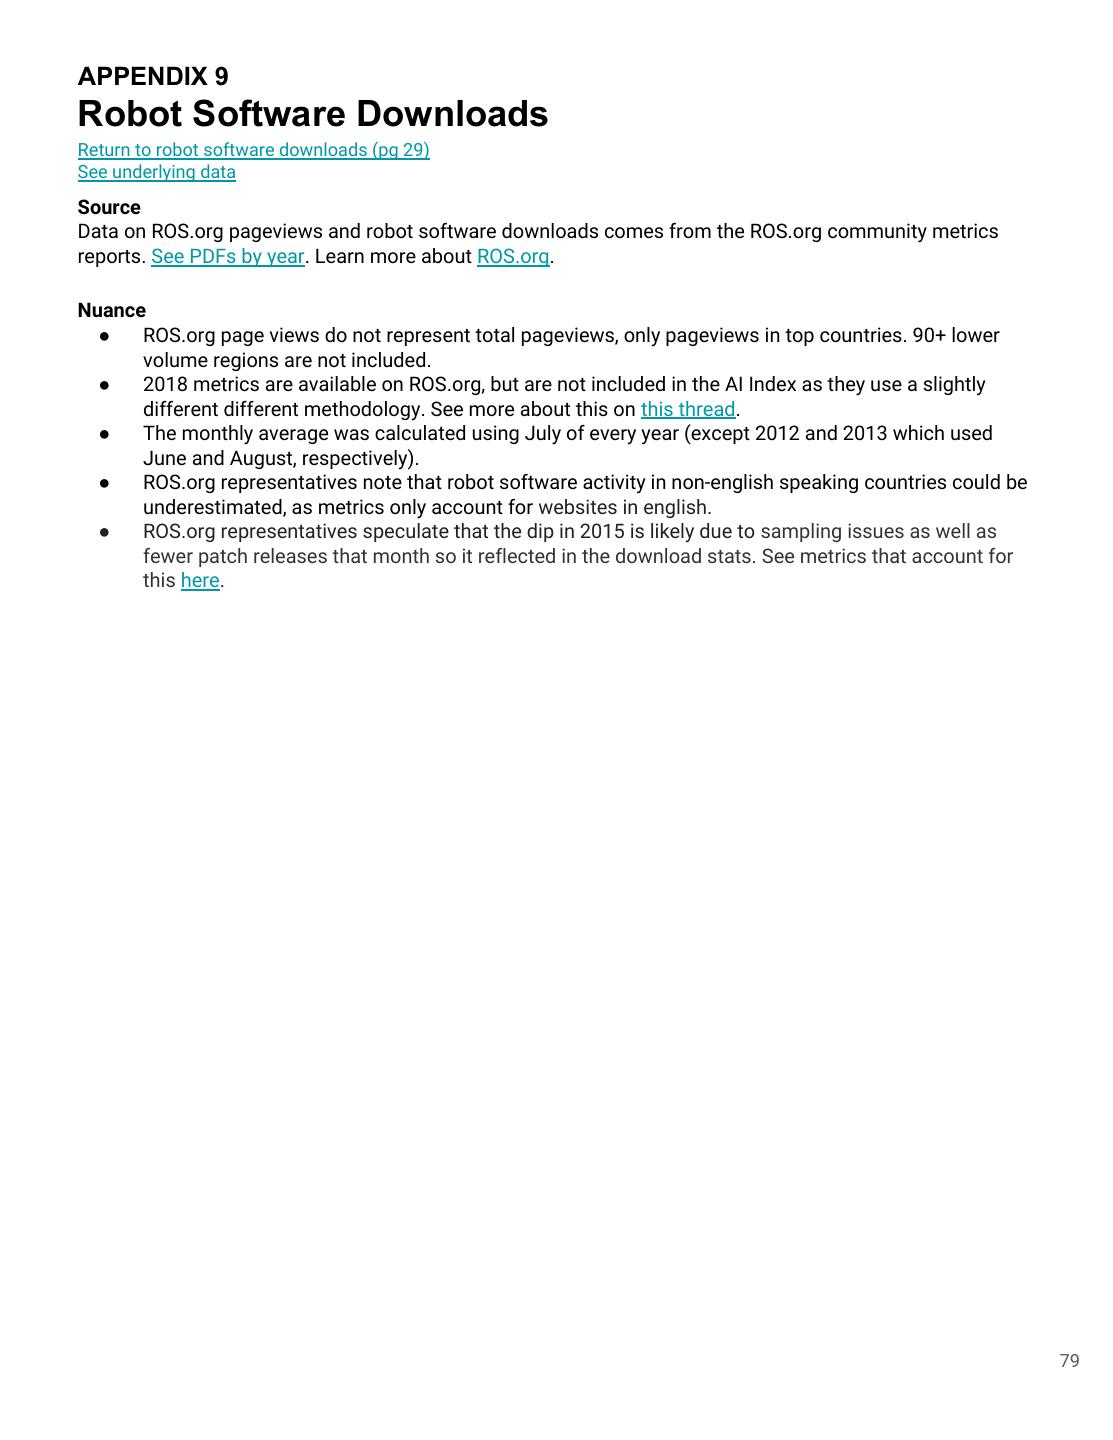
29 . VOLUME OF ACTIVITY — RESEARCH Robot software downloads The graph belows shows the number of robot operating system (ROS) binary packages downloaded from ROS.org over time. ROS is a widely used open source software stack for robotics. ROS is used by many commercial manufacturers and academic researchers. The left-axis shows the average number of monthly downloads in total, while the right-axis shows average monthly downloads from unique IP addresses only. Since 2014, total downloads and unique downloads have increased by 352% and 567%, respectively. This represents an increased interest in both robotics and the use of robot systems. Because the number of unique downloads is growing at a faster rate than the total number of downloads, we can infer that there are more ROS users, not just that ROS is more frequently used. See Appendix 9 for data and methodology. ROS package downloads (2011—2018) Source: ROS metrics report Downloads from unique IP addresses Total downloads Unique IP addresses Total downloads (monthly) (monthly) 2012 2014 2016 2018 Since 2014, unique ROS package downloads from ROS.org have increased by 567% 29


