- 快召唤伙伴们来围观吧
- 微博 QQ QQ空间 贴吧
- 视频嵌入链接 文档嵌入链接
- 复制
- 微信扫一扫分享
- 已成功复制到剪贴板
Apache Spark 3.0对Prometheus的原生支持
整场直播间链接 https://developer.aliyun.com/live/43188
Apache Spark 3.0对Prometheus监控的原生支持
周康
花名榆舟,阿里云EMR技术专家。开源爱好者,是 Apache Spark/Hadoop/Parquet 等项目的贡献者。关注大规模分布式计算、调度、存储等系统,先后从事过 Spark、OLAP、Hadoop Yarn 等相关工作的落地。目前主要专注在 EMR 大数据上云的相关工作。
Apache Spark实现了一个支持可配置的metrics system,用户在生产环境中可以将Spark提供的metrics数据(包括driver、executor等)推送到多种Sink。Prometheus是一个开源的分布式监控系统,尤其在云原生时代被广泛使用。
Apache Spark也支持以Prometheus作为Sink,将metrics数据推送到Prometheus中来进行监控和报警。目前常见的实现方式有下面几种:
1.使用jmx exporter和Spark的JMXSink结合的方式;
2.使用第三方库;
3.实现Sink插件来支持更复杂的metrics;
本次分享会为大家介绍在Apache Spark 3.0中对Prometheus监控的原生支持,包括如何使用Prometheus特性、目前已经实现的metrics、以及如何对structured streaming 作业进行监控等。
展开查看详情
1 .
2 .Apache Spark 3.0对Prometheus的 原生支持 周康 阿里云EMR技术专家
3 .Monitoring Apache Spark with Prometheus
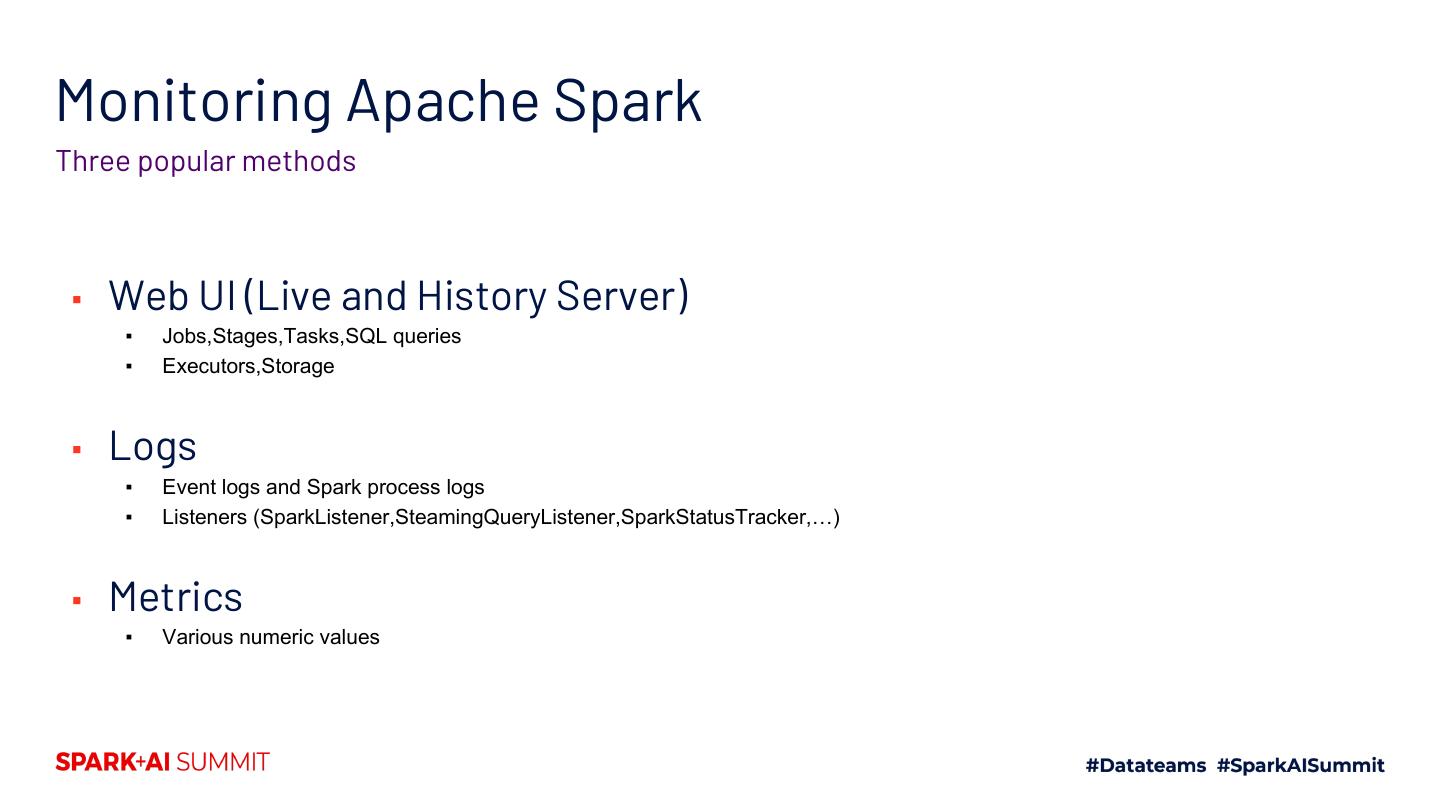
4 .Monitoring Apache Spark Three popular methods ▪ Web UI (Live and History Server) ▪ Jobs,Stages,Tasks,SQL queries ▪ Executors,Storage ▪ Logs ▪ Event logs and Spark process logs ▪ Listeners (SparkListener,SteamingQueryListener,SparkStatusTracker,…) ▪ Metrics ▪ Various numeric values
5 .Metrics are useful to handle gray failures Early warning instead of post-mortem process ▪ Monitoring and alerting Spark jobs’ gray failures ▪ Memory Leak or misconfiguration ▪ Performance degradation ▪ Growing streaming job’s inter-states
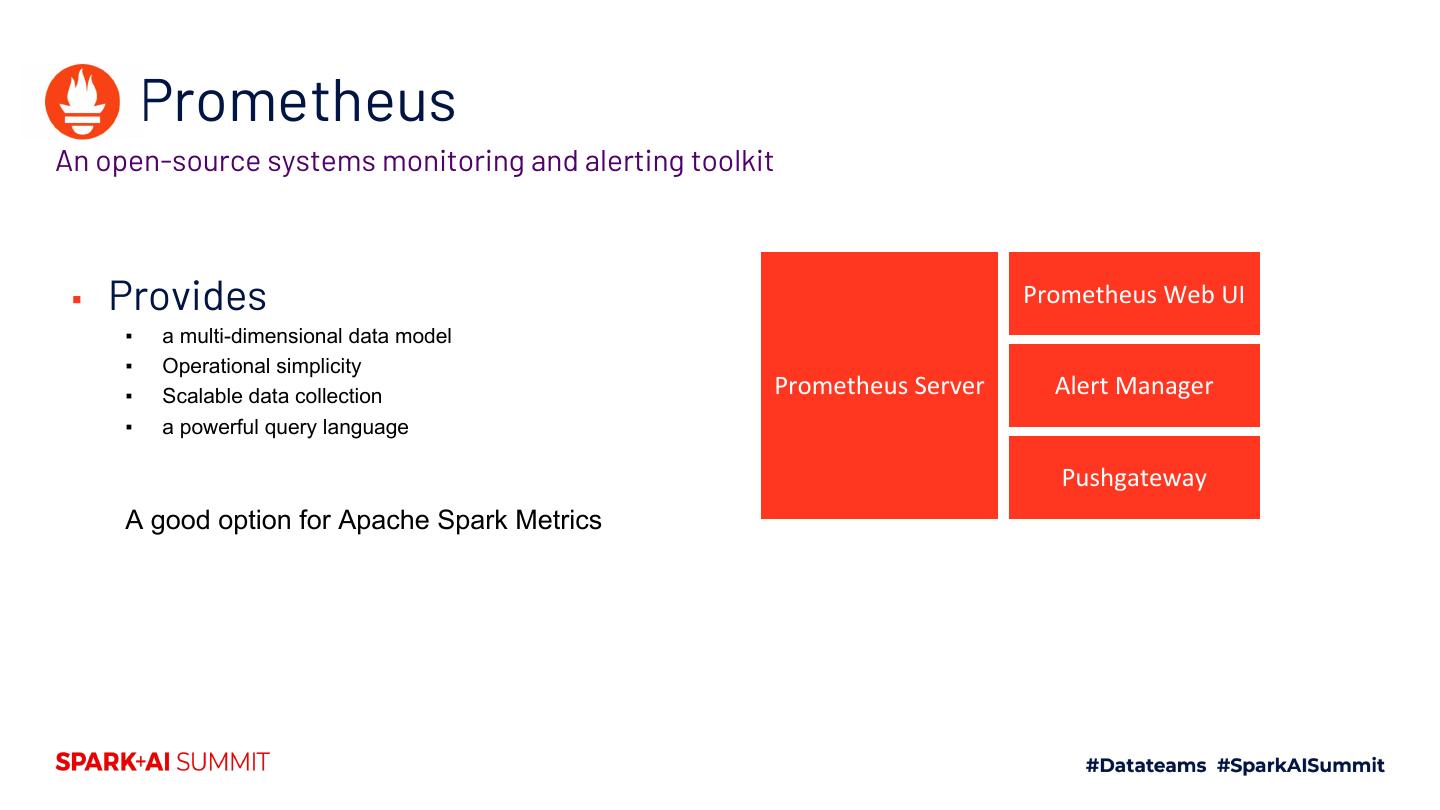
6 . Prometheus An open-source systems monitoring and alerting toolkit ▪ Provides Prometheus Web UI ▪ a multi-dimensional data model ▪ Operational simplicity ▪ Scalable data collection Prometheus Server Alert Manager ▪ a powerful query language Pushgateway A good option for Apache Spark Metrics
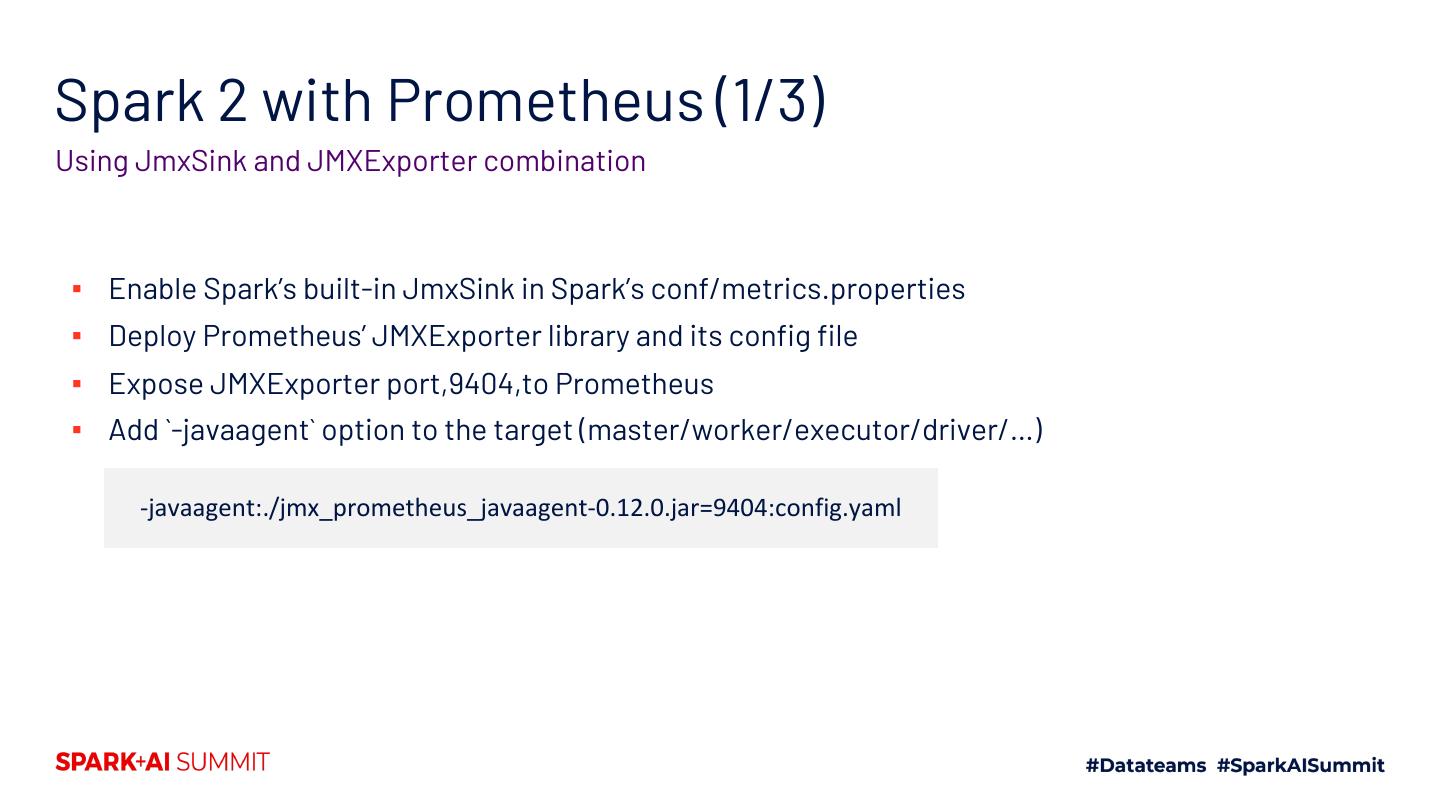
7 .Spark 2 with Prometheus (1/3) Using JmxSink and JMXExporter combination ▪ Enable Spark’s built-in JmxSink in Spark’s conf/metrics.properties ▪ Deploy Prometheus’ JMXExporter library and its config file ▪ Expose JMXExporter port,9404,to Prometheus ▪ Add `-javaagent` option to the target (master/worker/executor/driver/…) -javaagent:./jmx_prometheus_javaagent-0.12.0.jar=9404:config.yaml
8 .Spark 2 with Prometheus (2/3) Using GraphiteSink and GraphiteExporter combination ▪ Set up Graphite server ▪ Enable Spark’s built-in Graphite Sink with several configurations ▪ Enable Prometheus’s GraphiteExporter at Graphite
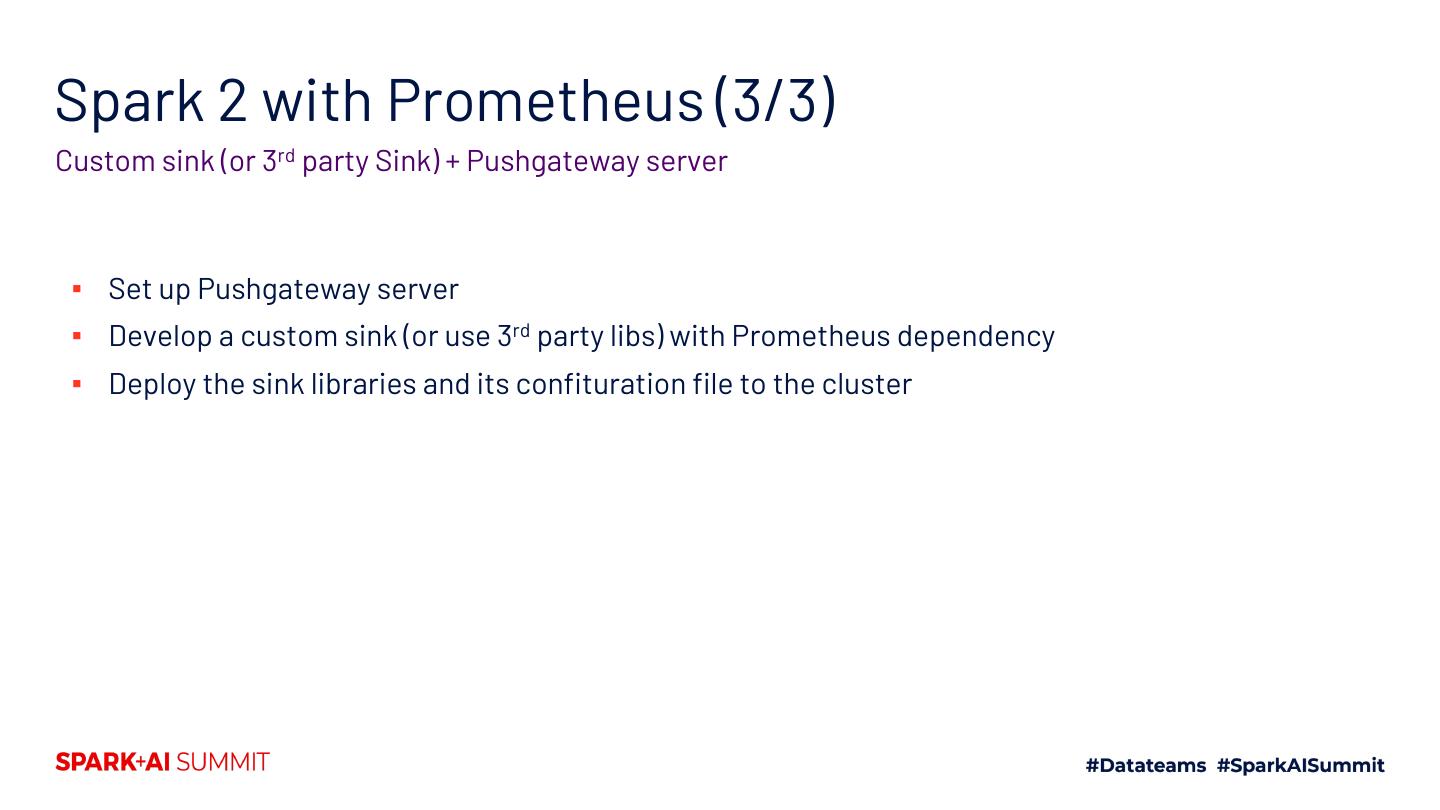
9 .Spark 2 with Prometheus (3/3) Custom sink (or 3rd party Sink) + Pushgateway server ▪ Set up Pushgateway server ▪ Develop a custom sink (or use 3rd party libs) with Prometheus dependency ▪ Deploy the sink libraries and its confituration file to the cluster
10 .Pros and Cons ▪ Pros ▪ Used already in production ▪ A general approach ▪ Cons ▪ Difficult to setup at new environments ▪ Some custom libraries may have a dependency on Spark versions
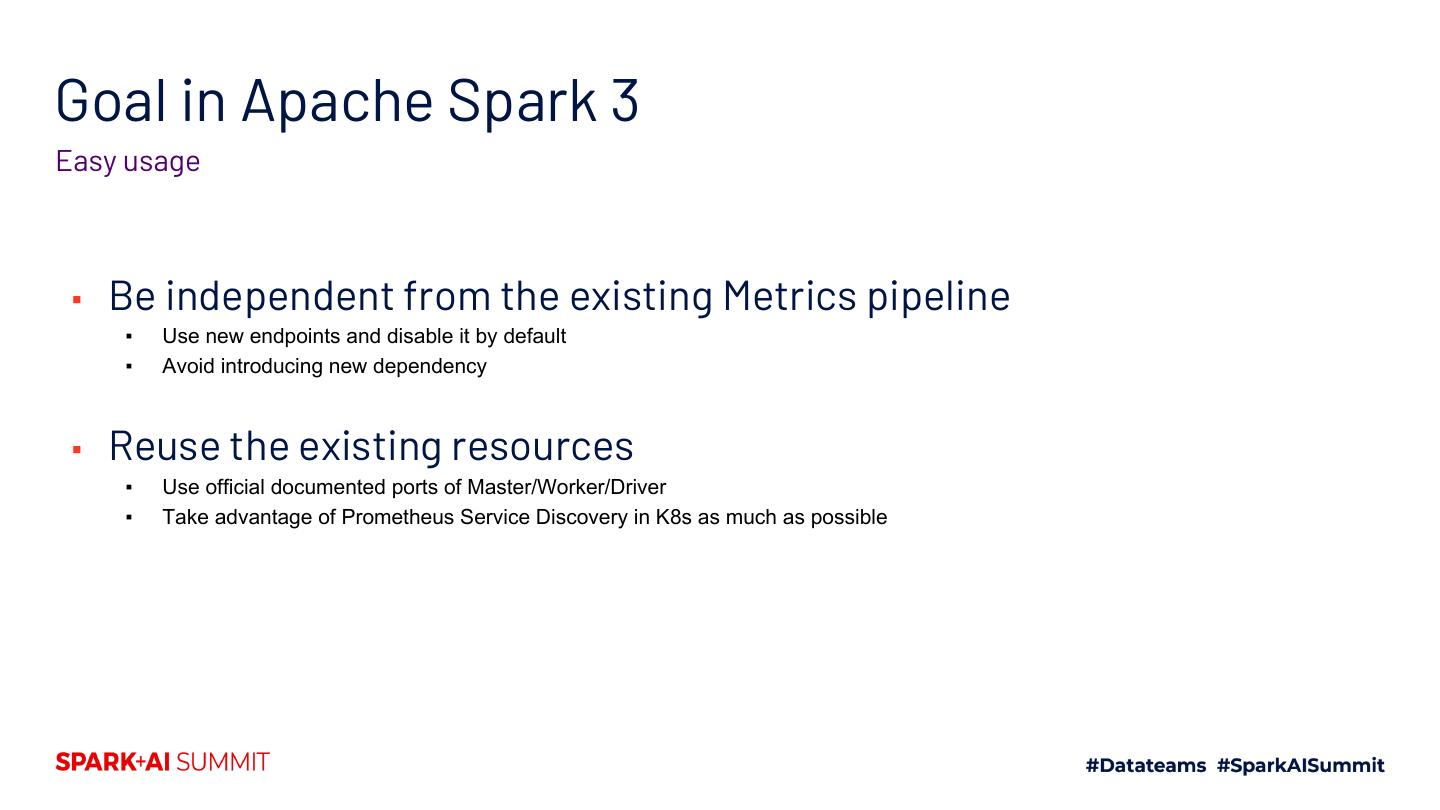
11 .Goal in Apache Spark 3 Easy usage ▪ Be independent from the existing Metrics pipeline ▪ Use new endpoints and disable it by default ▪ Avoid introducing new dependency ▪ Reuse the existing resources ▪ Use official documented ports of Master/Worker/Driver ▪ Take advantage of Prometheus Service Discovery in K8s as much as possible
12 .Apache Spark 3.0: Support Prometheus monitoring natively
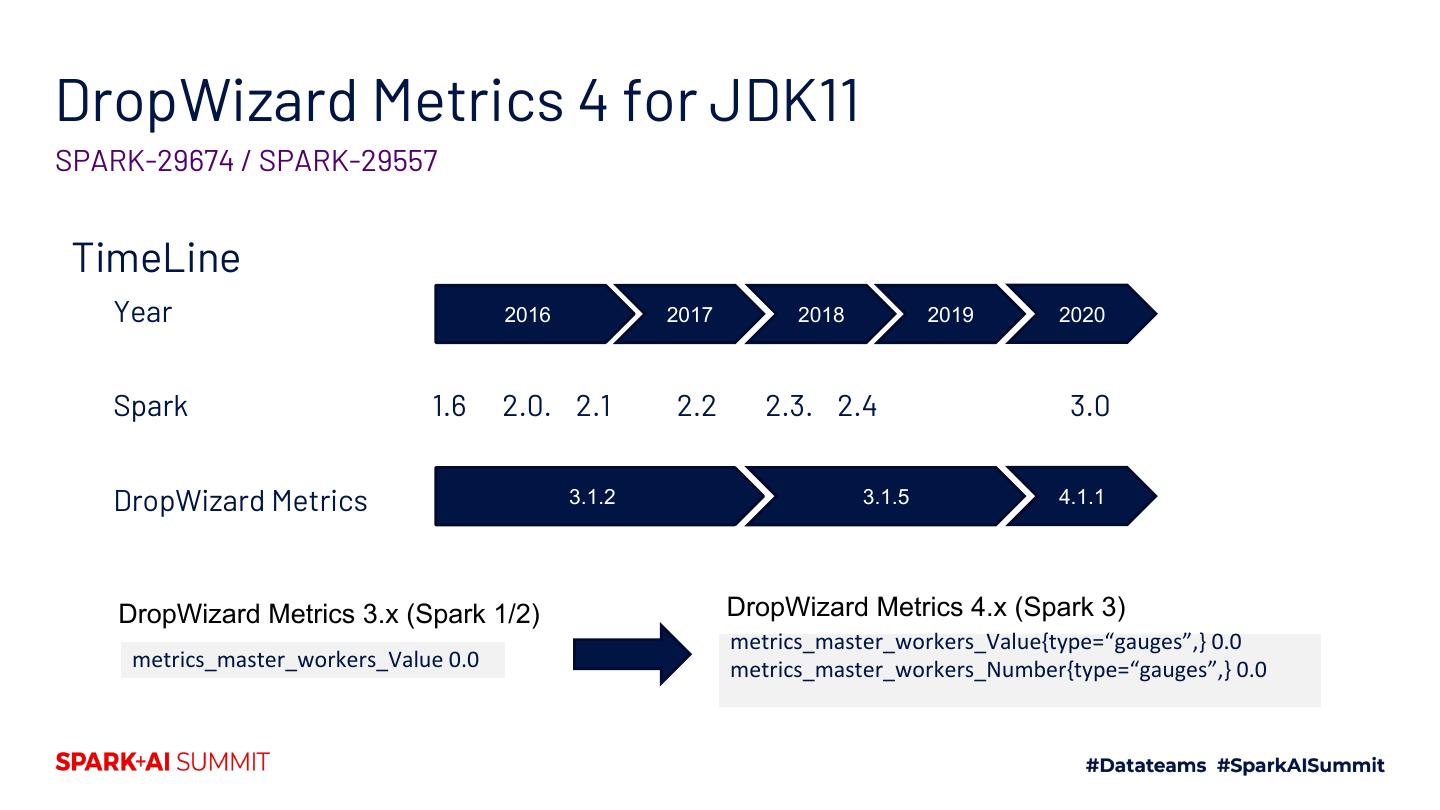
13 .DropWizard Metrics 4 for JDK11 SPARK-29674 / SPARK-29557 TimeLine Year 2016 2017 2018 2019 2020 Spark 1.6 2.0. 2.1 2.2 2.3. 2.4 3.0 DropWizard Metrics 3.1.2 3.1.5 4.1.1 DropWizard Metrics 3.x (Spark 1/2) DropWizard Metrics 4.x (Spark 3) metrics_master_workers_Value{type=“gauges”,} 0.0 metrics_master_workers_Value 0.0 metrics_master_workers_Number{type=“gauges”,} 0.0
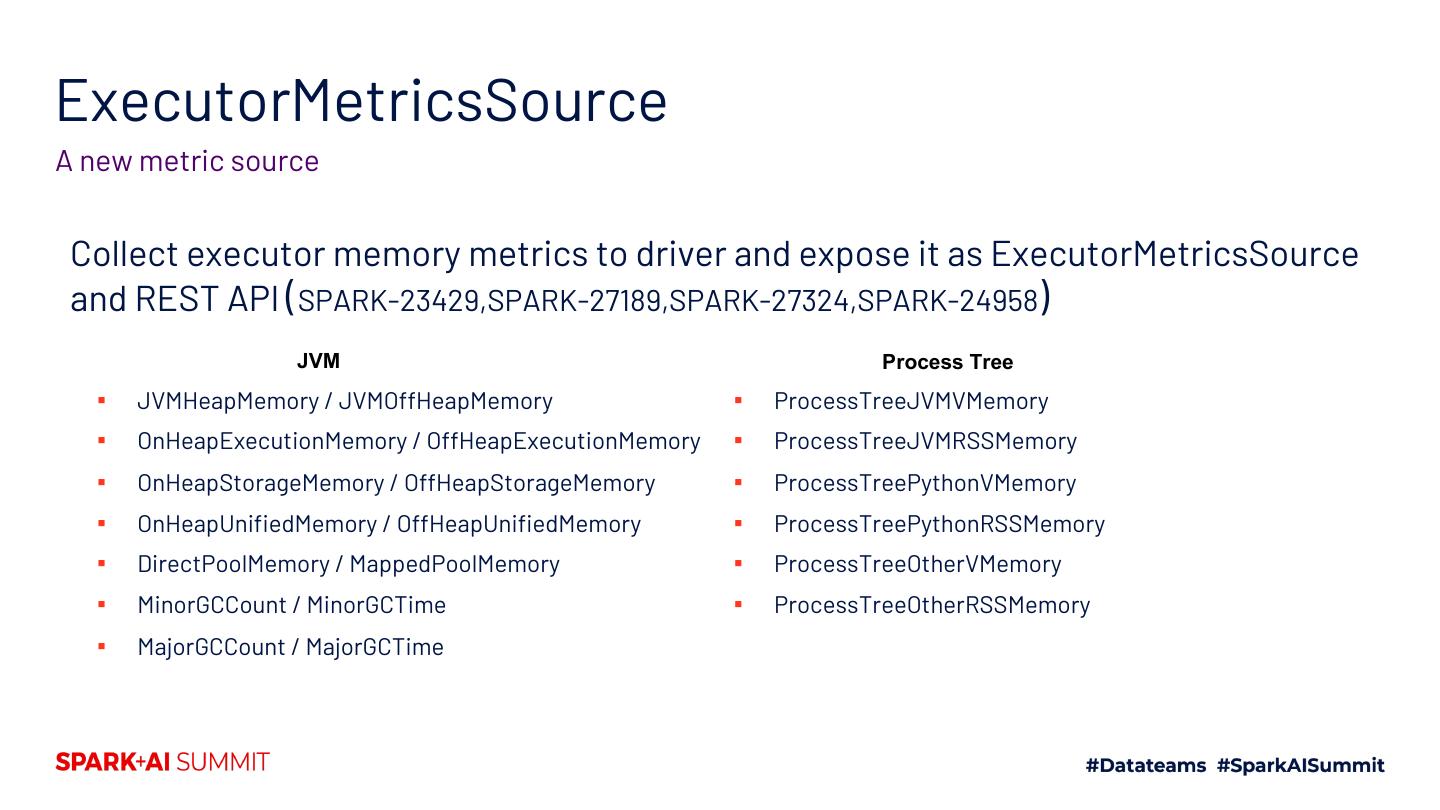
14 .ExecutorMetricsSource A new metric source Collect executor memory metrics to driver and expose it as ExecutorMetricsSource and REST API (SPARK-23429,SPARK-27189,SPARK-27324,SPARK-24958) JVM Process Tree ▪ JVMHeapMemory / JVMOffHeapMemory ▪ ProcessTreeJVMVMemory ▪ OnHeapExecutionMemory / OffHeapExecutionMemory ▪ ProcessTreeJVMRSSMemory ▪ OnHeapStorageMemory / OffHeapStorageMemory ▪ ProcessTreePythonVMemory ▪ OnHeapUnifiedMemory / OffHeapUnifiedMemory ▪ ProcessTreePythonRSSMemory ▪ DirectPoolMemory / MappedPoolMemory ▪ ProcessTreeOtherVMemory ▪ MinorGCCount / MinorGCTime ▪ ProcessTreeOtherRSSMemory ▪ MajorGCCount / MajorGCTime
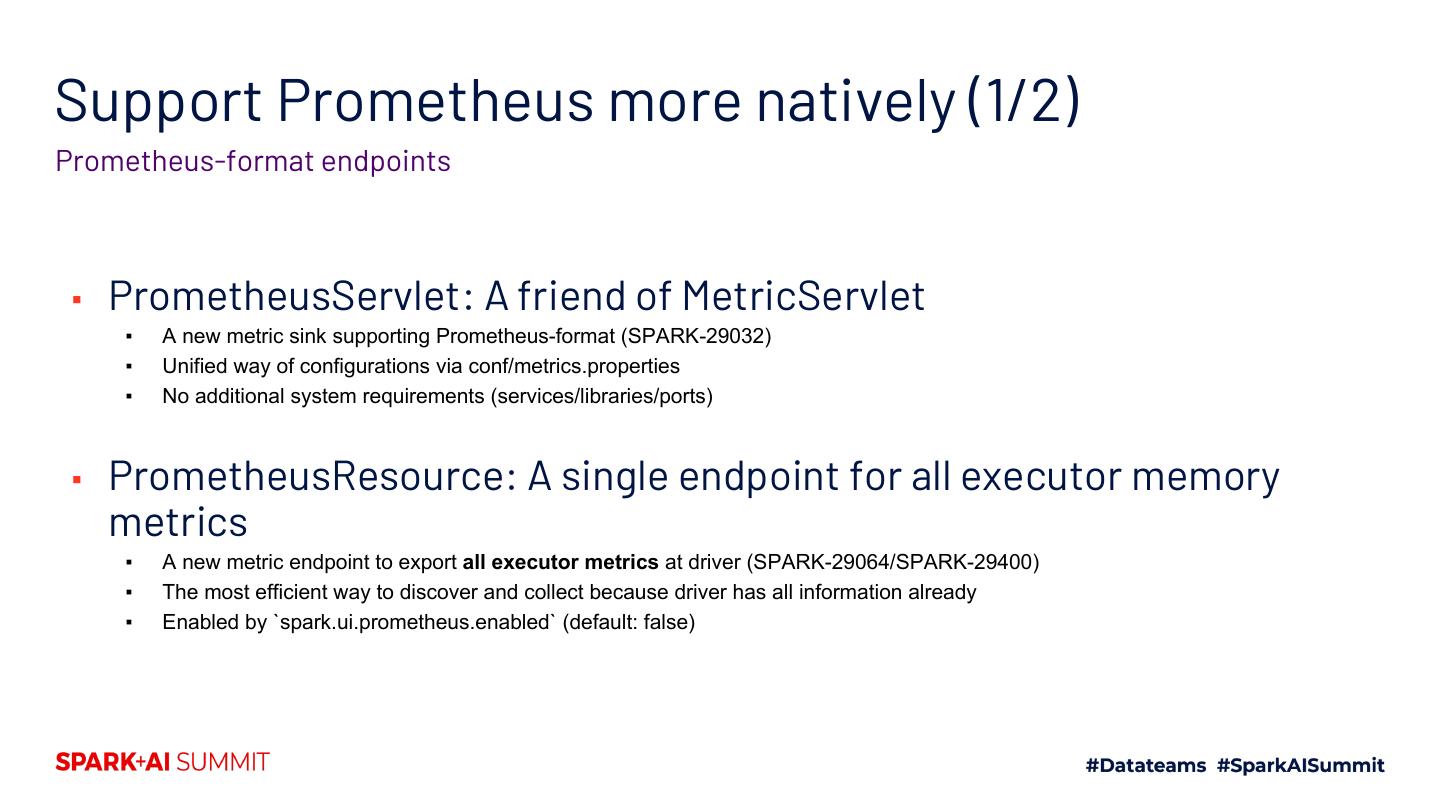
15 .Support Prometheus more natively (1/2) Prometheus-format endpoints ▪ PrometheusServlet: A friend of MetricServlet ▪ A new metric sink supporting Prometheus-format (SPARK-29032) ▪ Unified way of configurations via conf/metrics.properties ▪ No additional system requirements (services/libraries/ports) ▪ PrometheusResource: A single endpoint for all executor memory metrics ▪ A new metric endpoint to export all executor metrics at driver (SPARK-29064/SPARK-29400) ▪ The most efficient way to discover and collect because driver has all information already ▪ Enabled by `spark.ui.prometheus.enabled` (default: false)
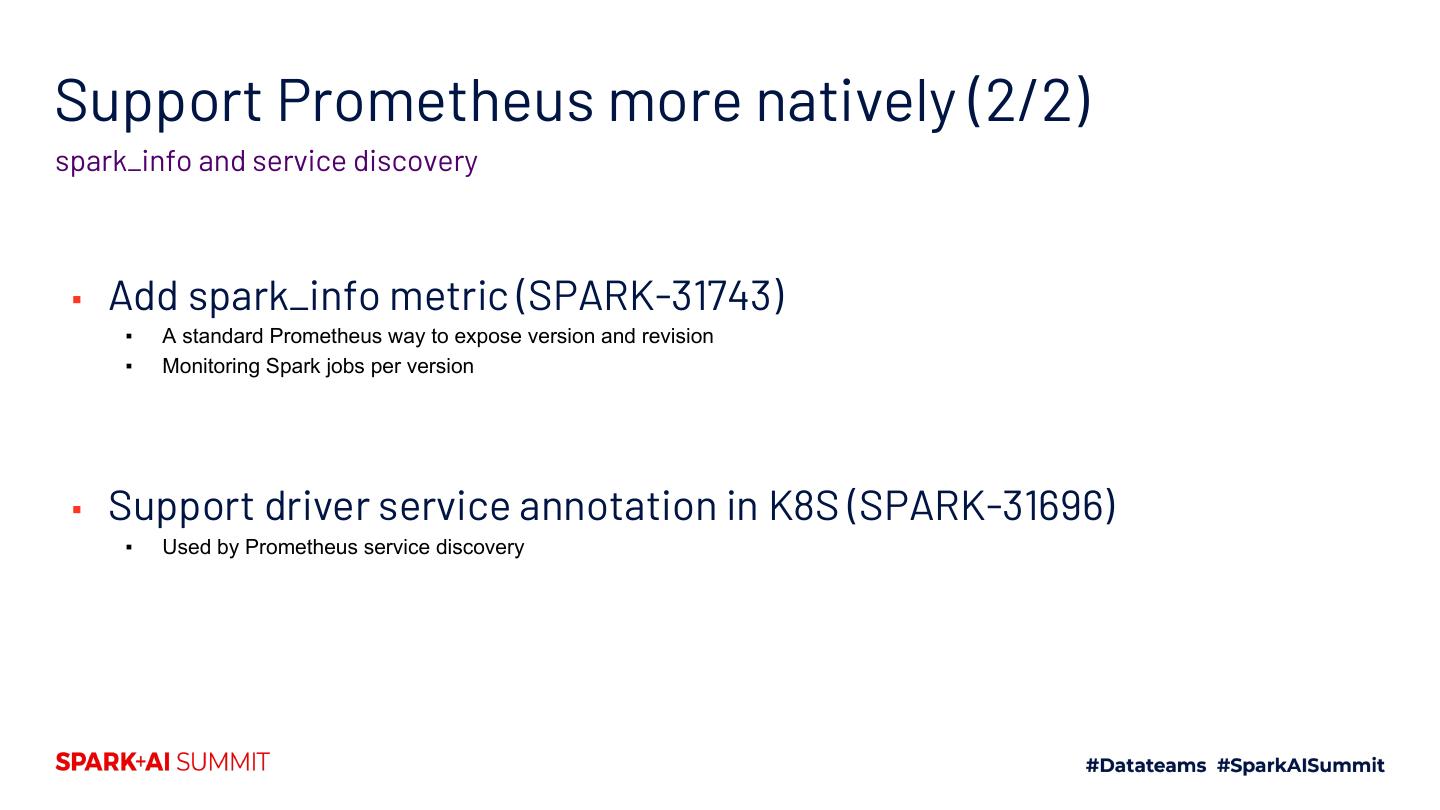
16 .Support Prometheus more natively (2/2) spark_info and service discovery ▪ Add spark_info metric (SPARK-31743) ▪ A standard Prometheus way to expose version and revision ▪ Monitoring Spark jobs per version ▪ Support driver service annotation in K8S (SPARK-31696) ▪ Used by Prometheus service discovery
17 .Under the hood
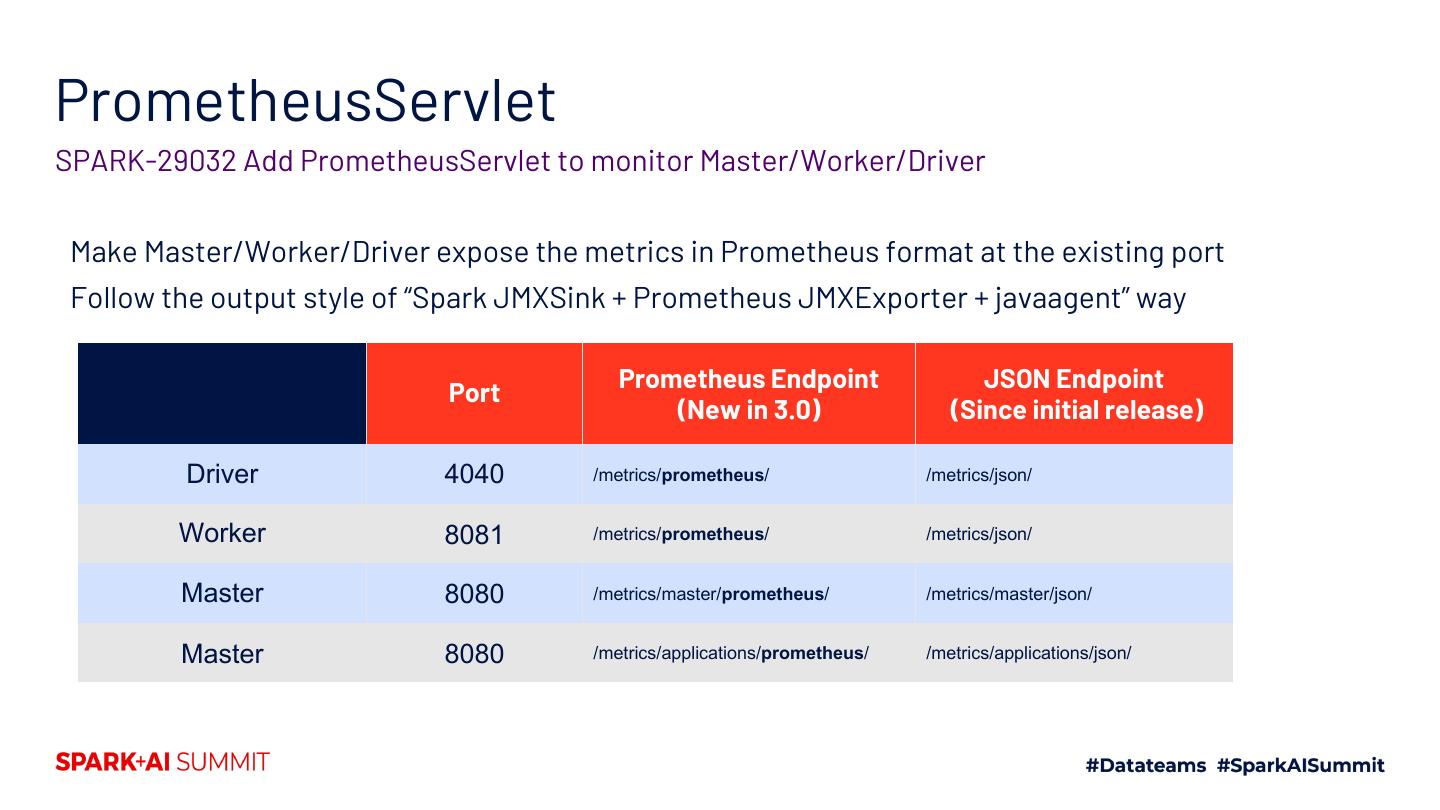
18 .PrometheusServlet SPARK-29032 Add PrometheusServlet to monitor Master/Worker/Driver Make Master/Worker/Driver expose the metrics in Prometheus format at the existing port Follow the output style of “Spark JMXSink + Prometheus JMXExporter + javaagent” way Prometheus Endpoint JSON Endpoint Port (New in 3.0) (Since initial release) Driver 4040 /metrics/prometheus/ /metrics/json/ Worker 8081 /metrics/prometheus/ /metrics/json/ Master 8080 /metrics/master/prometheus/ /metrics/master/json/ Master 8080 /metrics/applications/prometheus/ /metrics/applications/json/
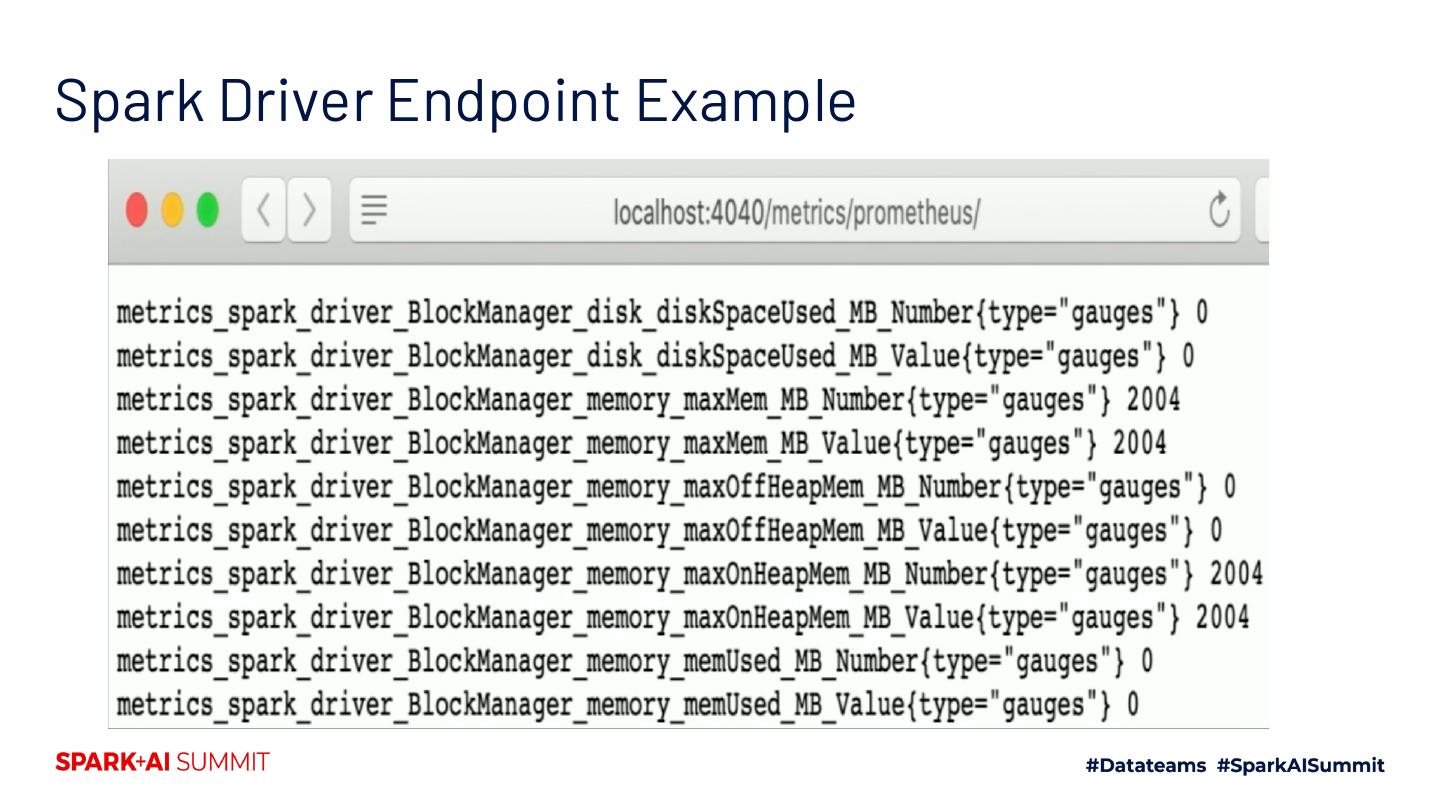
19 .Spark Driver Endpoint Example
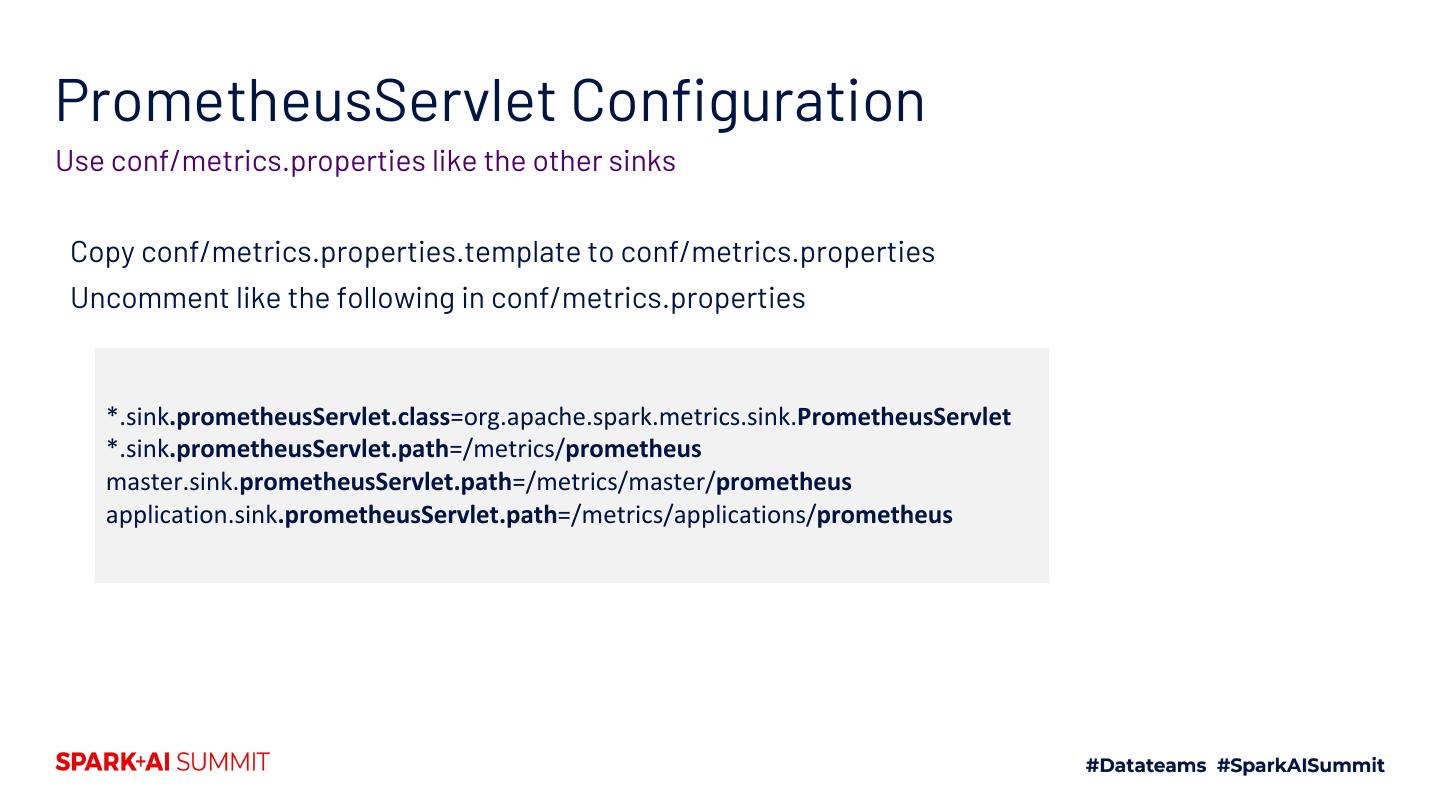
20 .PrometheusServlet Configuration Use conf/metrics.properties like the other sinks Copy conf/metrics.properties.template to conf/metrics.properties Uncomment like the following in conf/metrics.properties *.sink.prometheusServlet.class=org.apache.spark.metrics.sink.PrometheusServlet *.sink.prometheusServlet.path=/metrics/prometheus master.sink.prometheusServlet.path=/metrics/master/prometheus application.sink.prometheusServlet.path=/metrics/applications/prometheus
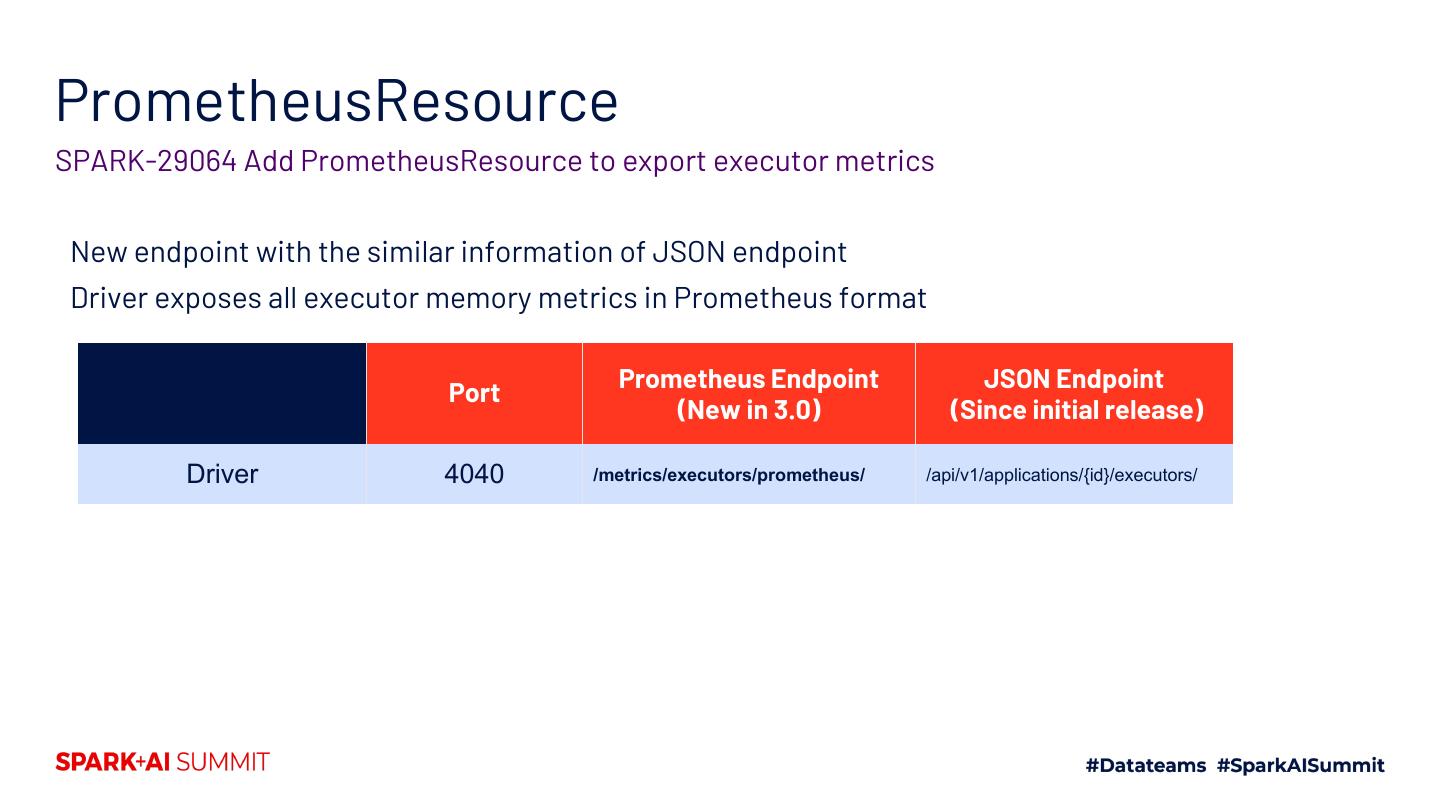
21 .PrometheusResource SPARK-29064 Add PrometheusResource to export executor metrics New endpoint with the similar information of JSON endpoint Driver exposes all executor memory metrics in Prometheus format Prometheus Endpoint JSON Endpoint Port (New in 3.0) (Since initial release) Driver 4040 /metrics/executors/prometheus/ /api/v1/applications/{id}/executors/
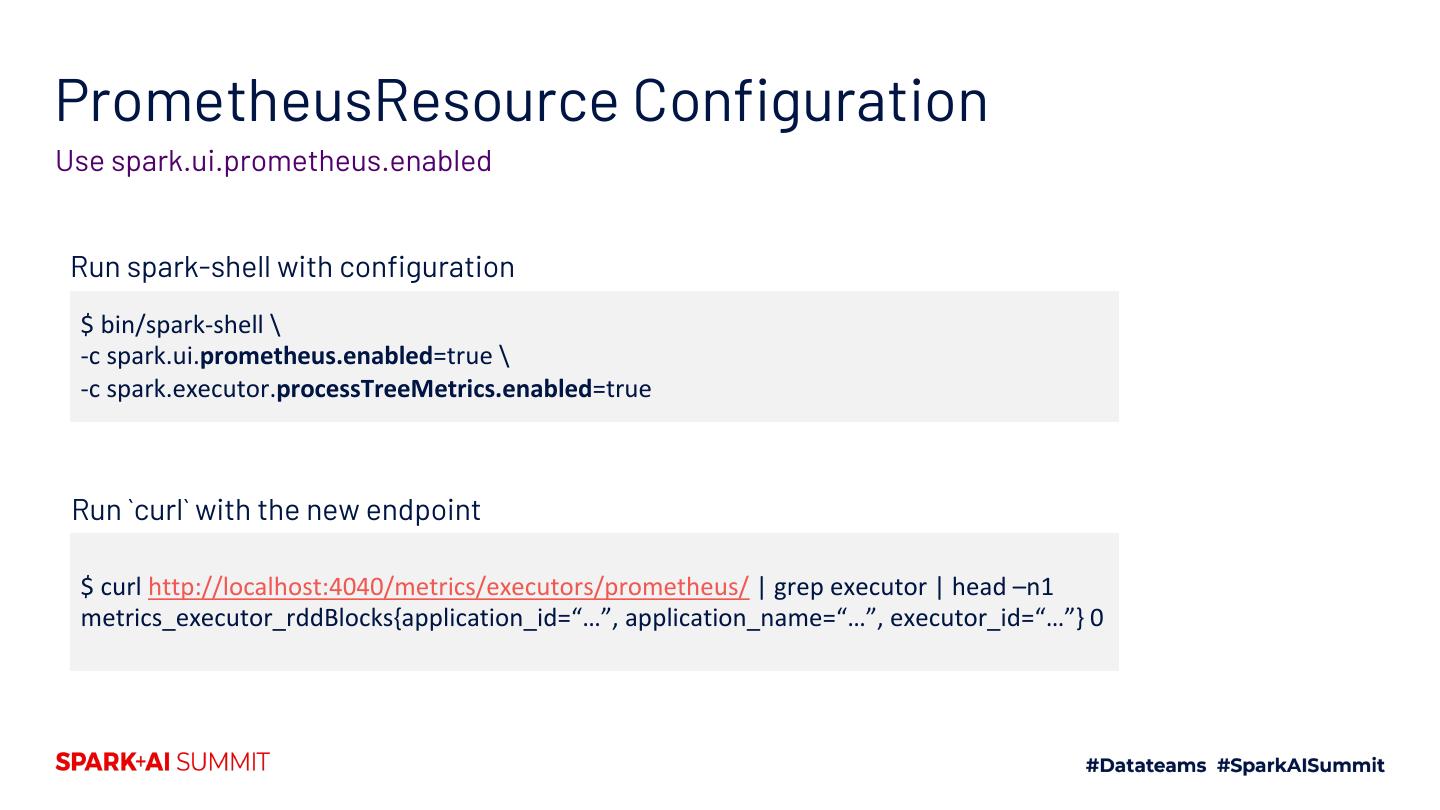
22 .PrometheusResource Configuration Use spark.ui.prometheus.enabled Run spark-shell with configuration $ bin/spark-shell \ -c spark.ui.prometheus.enabled=true \ -c spark.executor.processTreeMetrics.enabled=true Run `curl` with the new endpoint $ curl http://localhost:4040/metrics/executors/prometheus/ | grep executor | head –n1 metrics_executor_rddBlocks{application_id=“…”, application_name=“…”, executor_id=“…”} 0
23 .Monitoring in K8s cluster
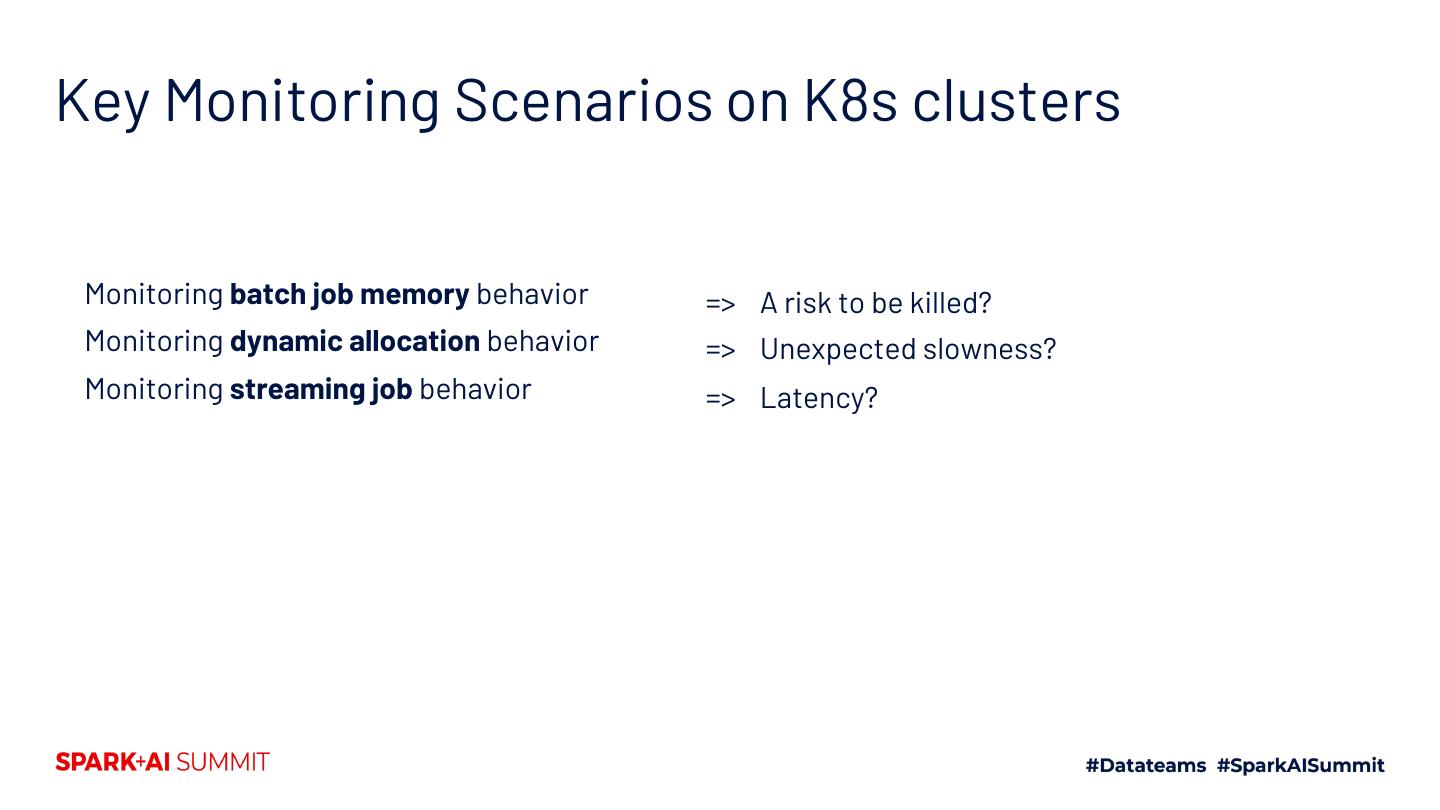
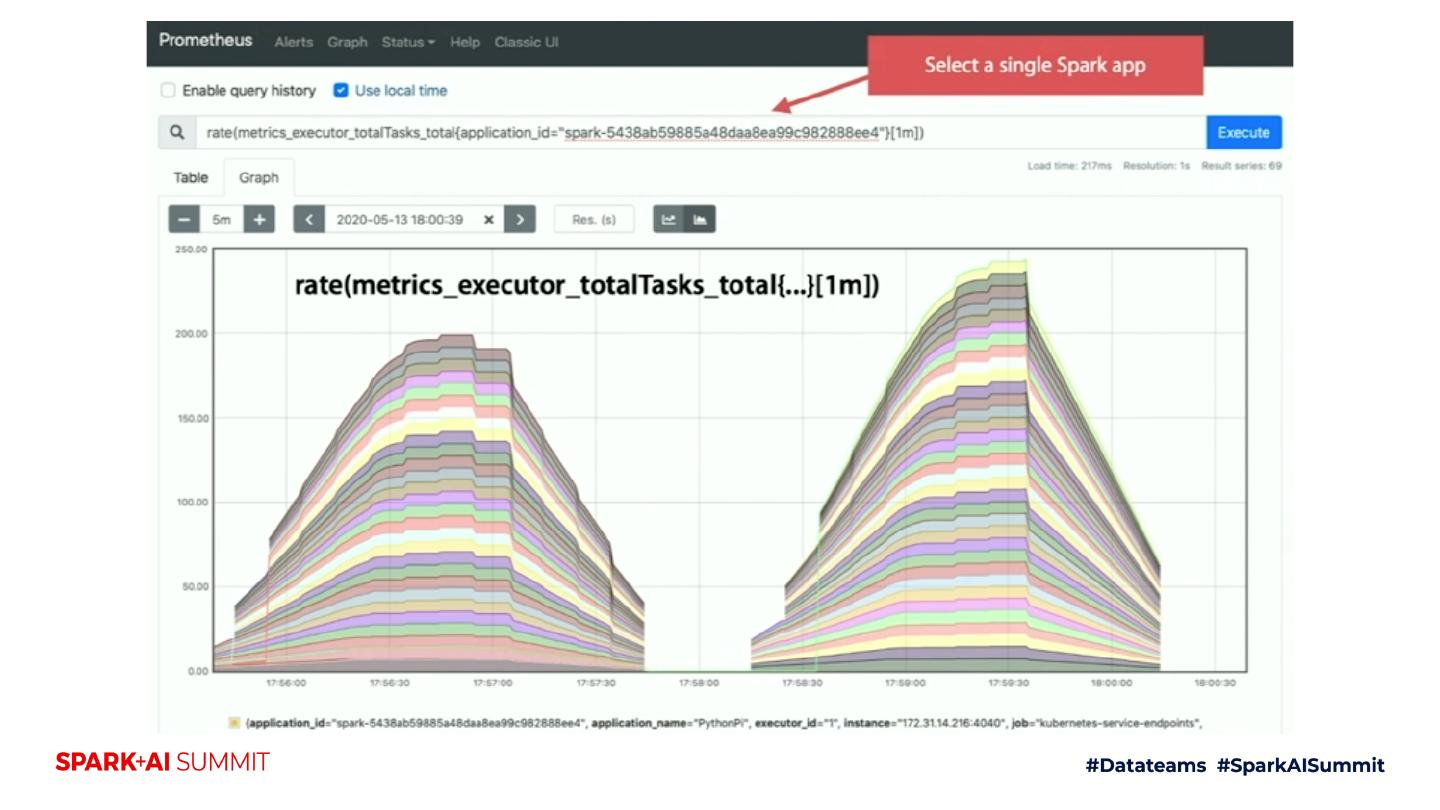
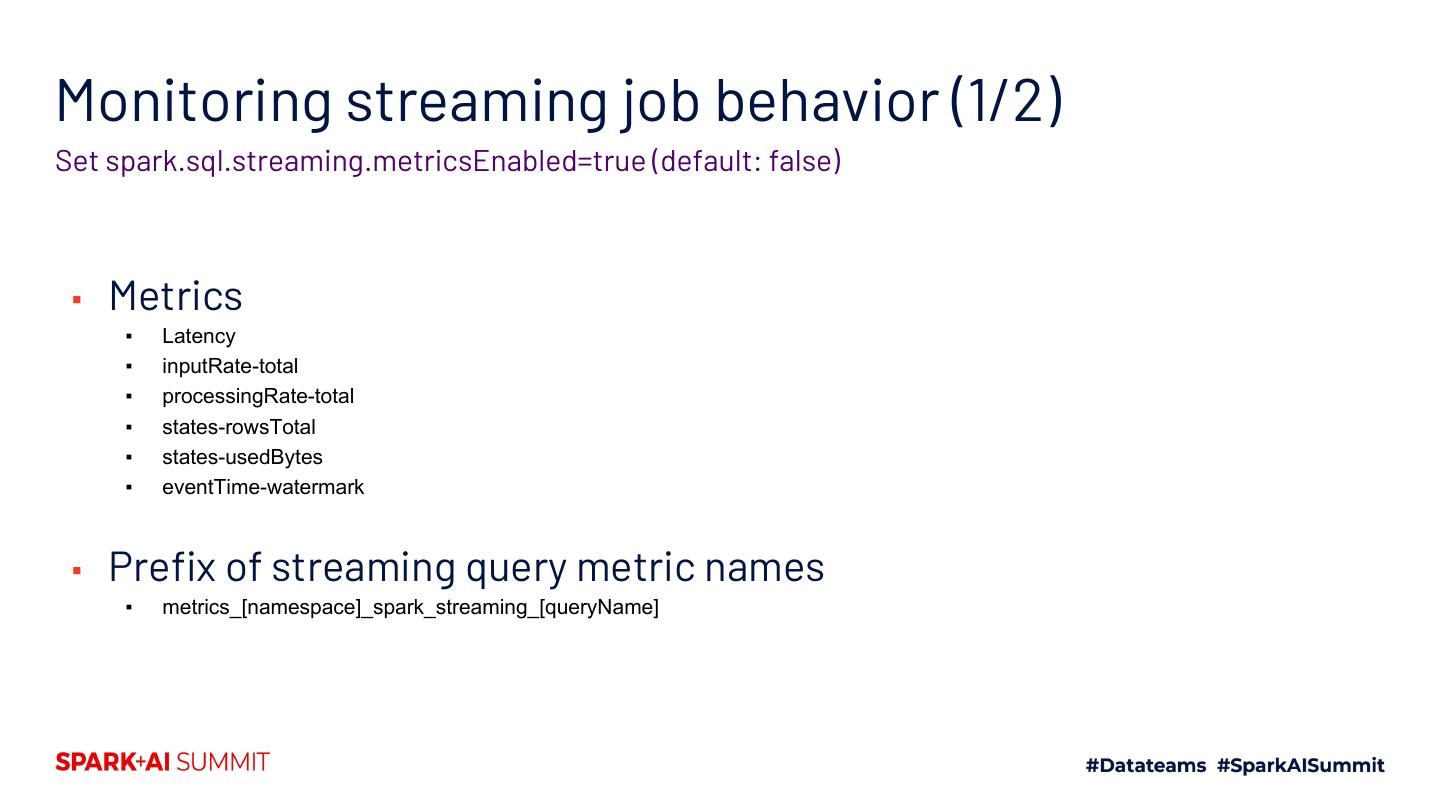
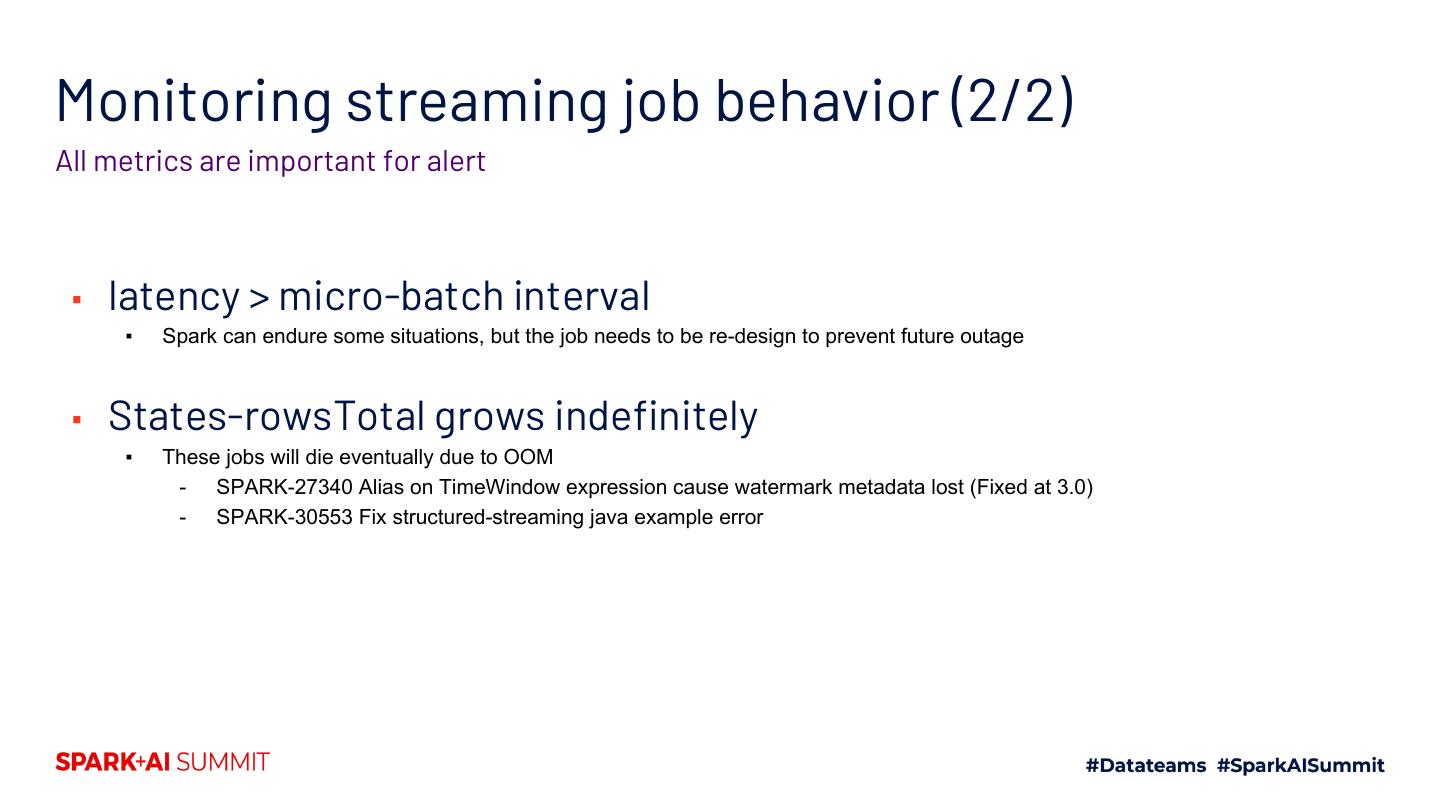
24 .Key Monitoring Scenarios on K8s clusters Monitoring batch job memory behavior => A risk to be killed? Monitoring dynamic allocation behavior => Unexpected slowness? Monitoring streaming job behavior => Latency?
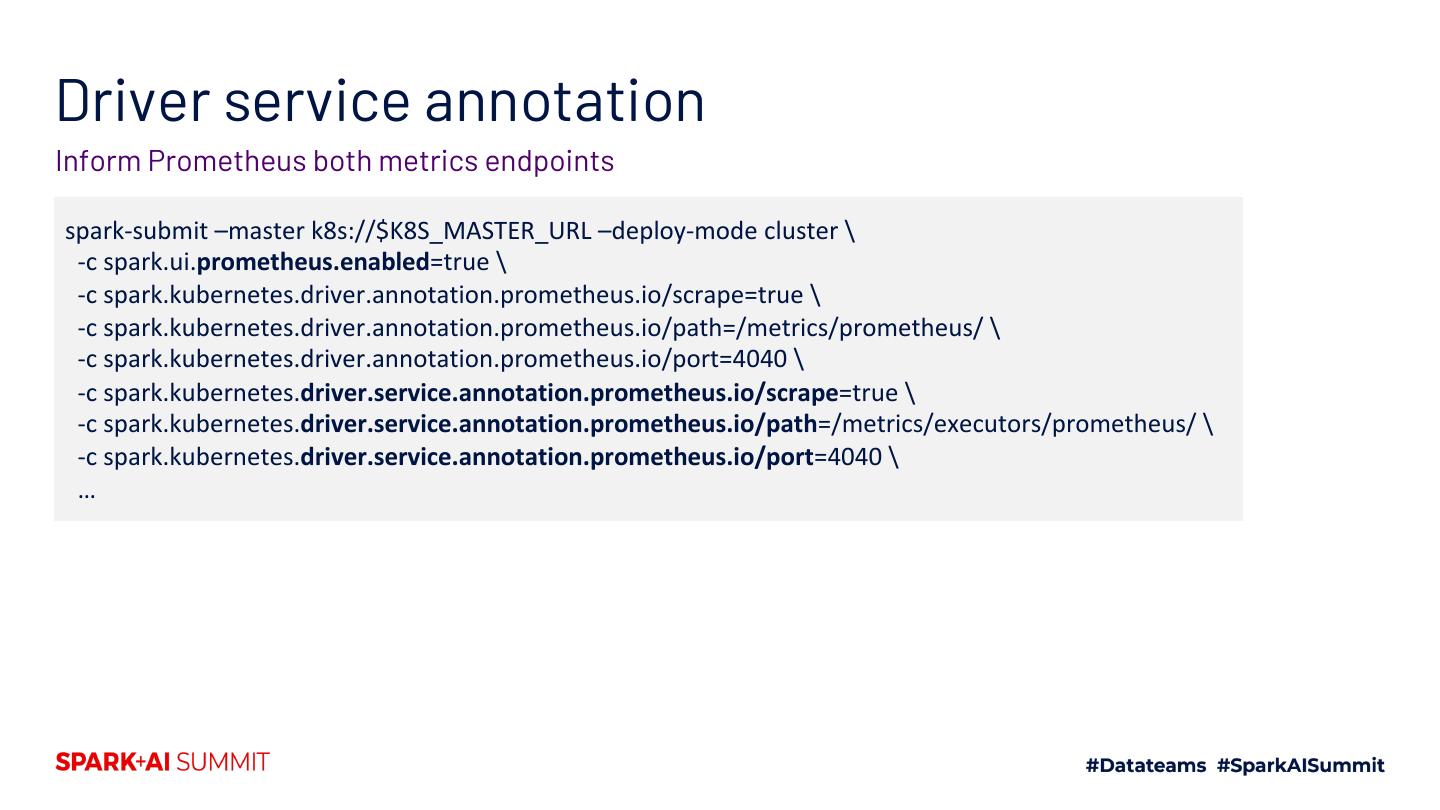
25 .Monitoring batch job memory behavior (1/2) Use Prometheus Service Discovery Configuration Port spark.ui.prometheus.enabled true spark.kubernetes.driver.annotation.prometheus.io/scrape true spark.kubernetes.driver.annotation.prometheus.io/path /metrics/executors/prometheus spark.kubernetes.driver.annotation.prometheus.io/port 4040
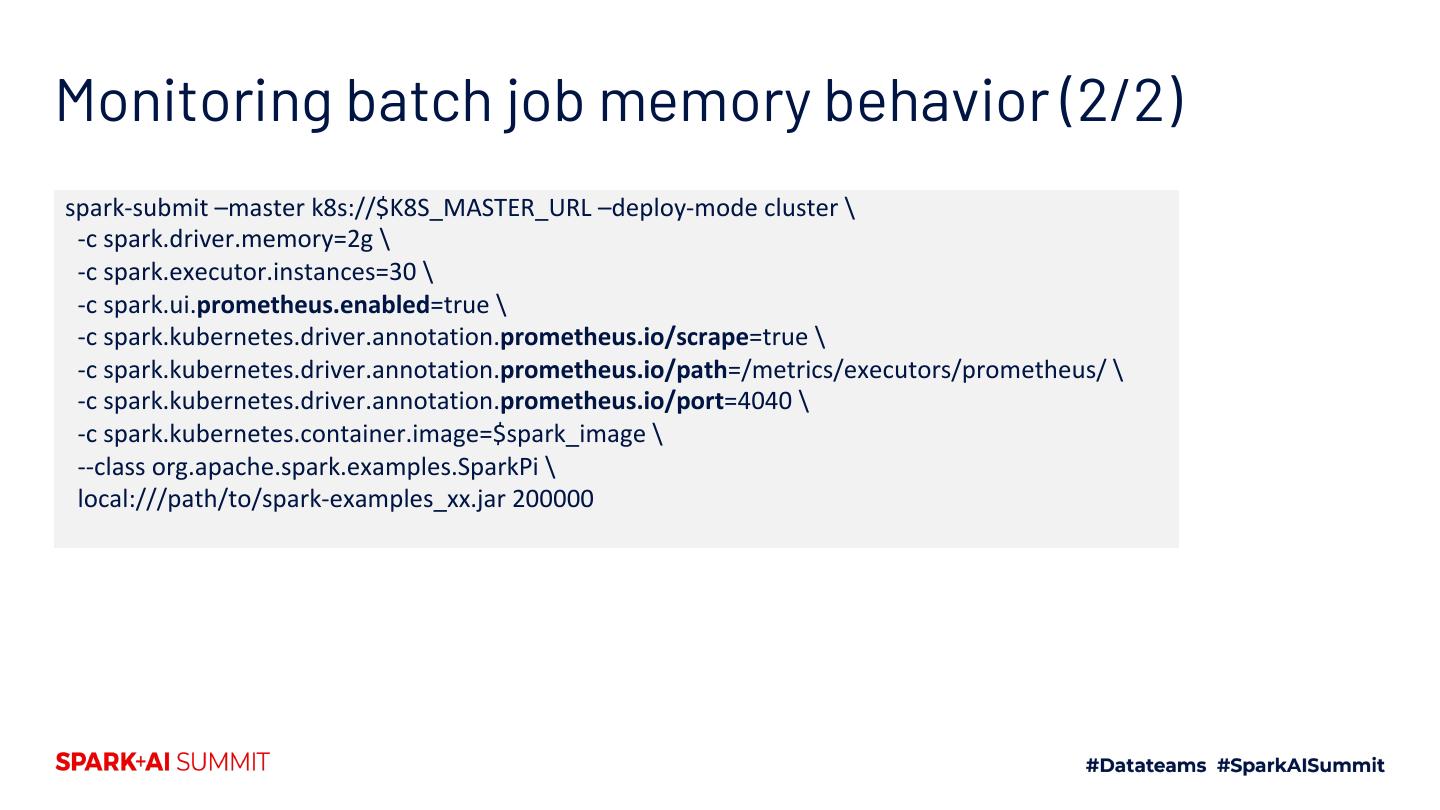
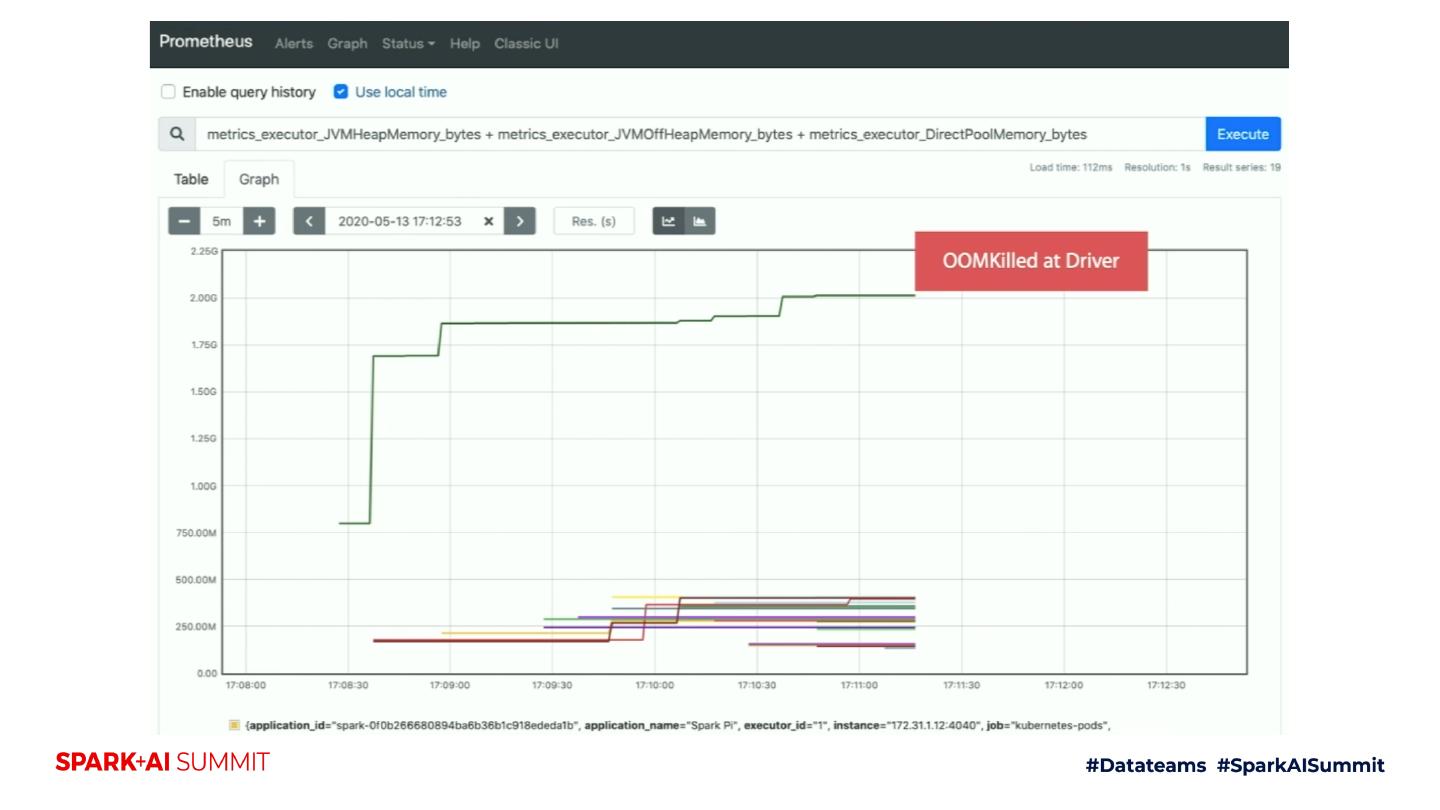
26 .Monitoring batch job memory behavior (2/2) spark-submit –master k8s://$K8S_MASTER_URL –deploy-mode cluster \ -c spark.driver.memory=2g \ -c spark.executor.instances=30 \ -c spark.ui.prometheus.enabled=true \ -c spark.kubernetes.driver.annotation.prometheus.io/scrape=true \ -c spark.kubernetes.driver.annotation.prometheus.io/path=/metrics/executors/prometheus/ \ -c spark.kubernetes.driver.annotation.prometheus.io/port=4040 \ -c spark.kubernetes.container.image=$spark_image \ --class org.apache.spark.examples.SparkPi \ local:///path/to/spark-examples_xx.jar 200000
27 .
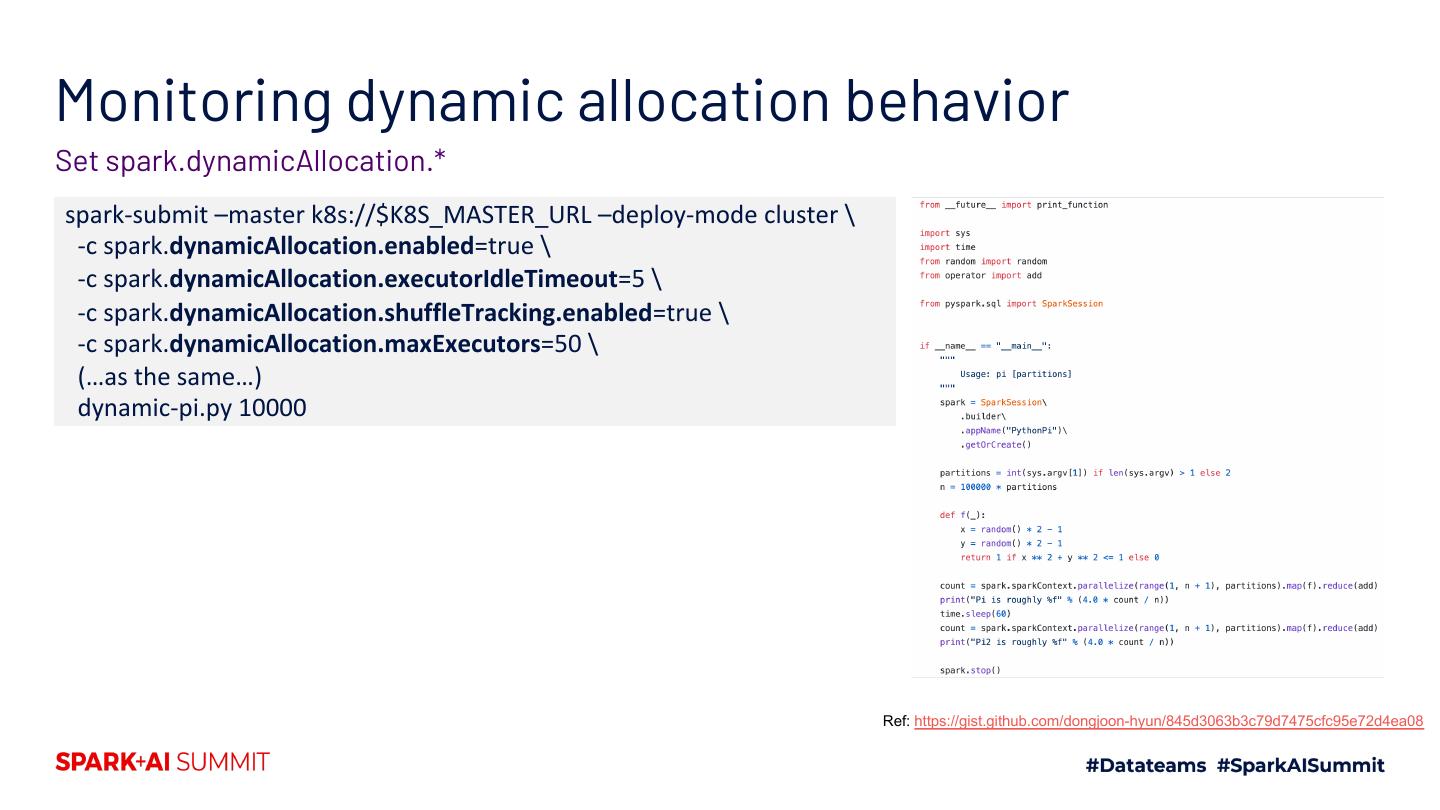
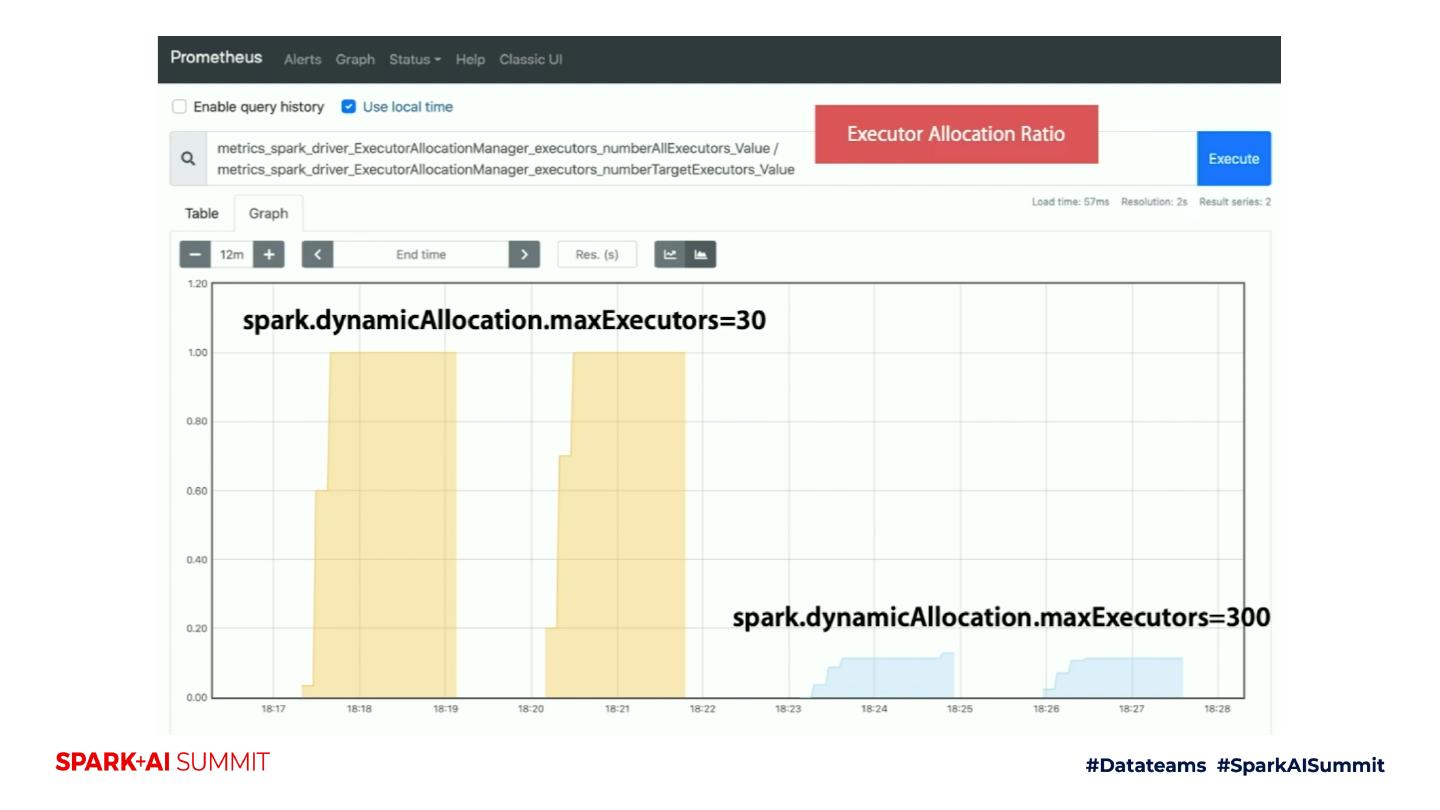
28 .Monitoring dynamic allocation behavior Set spark.dynamicAllocation.* spark-submit –master k8s://$K8S_MASTER_URL –deploy-mode cluster \ -c spark.dynamicAllocation.enabled=true \ -c spark.dynamicAllocation.executorIdleTimeout=5 \ -c spark.dynamicAllocation.shuffleTracking.enabled=true \ -c spark.dynamicAllocation.maxExecutors=50 \ (…as the same…) dynamic-pi.py 10000 Ref: https://gist.github.com/dongjoon-hyun/845d3063b3c79d7475cfc95e72d4ea08
29 .


