- 快召唤伙伴们来围观吧
- 微博 QQ QQ空间 贴吧
- 视频嵌入链接 文档嵌入链接
- 复制
- 微信扫一扫分享
- 已成功复制到剪贴板
Augment Analytics - Nous
Augment Analytics - Nous
展开查看详情
1 .Augmented Analytics -Nous 2.0
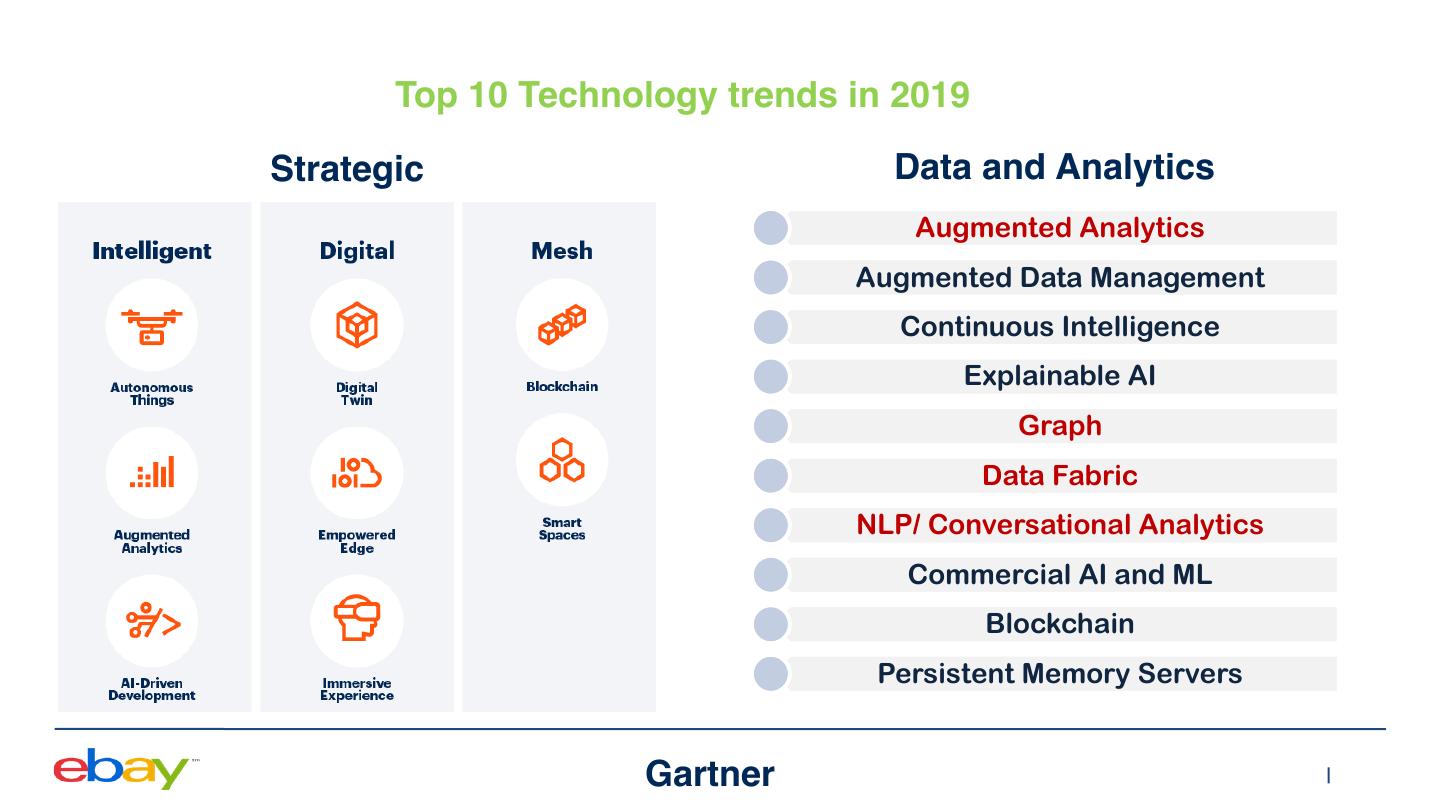
2 . Top 10 Technology trends in 2019 Strategic Data and Analytics Augmented Analytics Augmented Data Management Continuous Intelligence Explainable AI Graph Data Fabric NLP/ Conversational Analytics Commercial AI and ML Blockchain Persistent Memory Servers Gartner
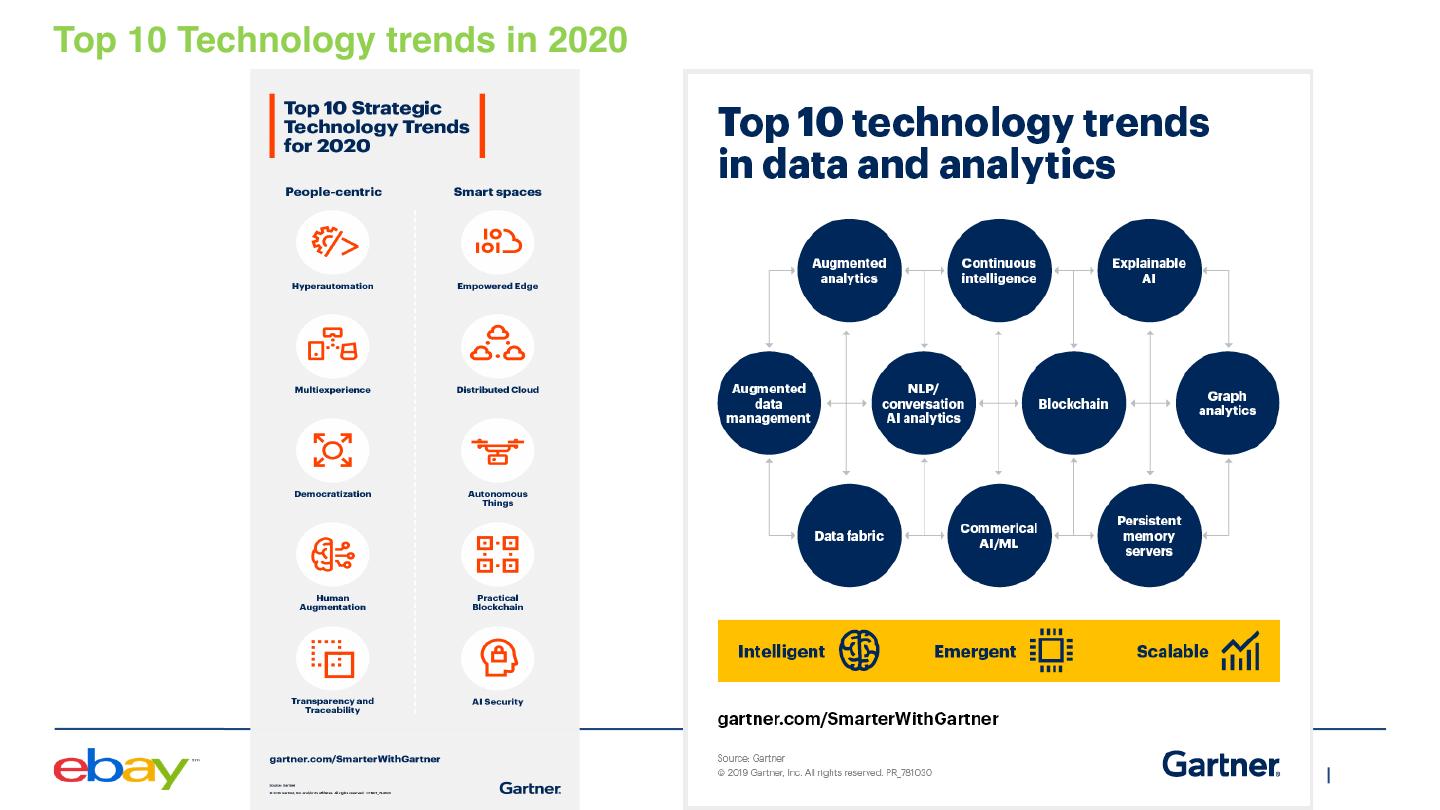
3 .Top 10 Technology trends in 2020
4 .Trend No. 1: Augmented analytics Augmented analytics automates finding and surfacing the most important insights or changes in the business to optimize decision making. It does this in a fraction of the time compared to manual approaches. Augmented analytics makes insights available to all business roles. While it reduces reliance on analytics, data science and machine learning experts, it will require increased data literacy across the organization. By 2020, augmented analytics will be a dominant driver of new purchases of analytics and business intelligence as well as data science and machine learning platforms.
5 .Data to Analytics Challenge • Data preparation is huge effort • Data silos on different data platforms • Too many ad-hoc reports without single version of truth • Data Scientist is human, exhausted on repetitive work • A typical data analyst only analyzes a small portion (probably 10%)
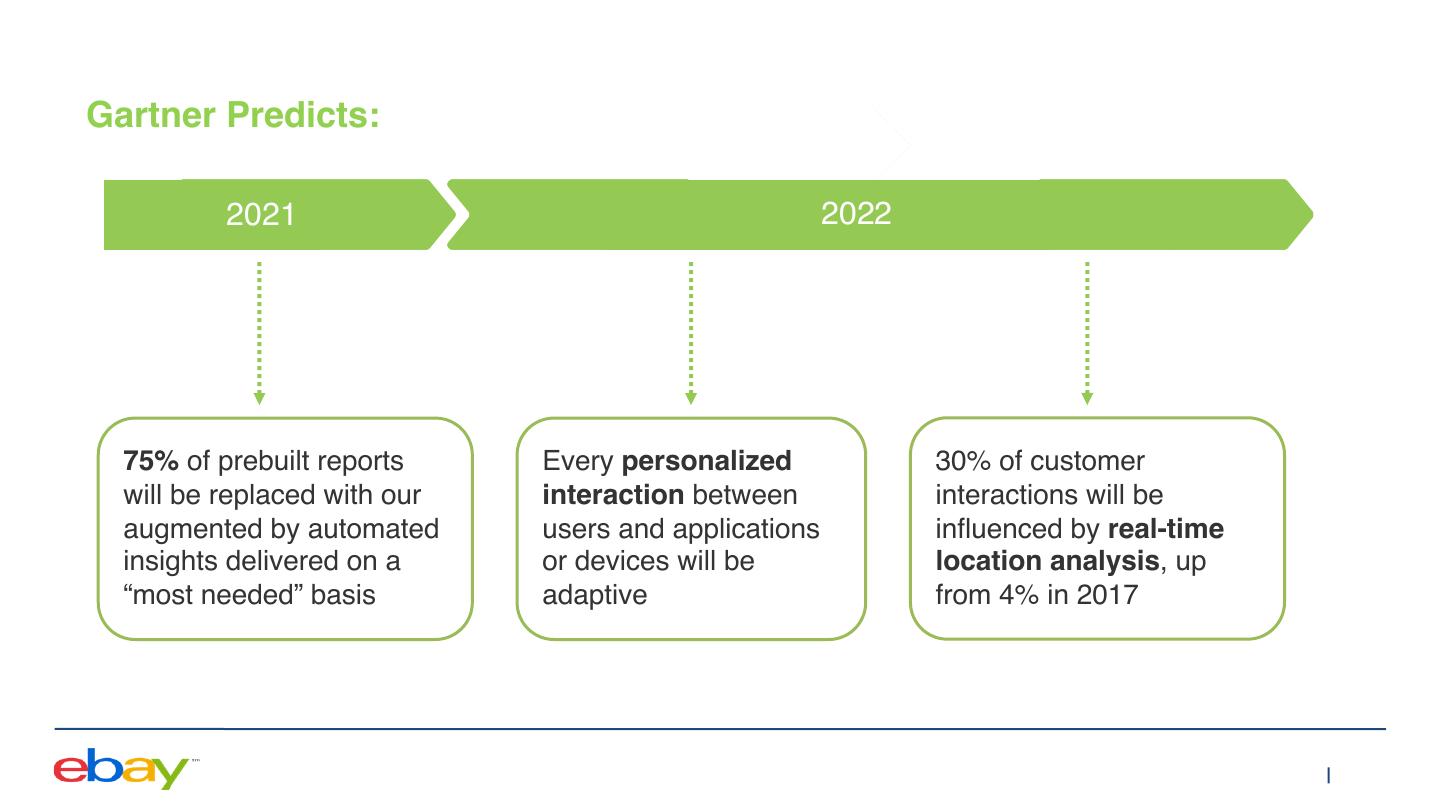
6 .Gartner Predicts: 2021 2022 75% of prebuilt reports Every personalized 30% of customer will be replaced with our interaction between interactions will be augmented by automated users and applications influenced by real-time insights delivered on a or devices will be location analysis, up “most needed” basis adaptive from 4% in 2017
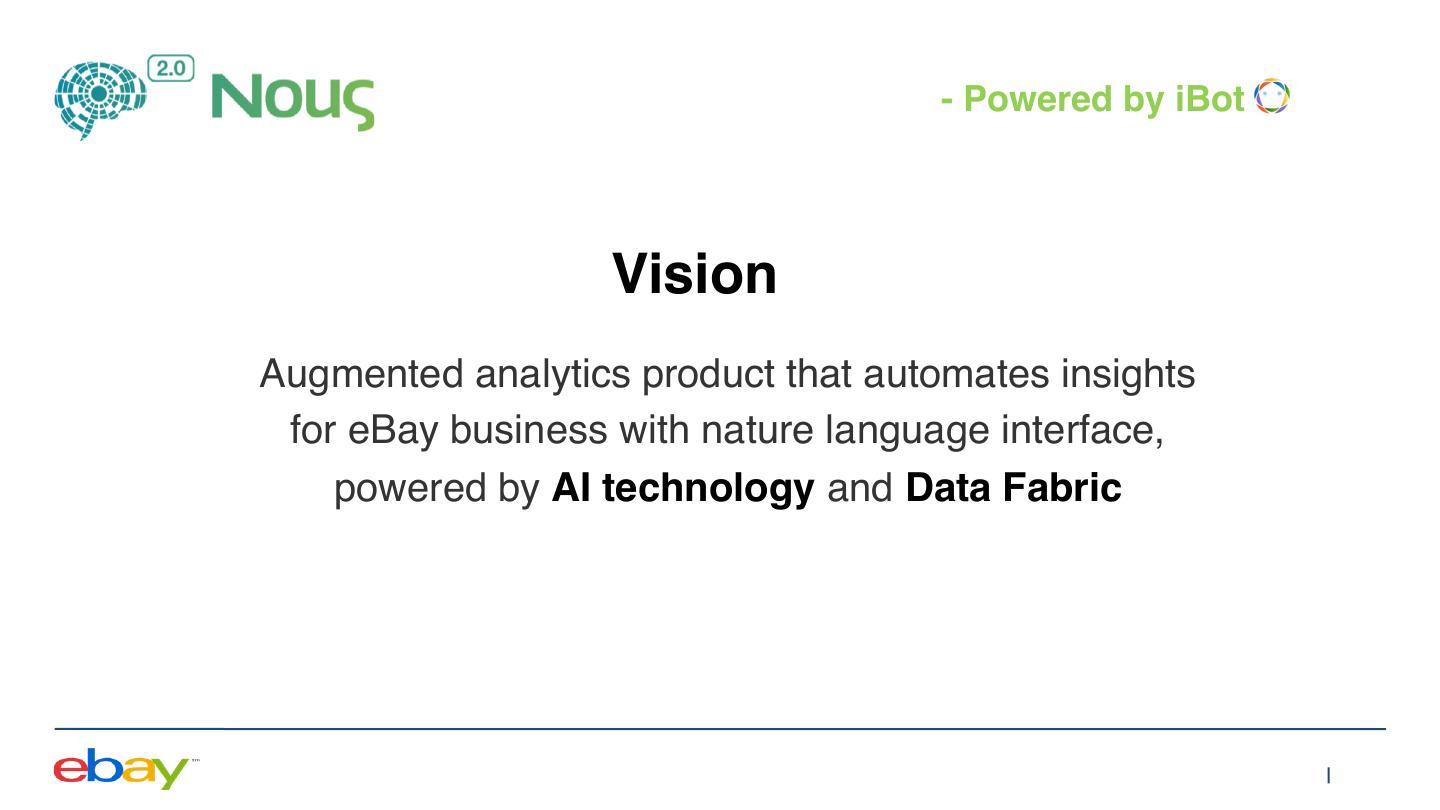
7 . - Powered by iBot Vision Augmented analytics product that automates insights for eBay business with nature language interface, powered by AI technology and Data Fabric
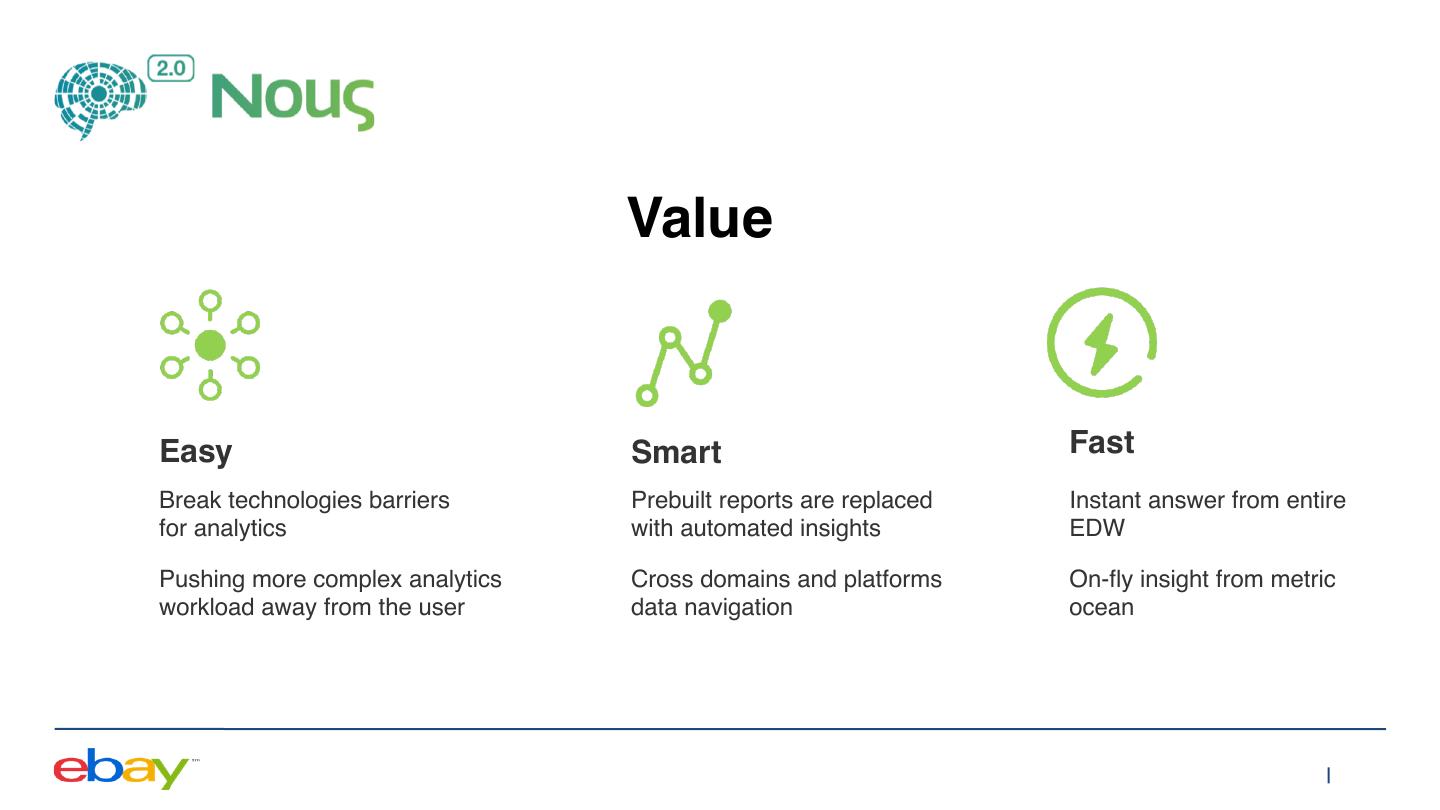
8 . Value Easy Smart Fast Break technologies barriers Prebuilt reports are replaced Instant answer from entire for analytics with automated insights EDW Pushing more complex analytics Cross domains and platforms On-fly insight from metric workload away from the user data navigation ocean
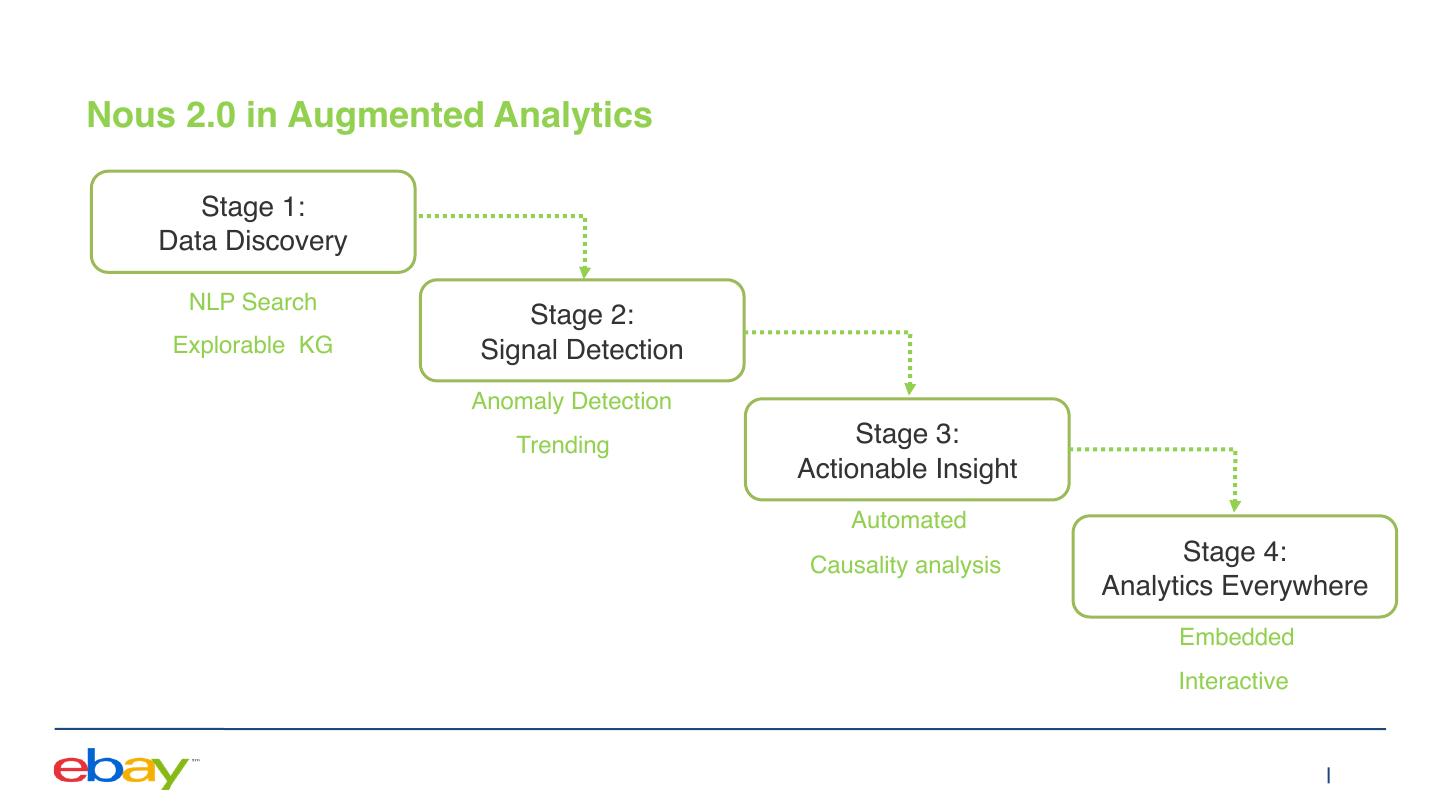
9 .Nous 2.0 in Augmented Analytics Stage 1: Data Discovery NLP Search Stage 2: Explorable KG Signal Detection Anomaly Detection Trending Stage 3: Actionable Insight Automated Causality analysis Stage 4: Analytics Everywhere Embedded Interactive
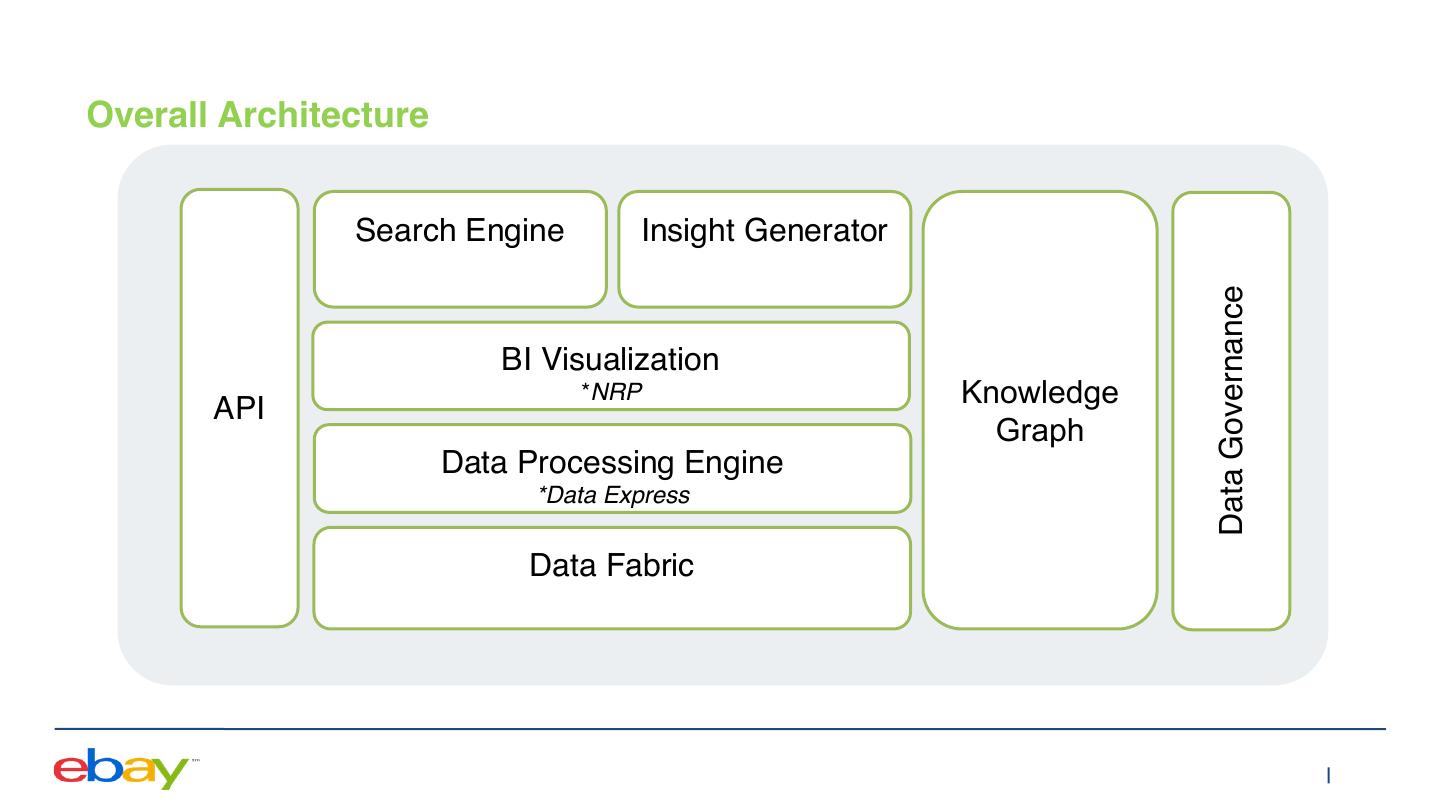
10 .Overall Architecture Search Engine Insight Generator Data Governance BI Visualization API *NRP Knowledge Graph Data Processing Engine *Data Express Data Fabric
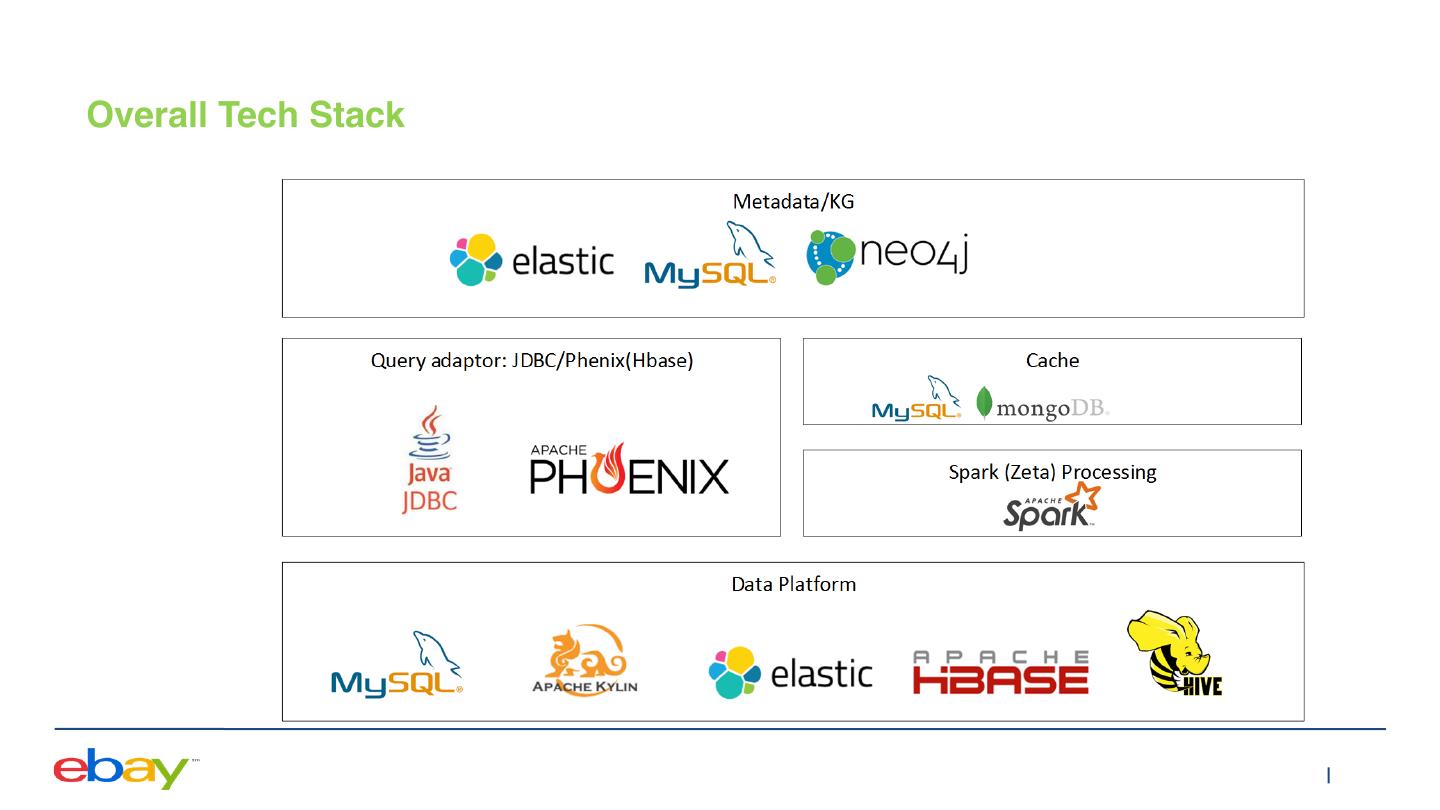
11 .Overall Tech Stack
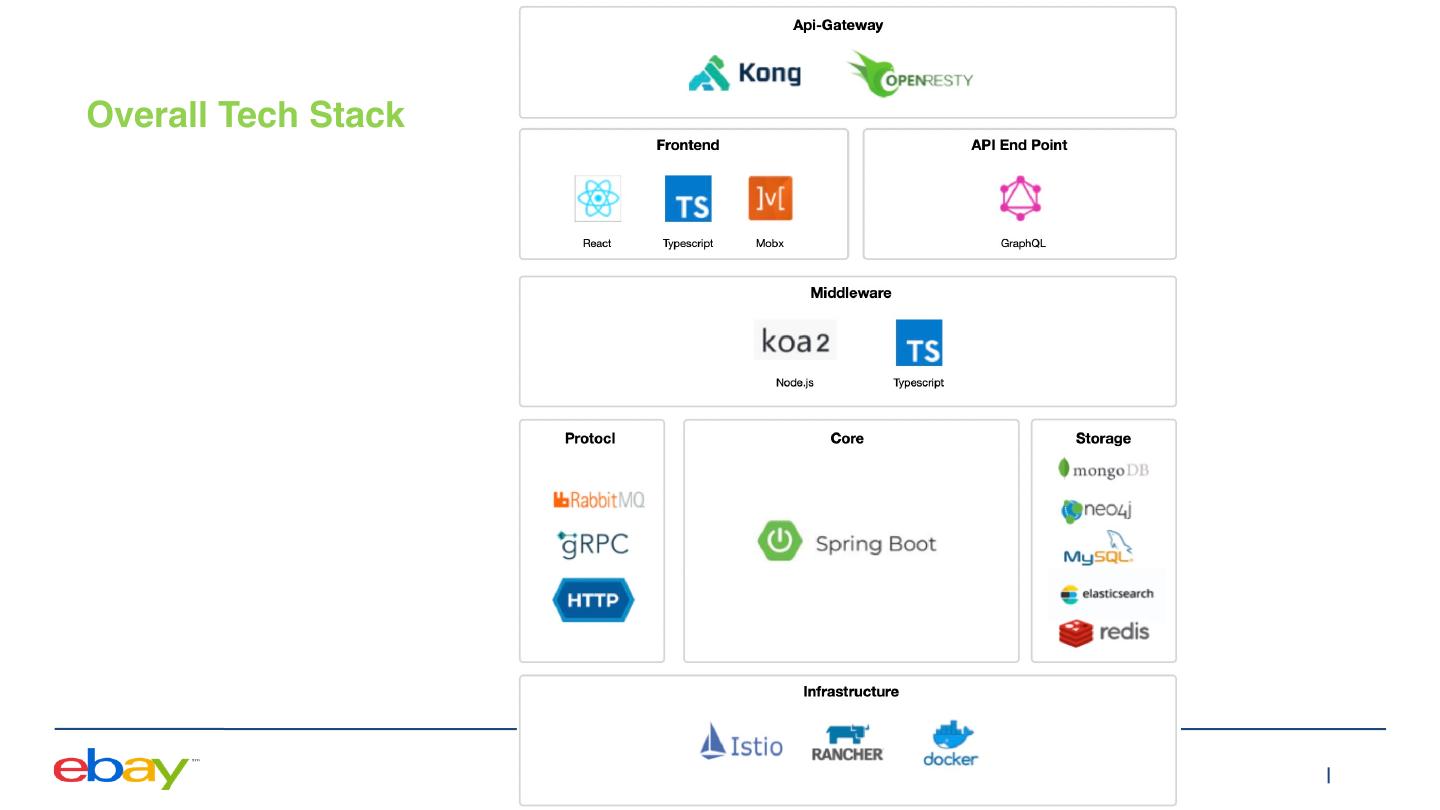
12 .Overall Tech Stack
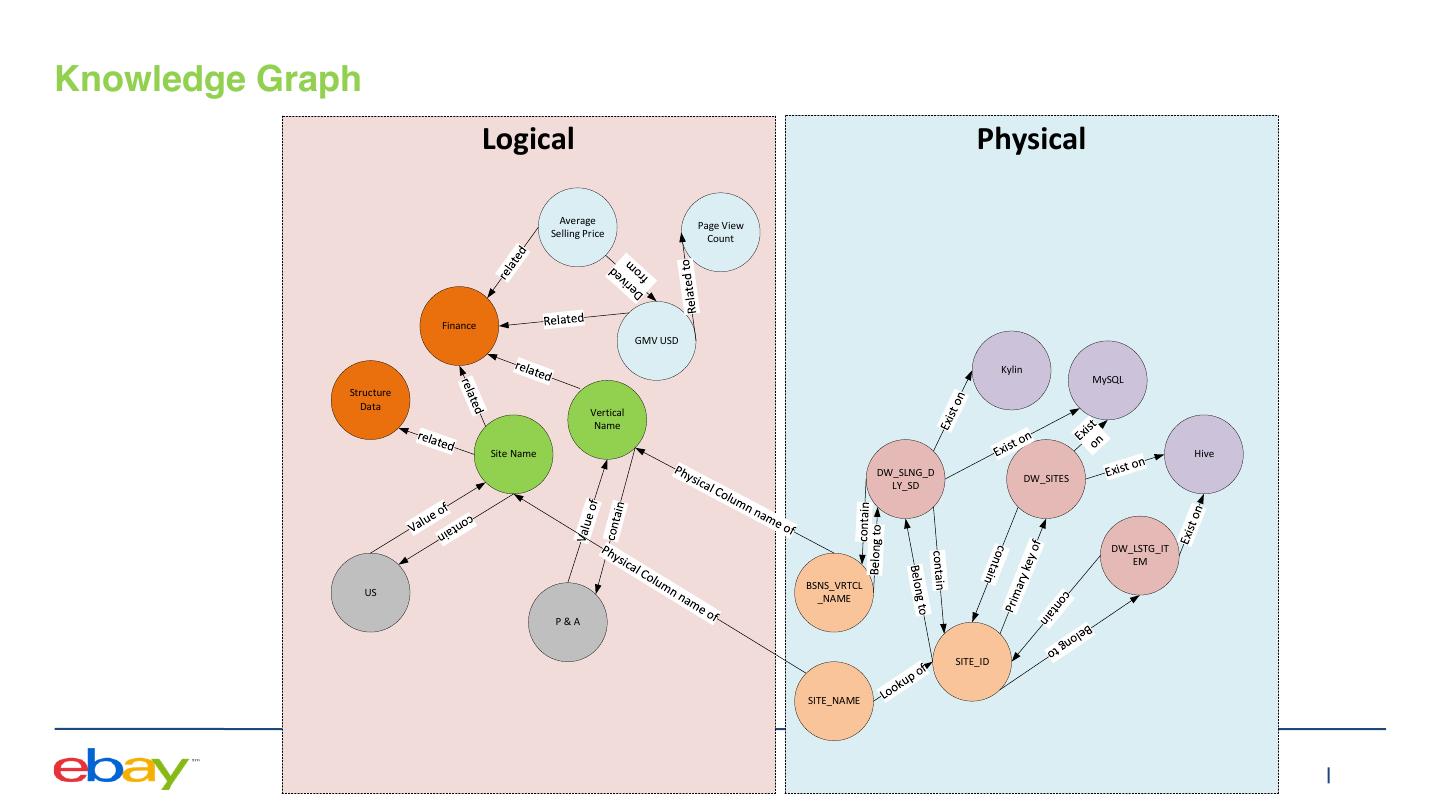
13 .Knowledge Graph Logical Physical Average Page View Selling Price Count Finance GMV USD Kylin MySQL Structure Data Vertical Name Site Name Hive DW_SLNG_D DW_SITES LY_SD DW_LSTG_IT EM BSNS_VRTCL US _NAME P&A SITE_ID SITE_NAME
14 .Knowledge Graph - Architecture
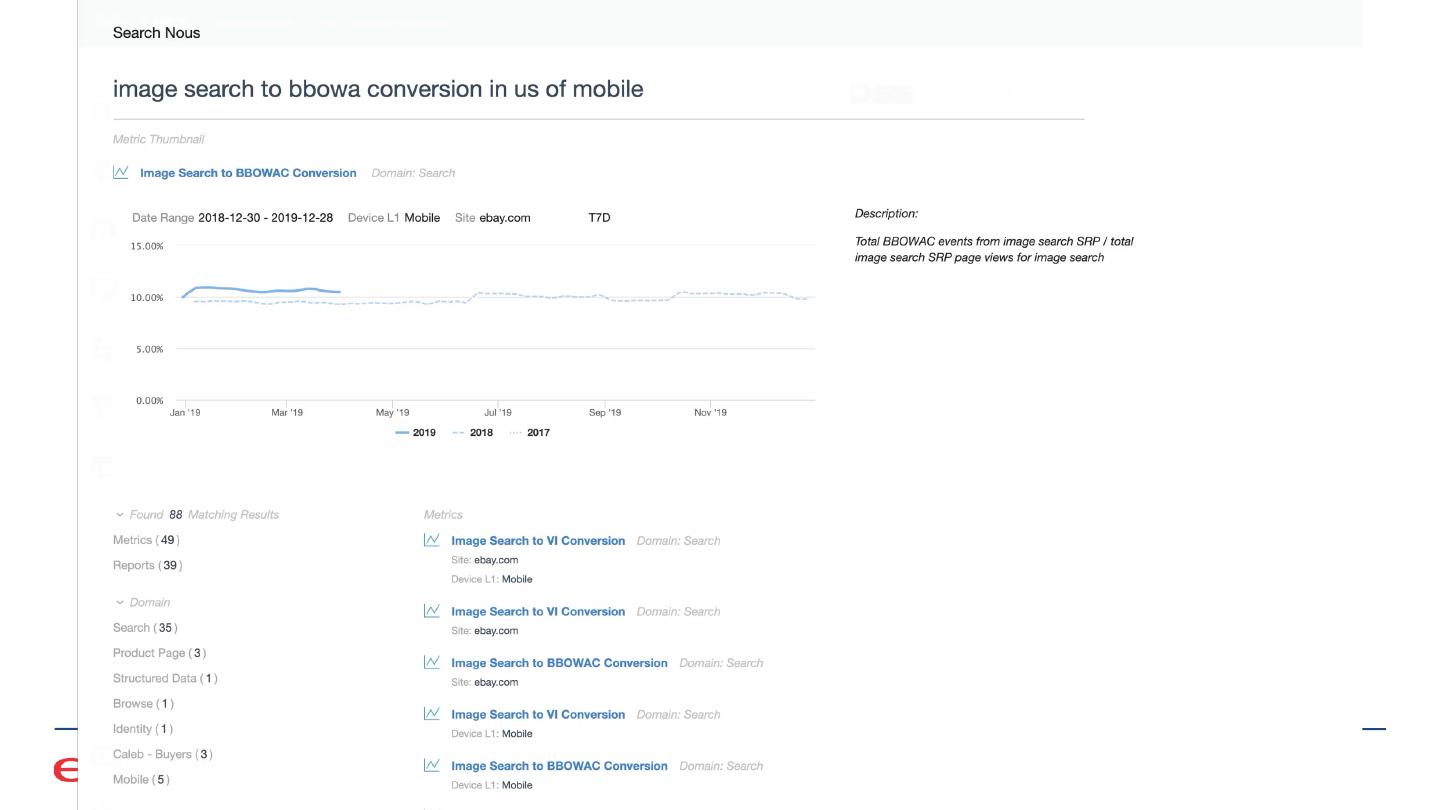
15 .NLP Search Search metrics, data, cubes and tables as you would on Google • Nature language • Auto suggestion • Smart refinement • Trending recommendation
16 .
17 .
18 .Architecture - Search Autocomplete Service NLP Parser Logic Query Engine Knowledge Graph Semantic Cache Metric Graph
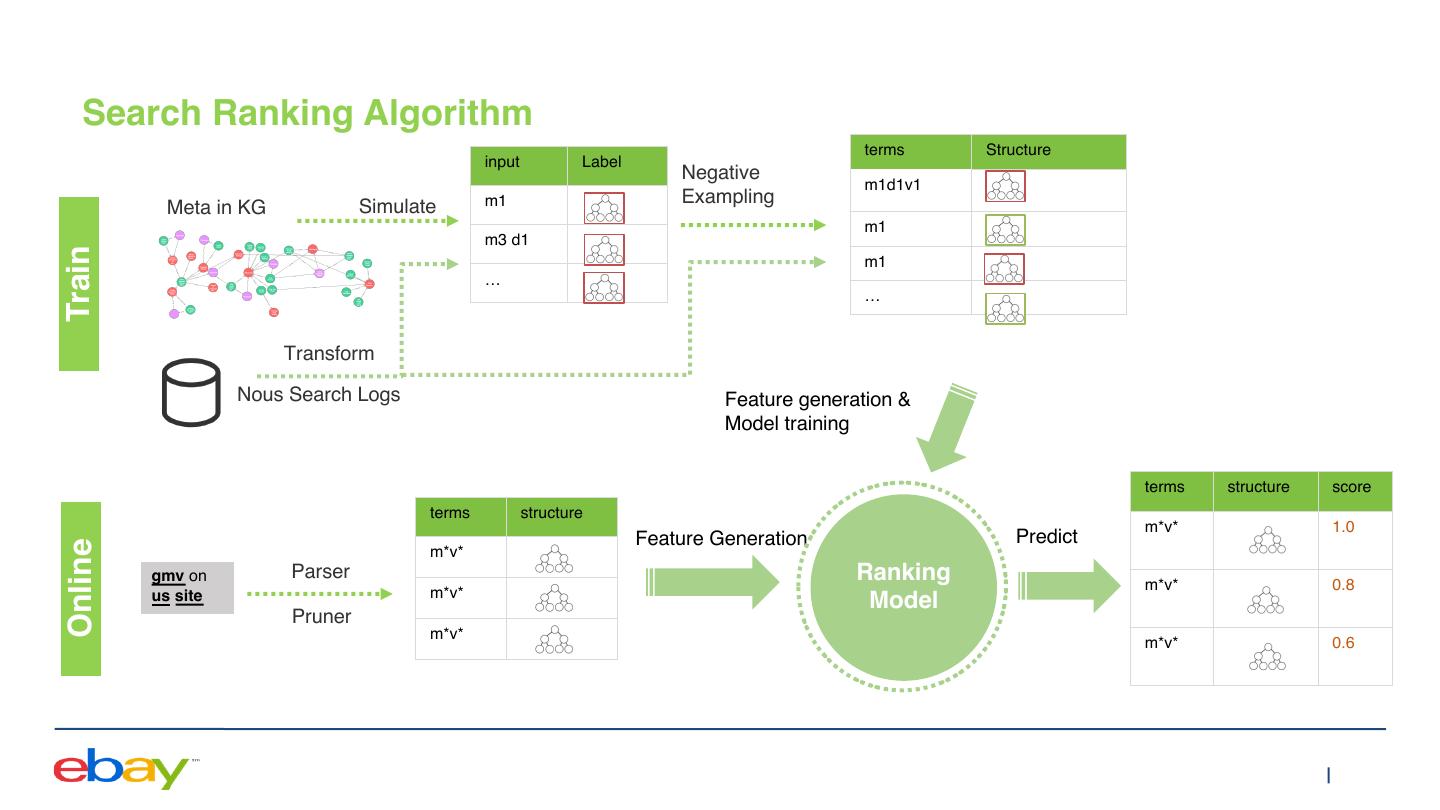
19 . Search Ranking Algorithm terms Structure input Label Negative m1d1v1 m1 Exampling Meta in KG Simulate m1 m3 d1 Train m1 … … … … Transform Nous Search Logs Feature generation & Model training terms structure score terms structure m*v* 1.0 Feature Generation Predict Online m*v* gmv on Parser Ranking m*v* 0.8 us site m*v* Model Pruner m*v* m*v* 0.6
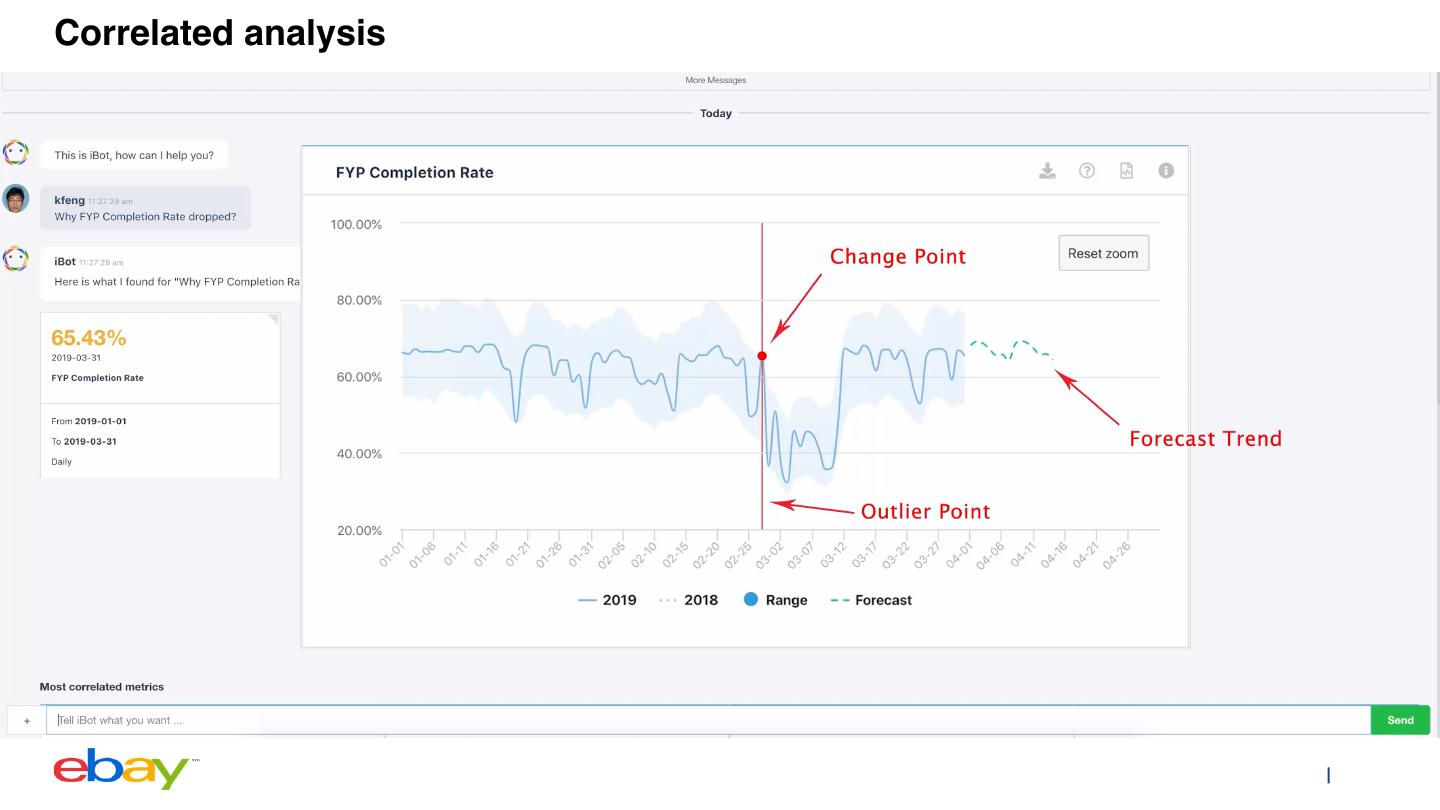
20 .Automated Insight • Outlier & Anomaly • Correlated Analysis • Causality detection
21 .Outlier & Anomaly
22 .Correlated analysis
23 .Causality Detection
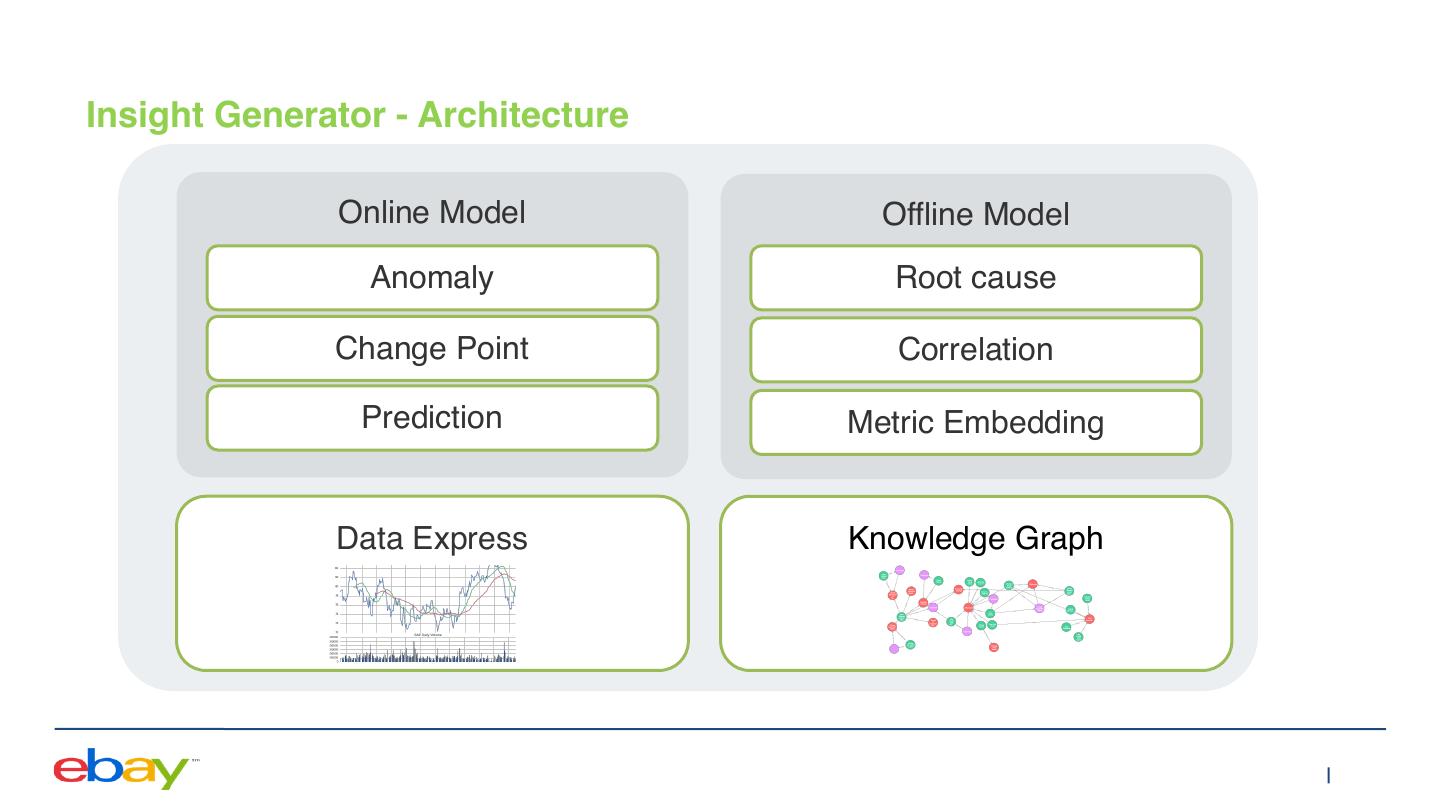
24 .Insight Generator - Architecture Online Model Offline Model Anomaly Root cause Change Point Correlation Prediction Metric Embedding Data Express Knowledge Graph
25 .Insight Generator Phase I Phase II Unsupervised model User Feedback + metrics • State space machine (local trend) • Bayesian change point detection INPUT • Time Series decomposition ENCODE R Anomaly Change Point Seasonal Trend Detection Detection Decomposition π Correlation Computation LAYTENT MERGE m Enhance the model LAYER 1 with semi- m supervised neural 4 networks DECODE m R m 5 2 m 3 OUTPUT Anomaly Detection Change Point Detection Seasonal Trend Decomposition
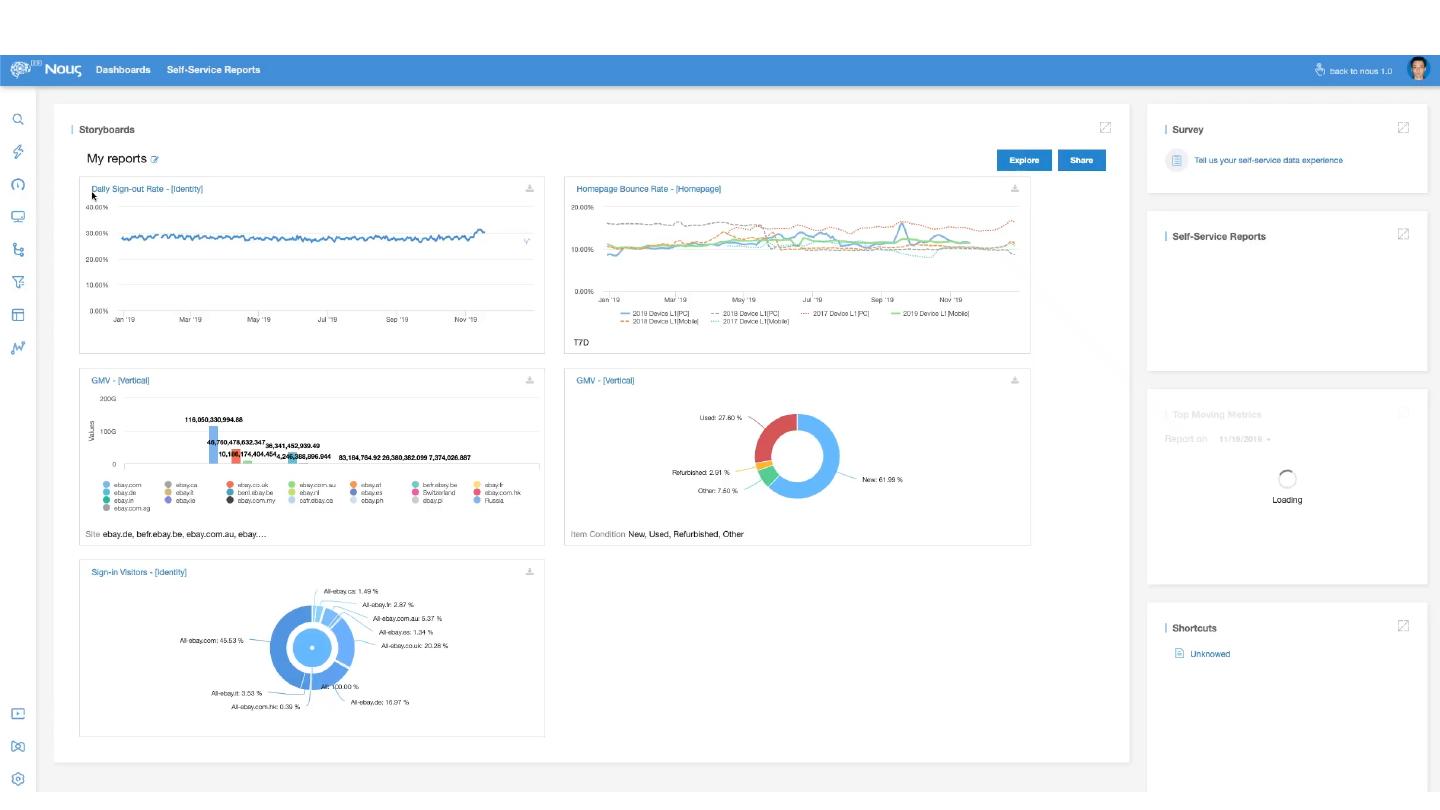
26 .Self Service Reporting Build customized report with drag and drop experience
27 .
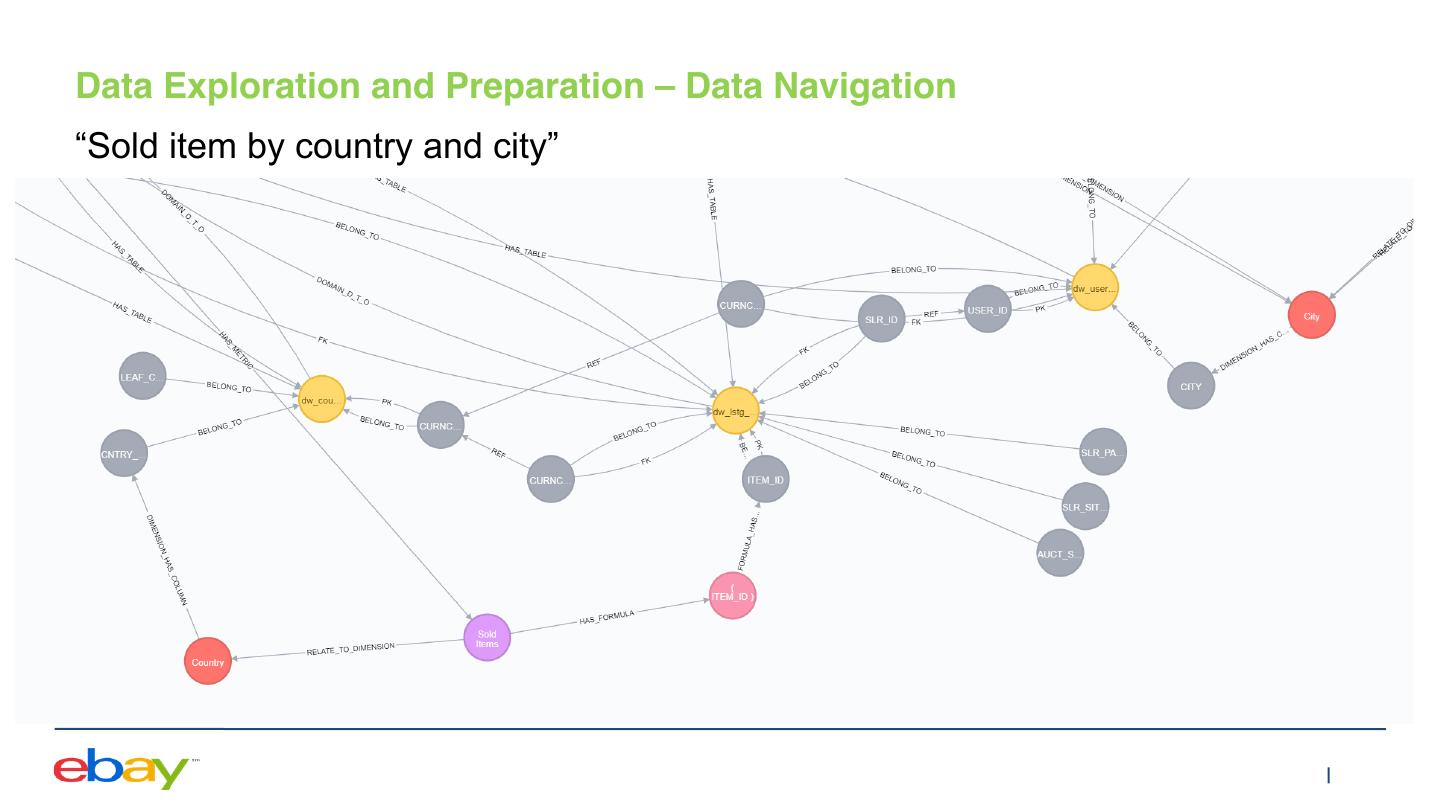
28 .Data Exploration and Preparation 1.Data Navigation based on KG 2.Data auto preparation
29 .Data Exploration and Preparation – Data Navigation “Sold item by country and city”


