- 快召唤伙伴们来围观吧
- 微博 QQ QQ空间 贴吧
- 视频嵌入链接 文档嵌入链接
- 复制
- 微信扫一扫分享
- 已成功复制到剪贴板


Using Production Profiles to Guide Optimizations
Identifying the most important areas for optimization can be difficult. One large factor of this difficulty is the fact that different production workloads have different needs and different bottlenecks. Important efficiency concerns for one workload might be negligible for another. As a result, it is very important that engineers working on efficiency know how to profile their workload and use data to prioritize the right things. There are multiple aspects of this which are worth discussing. Firstly, it is important to get the profiling right.
There are different types of profilers that have different pros and cons, and as an engineer looking at profiles, it is important to have a high level understanding of what is happening under the hood to put everything in context. For instance, at Facebook we use both a perf-based profiler called Strobelight that has minimal Java specific context, and the third party async-profiler, which is a Java specific solution that misses native processes such as transforms.
Both of these solutions are important for different use cases. Secondly, being able to interpret the results and view them in meaningful ways is vital to properly identify the biggest potential efficiency wins. There are many different ways of looking at the data which can be useful in different situations. At Facebook, we rely heavily on data driven investigations to determine where our efficiency efforts are best spent. This involves heavy use of profiling.
In this talk, I will go over some of the different profilers and other tools we employ to gather the data. I will also provide some examples of how we’ve uncovered issues in the past, both deliberately and incidentally, and the process involved to come to the conclusions we did.
展开查看详情
1 .WIFI SSID:Spark+AISummit | Password: UnifiedDataAnalytics
2 .Using Production Profiles to Guide Optimizations Adam Barth, Facebook #UnifiedDataAnalytics #SparkAISummit
3 .About me • Software engineer at Facebook – Joined as a new grad in 2018 – Focusing on performance and efficiency of Facebook’s data warehouse compute engines • Spark • Presto – Working almost exclusively on profiling tools #UnifiedDataAnalytics #SparkAISummit 3
4 .Motivation • Large software deployments should ensure efficient hardware utilization – Even small improvements translate to significant computational savings • Profiling tools are an important first step towards sustaining an efficient software stack – Over the last 18 months, we have driven 2x throughput on some of FB’s data warehouse workloads 4
5 .Performance questions • Which parts of the code can be improved? – Which improvements are the most important/worthwhile? • How can performance improvements be validated? – In cases with tradeoffs (like parameter tuning), what is considered optimal? • How can we quickly catch regressions? #UnifiedDataAnalytics #SparkAISummit 5
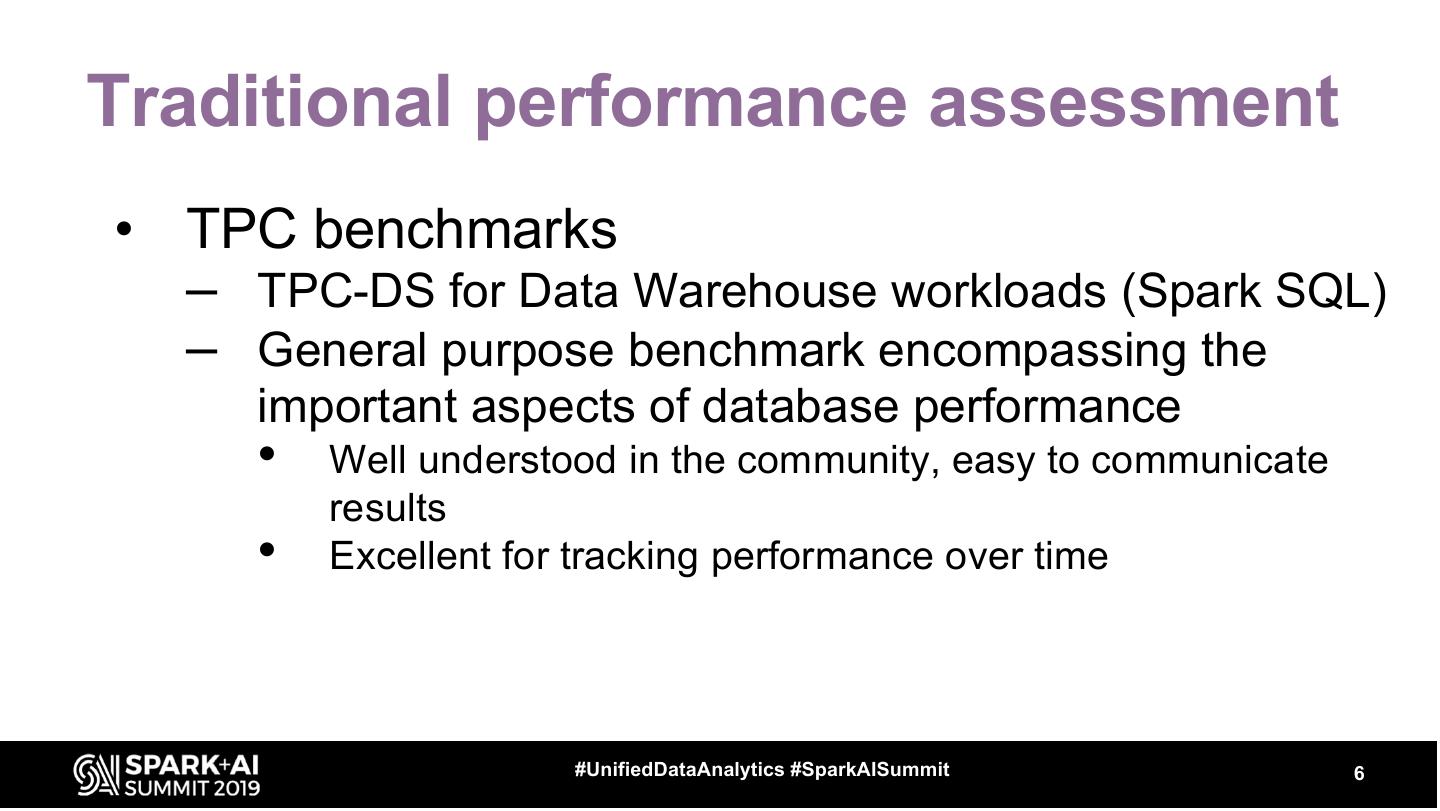
6 .Traditional performance assessment • TPC benchmarks – TPC-DS for Data Warehouse workloads (Spark SQL) – General purpose benchmark encompassing the important aspects of database performance • Well understood in the community, easy to communicate results • Excellent for tracking performance over time #UnifiedDataAnalytics #SparkAISummit 6
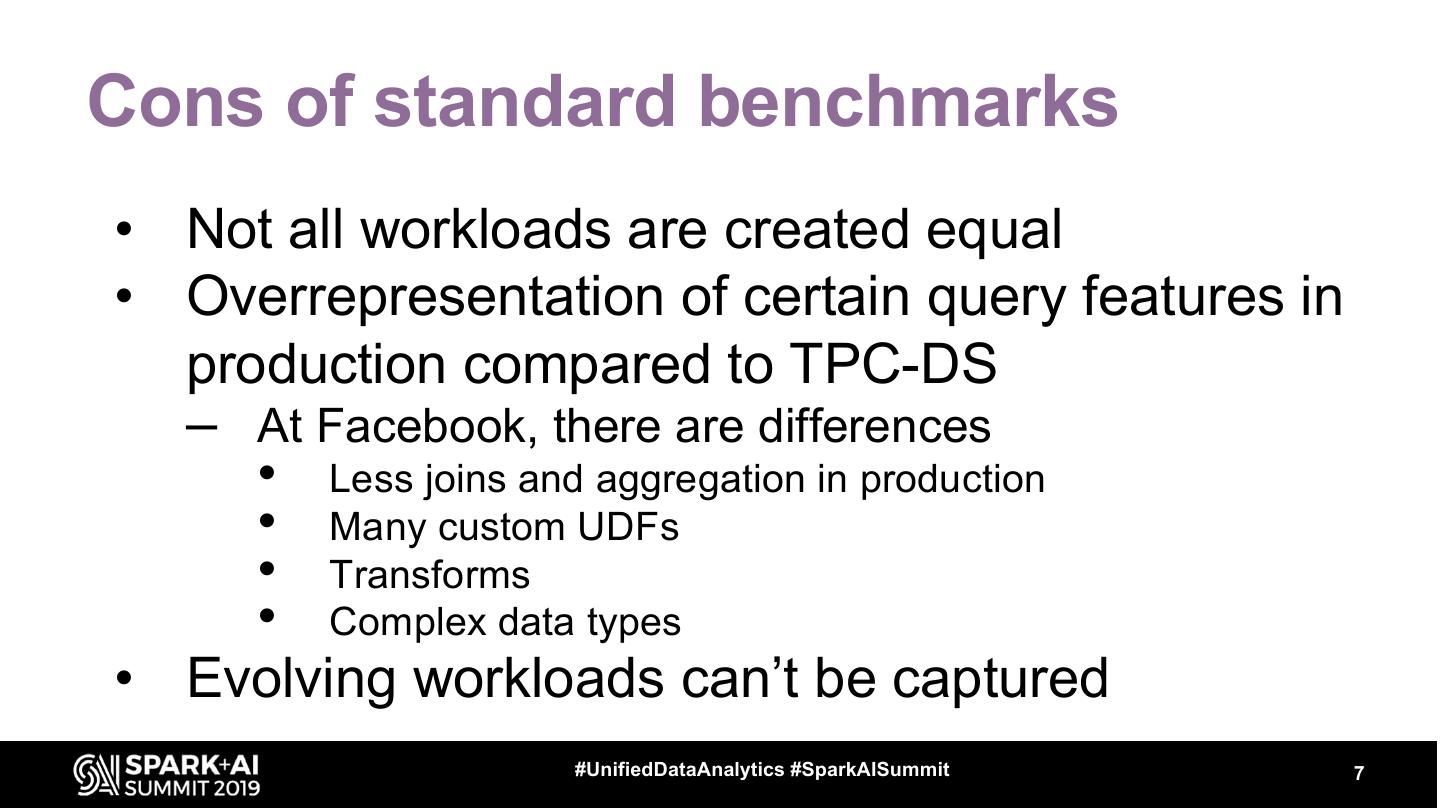
7 .Cons of standard benchmarks • Not all workloads are created equal • Overrepresentation of certain query features in production compared to TPC-DS – At Facebook, there are differences • Less joins and aggregation in production • Many custom UDFs • Transforms • Complex data types • Evolving workloads can’t be captured #UnifiedDataAnalytics #SparkAISummit 7
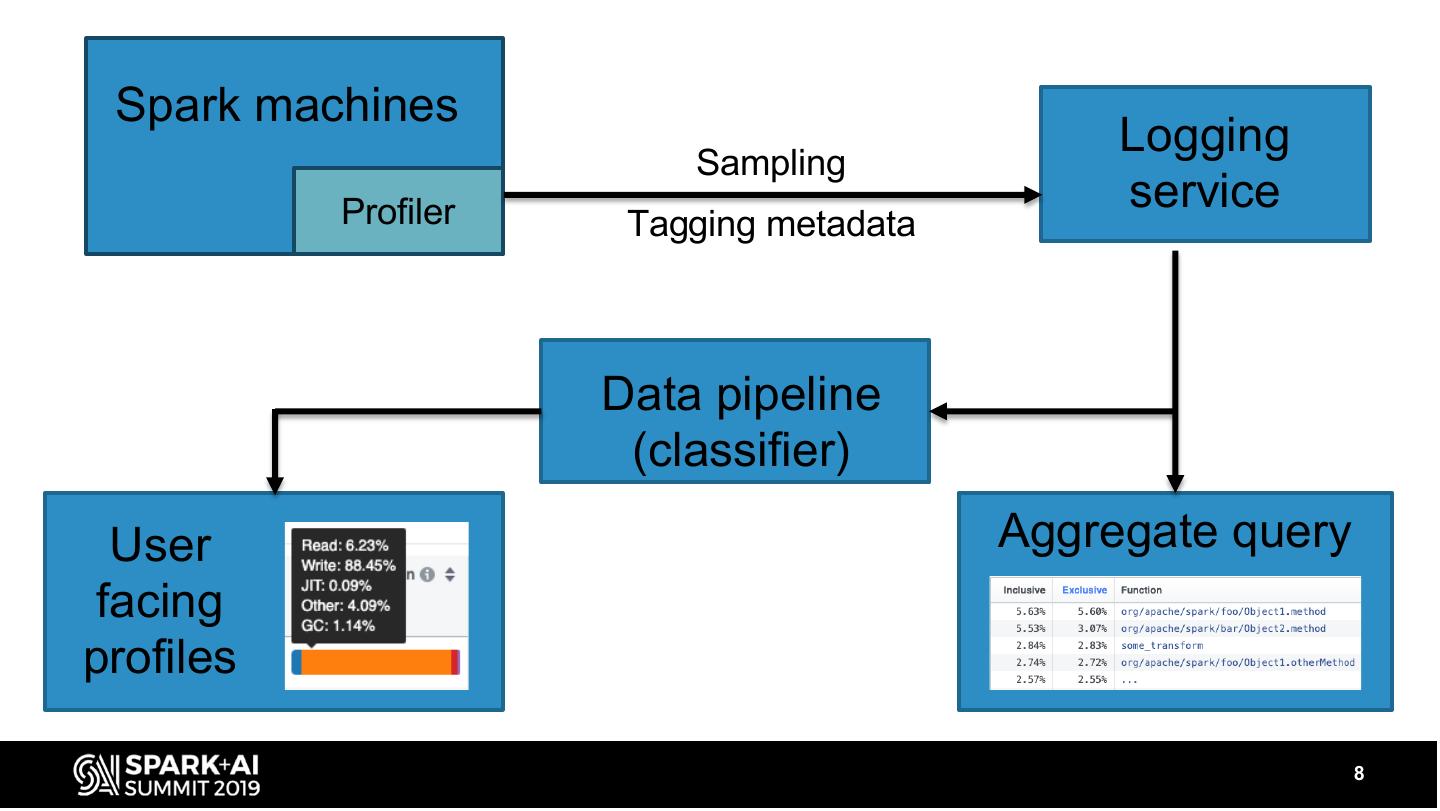
8 . Spark machines Sampling Logging Profiler service Tagging metadata Data pipeline (classifier) User Aggregate query facing profiles 8
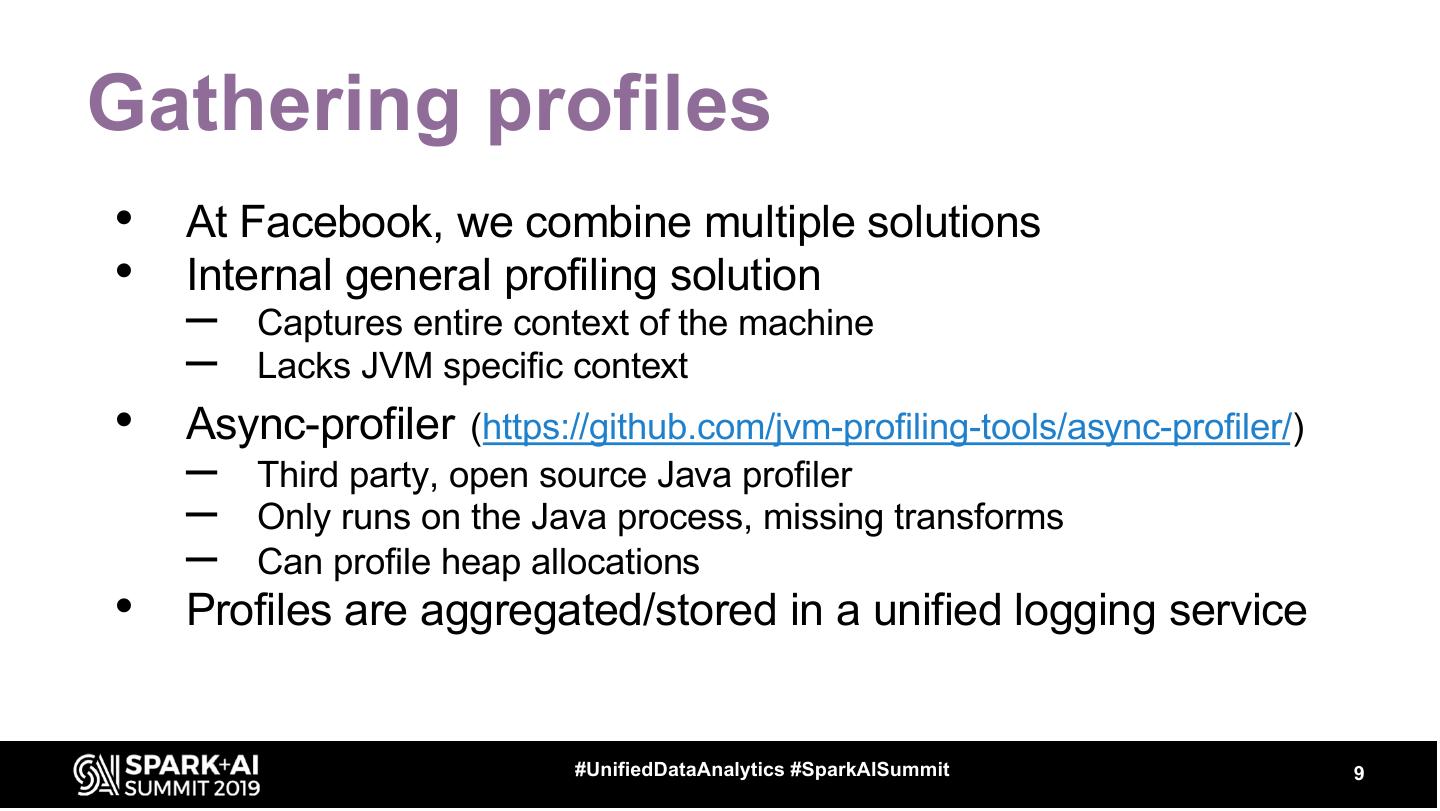
9 .Gathering profiles • At Facebook, we combine multiple solutions • Internal general profiling solution – Captures entire context of the machine – Lacks JVM specific context • Async-profiler (https://github.com/jvm-profiling-tools/async-profiler/) – Third party, open source Java profiler – Only runs on the Java process, missing transforms – Can profile heap allocations • Profiles are aggregated/stored in a unified logging service #UnifiedDataAnalytics #SparkAISummit 9
10 .Interpreting the profiles - GraphProfiler #UnifiedDataAnalytics #SparkAISummit 10
11 .Interpreting the profiles - GraphProfiler #UnifiedDataAnalytics #SparkAISummit 11
12 .Interpreting the profiles - Icicle Chart #UnifiedDataAnalytics #SparkAISummit 12
13 .Interpreting the profiles - Table/Group by #UnifiedDataAnalytics #SparkAISummit 13
14 .Interpreting the profiles - Time Series #UnifiedDataAnalytics #SparkAISummit 14
15 .Putting it all together • These views work well in tandem #UnifiedDataAnalytics #SparkAISummit 15
16 .DON’T FORGET TO RATE AND REVIEW THE SESSIONS SEARCH SPARK + AI SUMMIT


