- 快召唤伙伴们来围观吧
- 微博 QQ QQ空间 贴吧
- 视频嵌入链接 文档嵌入链接
- 复制
- 微信扫一扫分享
- 已成功复制到剪贴板


Performance Troubleshooting Using Apache Spark Metrics
Performance troubleshooting of distributed data processing systems is a complex task. Apache Spark comes to rescue with a large set of metrics and instrumentation that you can use to understand and improve the performance of your Spark-based applications. You will learn about the available metric-based instrumentation in Apache Spark: executor task metrics and the Dropwizard-based metrics system. The talk will cover how Hadoop and Spark service at CERN is using Apache Spark metrics for troubleshooting performance and measuring production workloads. Notably, the talk will cover how to deploy a performance dashboard for Spark workloads and will cover the use of sparkMeasure, a tool based on the Spark Listener interface. The speaker will discuss the lessons learned so far and what improvements you can expect in this area in Apache Spark 3.0.
展开查看详情
1 .WIFI SSID:Spark+AISummit | Password: UnifiedDataAnalytics
2 .Performance Troubleshooting Using Apache Spark Metrics Luca Canali, CERN #UnifiedDataAnalytics #SparkAISummit
3 .About Luca • Data Engineer at CERN – Hadoop and Spark service, database services – 19+ years of experience with data engineering • Sharing and community – Blog, notes, tools, contributions to Apache Spark @LucaCanaliDB – http://cern.ch/canali #UnifiedDataAnalytics #SparkAISummit 3
4 .CERN: founded in 1954: 12 European States Science for Peace and Development Today: 23 Member States ~ 2600 staff ~ 1800 other paid personnel ~ 14000 scientific users Budget (2019) ~ 1200 MCHF Member States: Austria, Belgium, Bulgaria, Czech Republic, Denmark, Finland, France, Germany, Greece, Hungary, Israel, Italy, Netherlands, Norway, Poland, Portugal, Romania, Serbia, Slovak Republic, Spain, Sweden, Switzerland and United Kingdom Associate Members in the Pre-Stage to Membership: Cyprus, Slovenia Associate Member States: India, Lithuania, Pakistan, Turkey, Ukraine Applications for Membership or Associate Membership: Brazil, Croatia, Estonia Observers to Council: Japan, Russia, United States of America; European Union, JINR and UNESCO 4
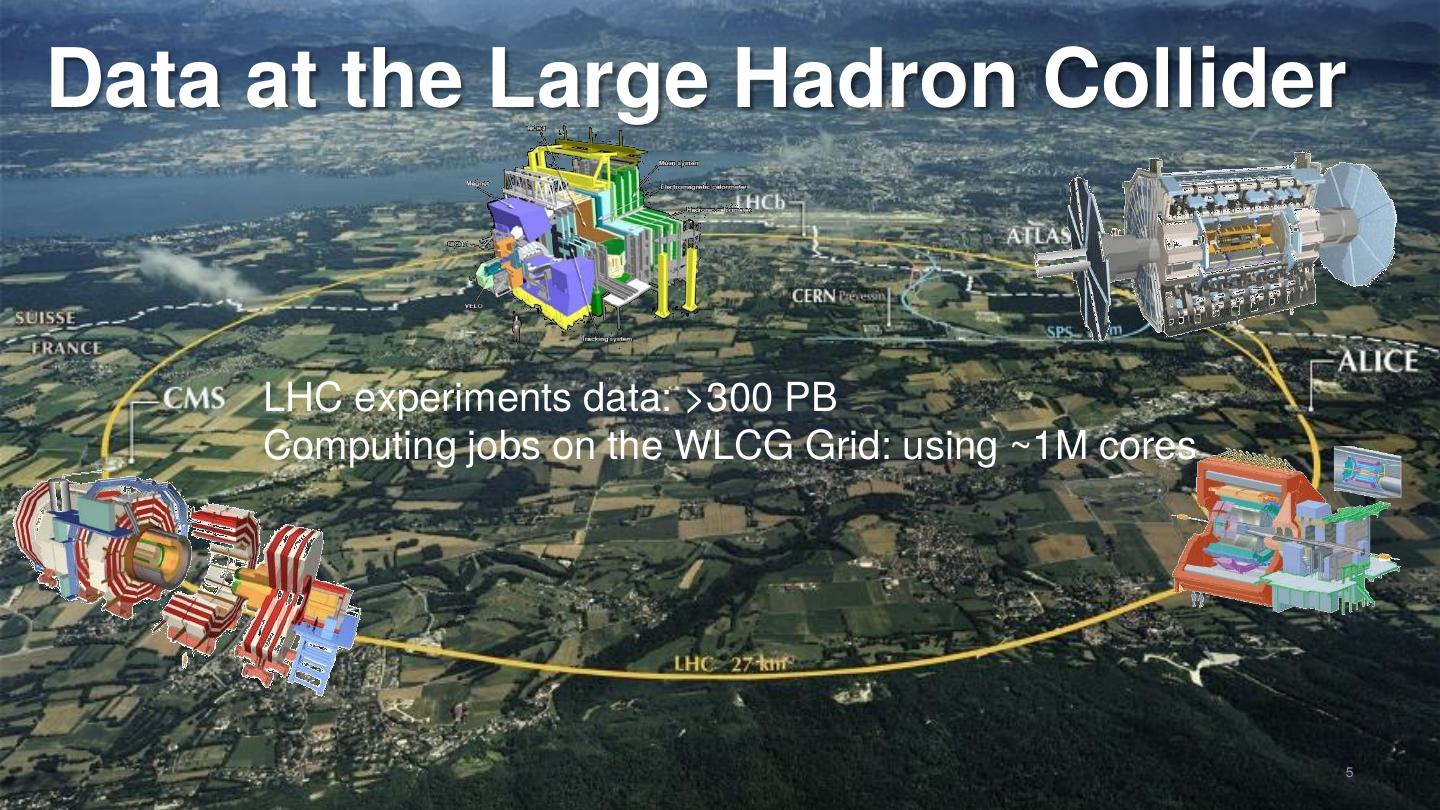
5 .Data at the Large Hadron Collider LHC experiments data: >300 PB Computing jobs on the WLCG Grid: using ~1M cores 5
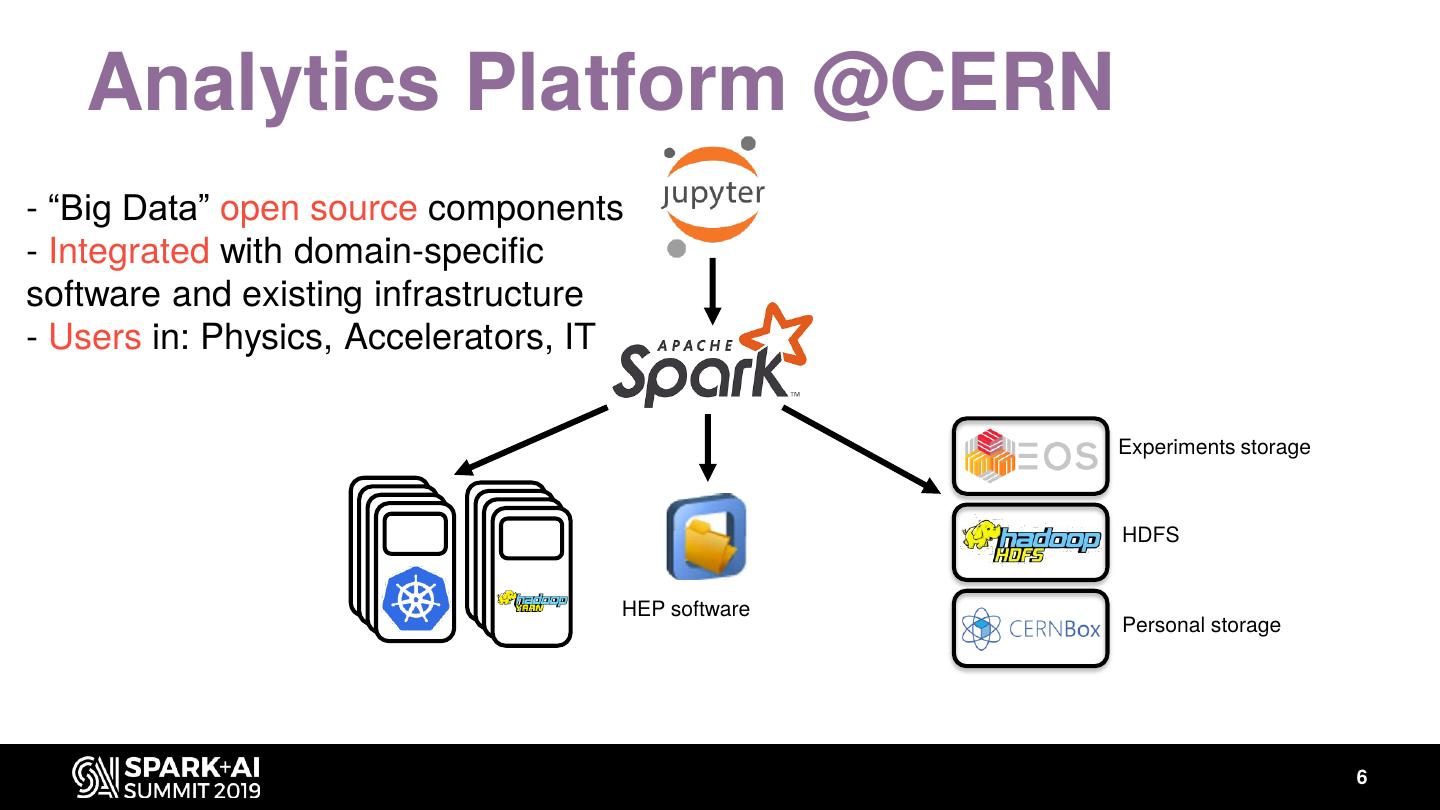
6 . Analytics Platform @CERN - “Big Data” open source components - Integrated with domain-specific software and existing infrastructure - Users in: Physics, Accelerators, IT Experiments storage HDFS HEP software Personal storage 6
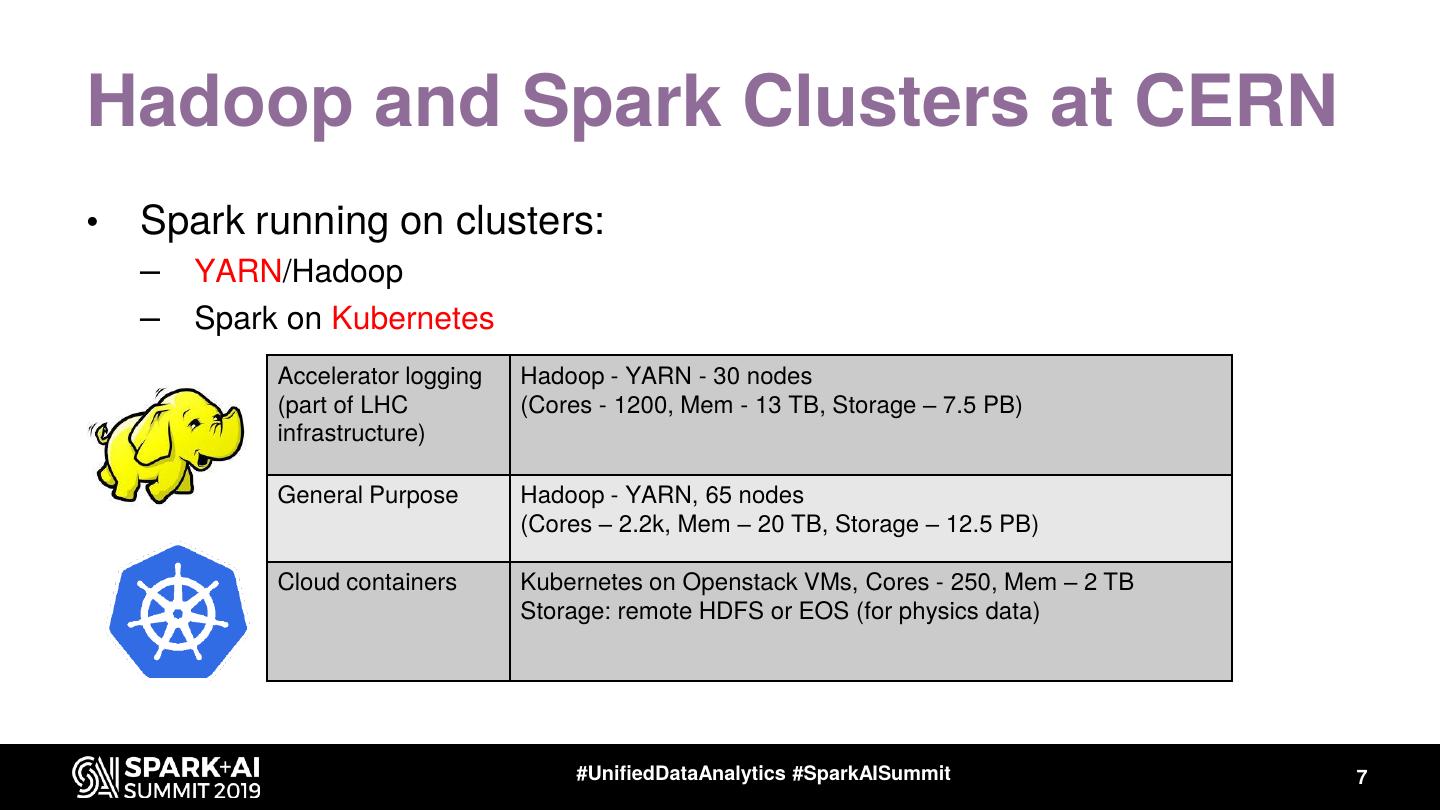
7 .Hadoop and Spark Clusters at CERN • Spark running on clusters: – YARN/Hadoop – Spark on Kubernetes Accelerator logging Hadoop - YARN - 30 nodes (part of LHC (Cores - 1200, Mem - 13 TB, Storage – 7.5 PB) infrastructure) General Purpose Hadoop - YARN, 65 nodes (Cores – 2.2k, Mem – 20 TB, Storage – 12.5 PB) Cloud containers Kubernetes on Openstack VMs, Cores - 250, Mem – 2 TB Storage: remote HDFS or EOS (for physics data) #UnifiedDataAnalytics #SparkAISummit 7
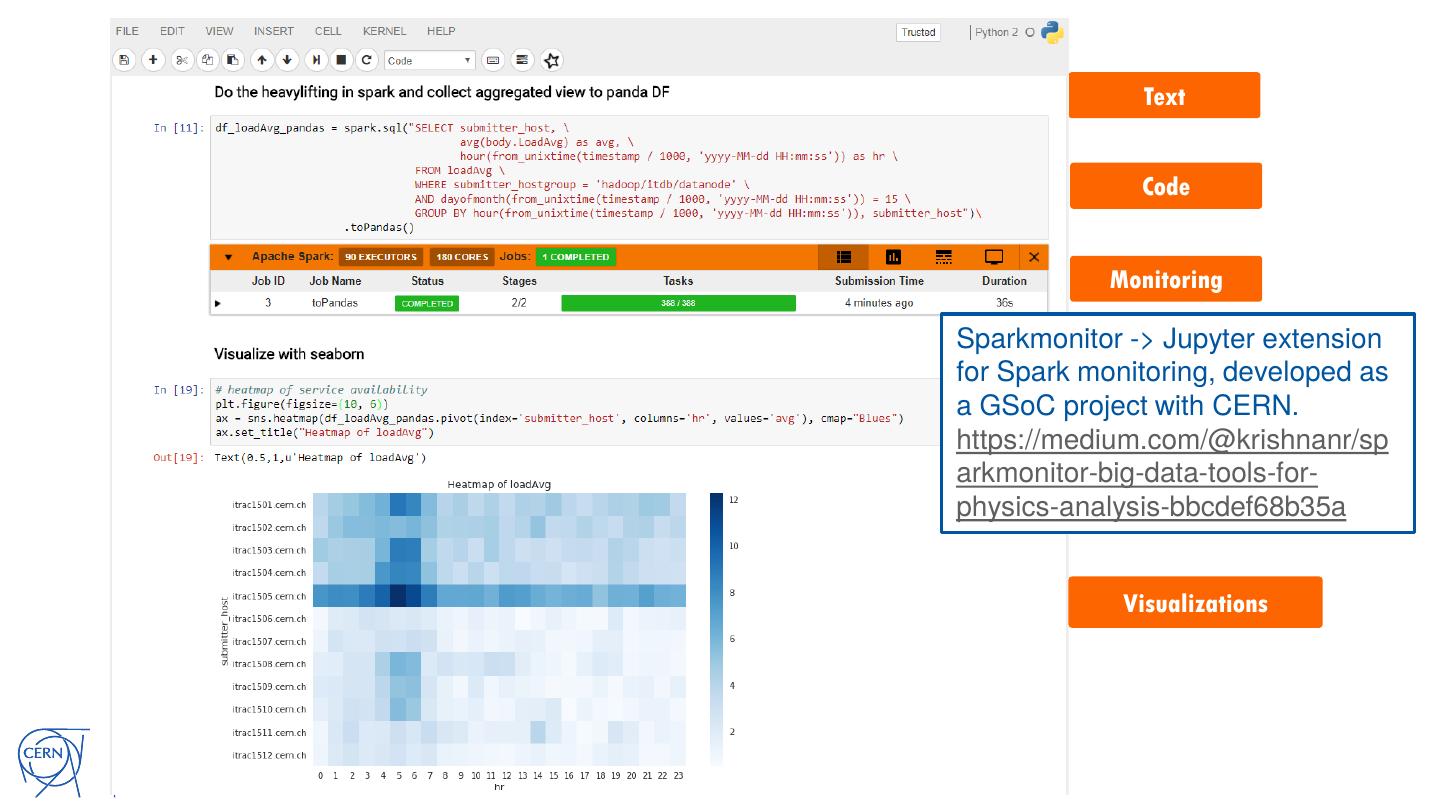
8 . Text Code Monitoring Sparkmonitor -> Jupyter extension for Spark monitoring, developed as a GSoC project with CERN. https://medium.com/@krishnanr/sp arkmonitor-big-data-tools-for- physics-analysis-bbcdef68b35a Visualizations
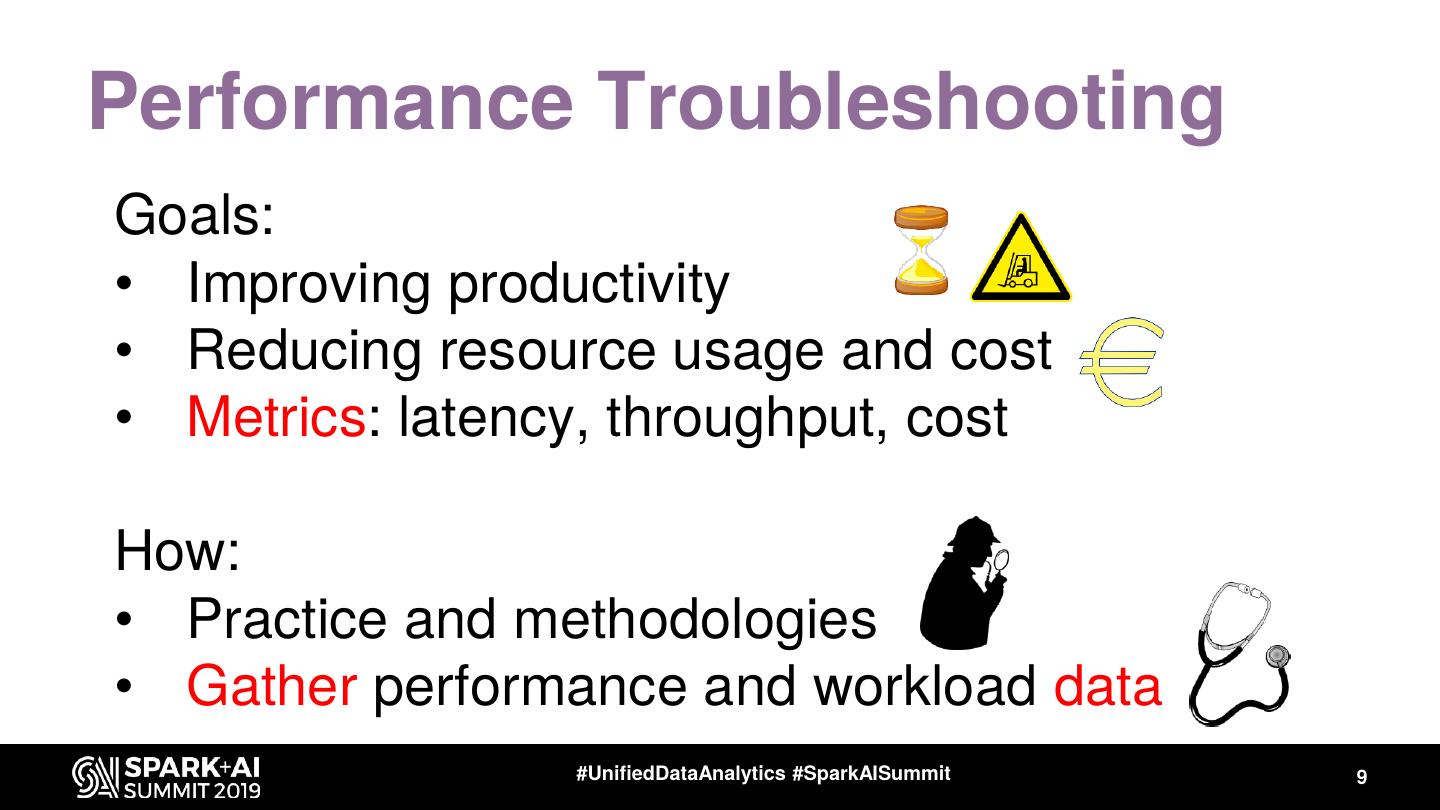
9 .Performance Troubleshooting Goals: • Improving productivity • Reducing resource usage and cost • Metrics: latency, throughput, cost How: • Practice and methodologies • Gather performance and workload data #UnifiedDataAnalytics #SparkAISummit 9
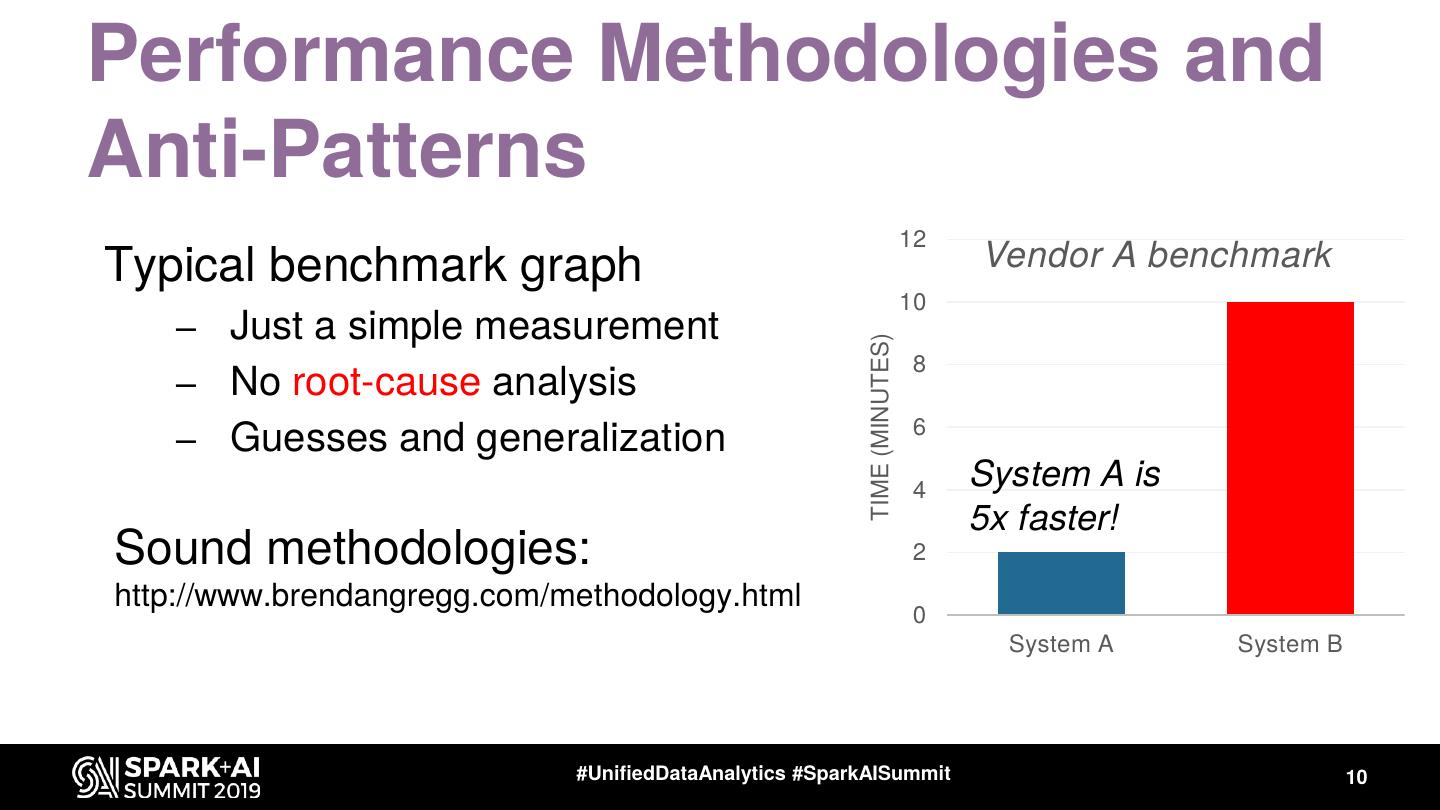
10 .Performance Methodologies and Anti-Patterns 12 Typical benchmark graph Vendor A benchmark 10 – Just a simple measurement TIME (MINUTES) 8 – No root-cause analysis 6 – Guesses and generalization 4 System A is 5x faster! Sound methodologies: 2 http://www.brendangregg.com/methodology.html 0 System A System B #UnifiedDataAnalytics #SparkAISummit 10
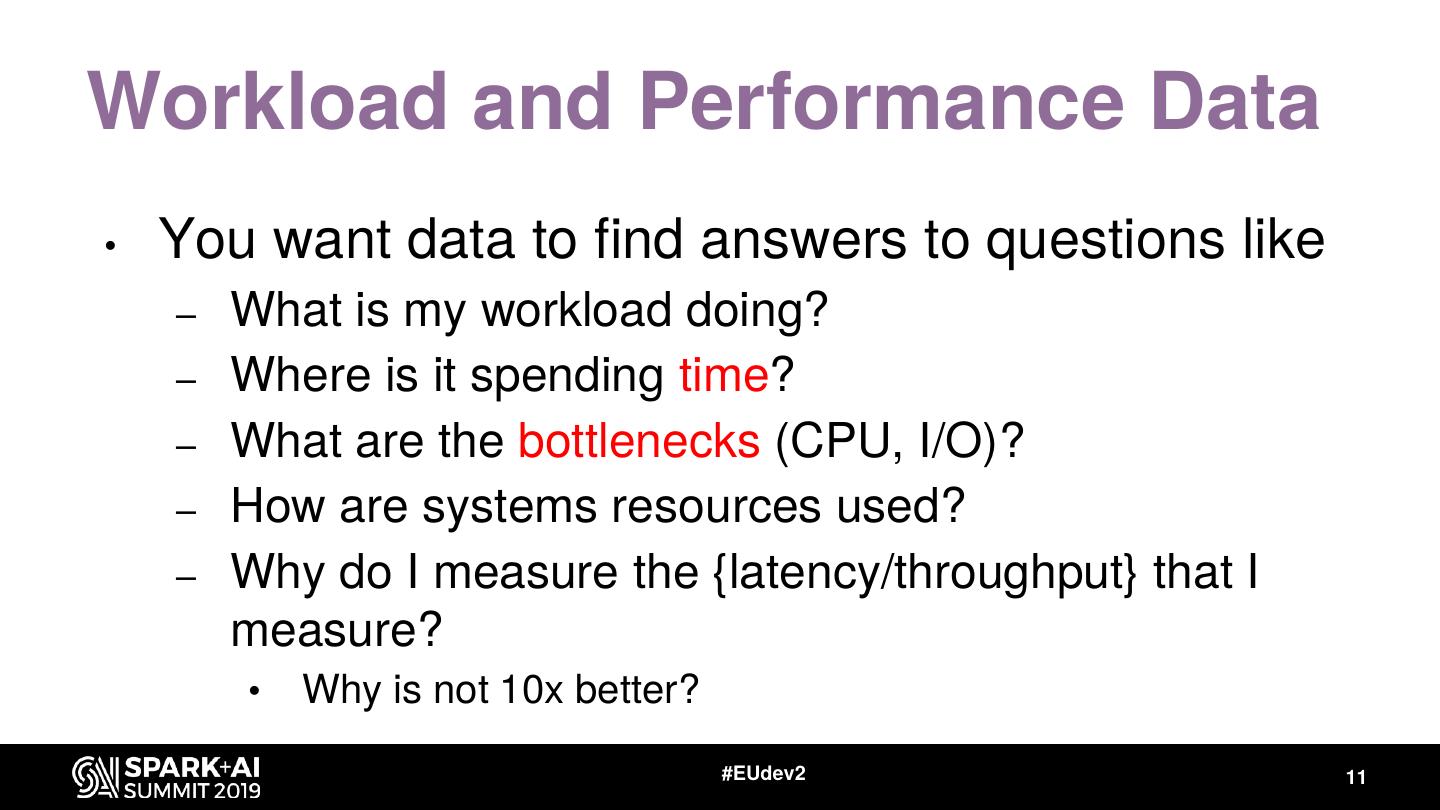
11 .Workload and Performance Data • You want data to find answers to questions like – What is my workload doing? – Where is it spending time? – What are the bottlenecks (CPU, I/O)? – How are systems resources used? – Why do I measure the {latency/throughput} that I measure? • Why is not 10x better? #EUdev2 11
12 .Data + Context => Insights Workload monitoring data + Spark architecture knowledge Info on application architecture Application Agent takes produces: insights + actions Info on computing environment #UnifiedDataAnalytics #SparkAISummit 12
13 .Measuring Spark • Distributed system, parallel architecture – Many components, complexity increases when running at scale – Execution hierarchy: SQL -> Jobs -> Stages -> Tasks – Interaction with clusters and storage #UnifiedDataAnalytics #SparkAISummit 13
14 .Spark Instrumentation - WebUI WebUI and History server: standard instrumentation • Details on jobs, stages, tasks • Default: http://driver_host:4040 • Details on SQL execution and execution plans • https://github.com/apache/spark/blob/master/docs/web-ui.md #UnifiedDataAnalytics #SparkAISummit 14
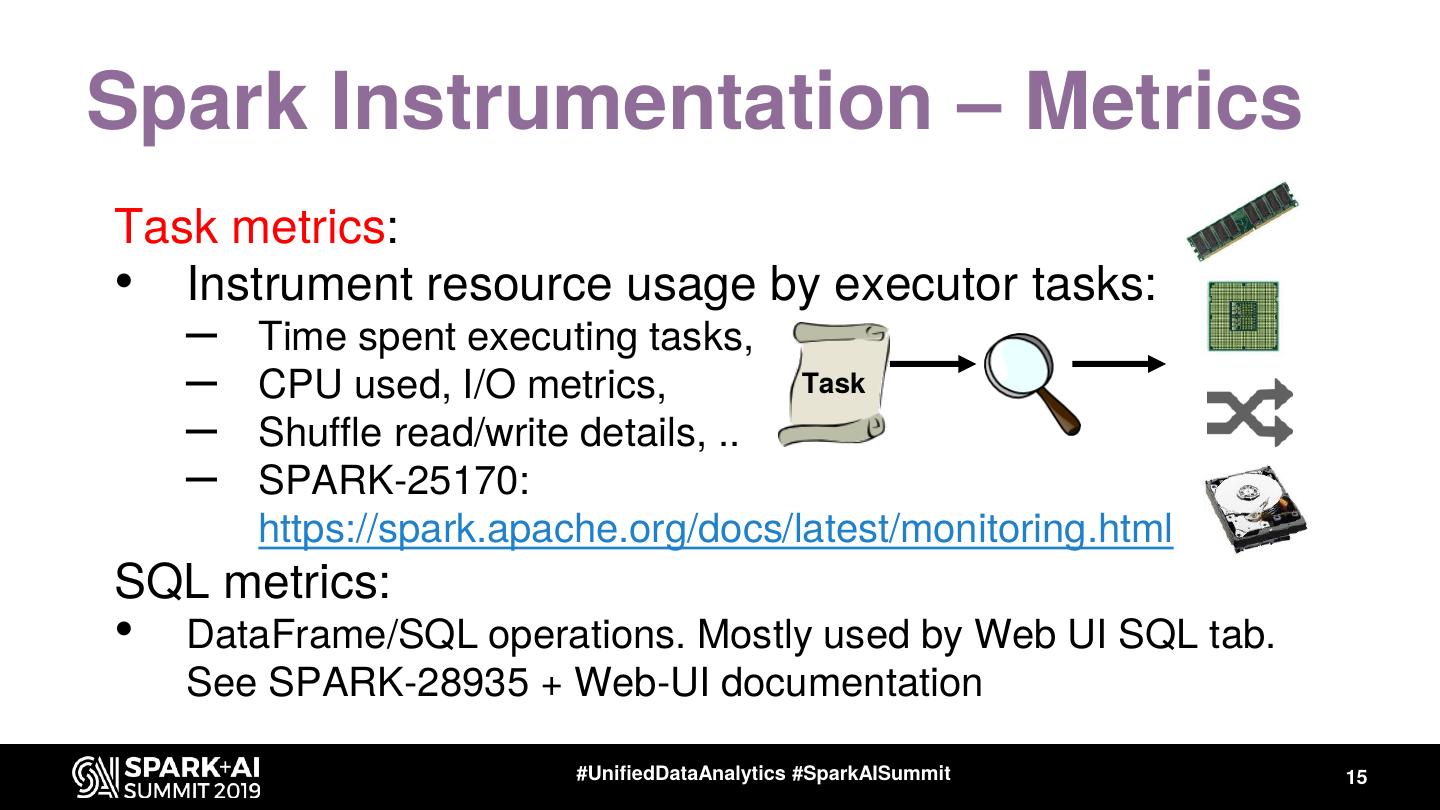
15 .Spark Instrumentation – Metrics Task metrics: • Instrument resource usage by executor tasks: – Time spent executing tasks, – CPU used, I/O metrics, Task – Shuffle read/write details, .. – SPARK-25170: https://spark.apache.org/docs/latest/monitoring.html SQL metrics: • DataFrame/SQL operations. Mostly used by Web UI SQL tab. See SPARK-28935 + Web-UI documentation #UnifiedDataAnalytics #SparkAISummit 15
16 .How to Gather Spark Task Metrics • Web UI exposes REST API Example: http://localhost:4040/api/v1/applications History server reads from Event Log (JSON file) – spark.eventLog.enabled=true – spark.eventLog.dir = <path> • Programmatic interface via “Spark Listeners” sparkMeasure -> a tool and working example code of how to collect metrics with Spark Listeners #UnifiedDataAnalytics #SparkAISummit 16
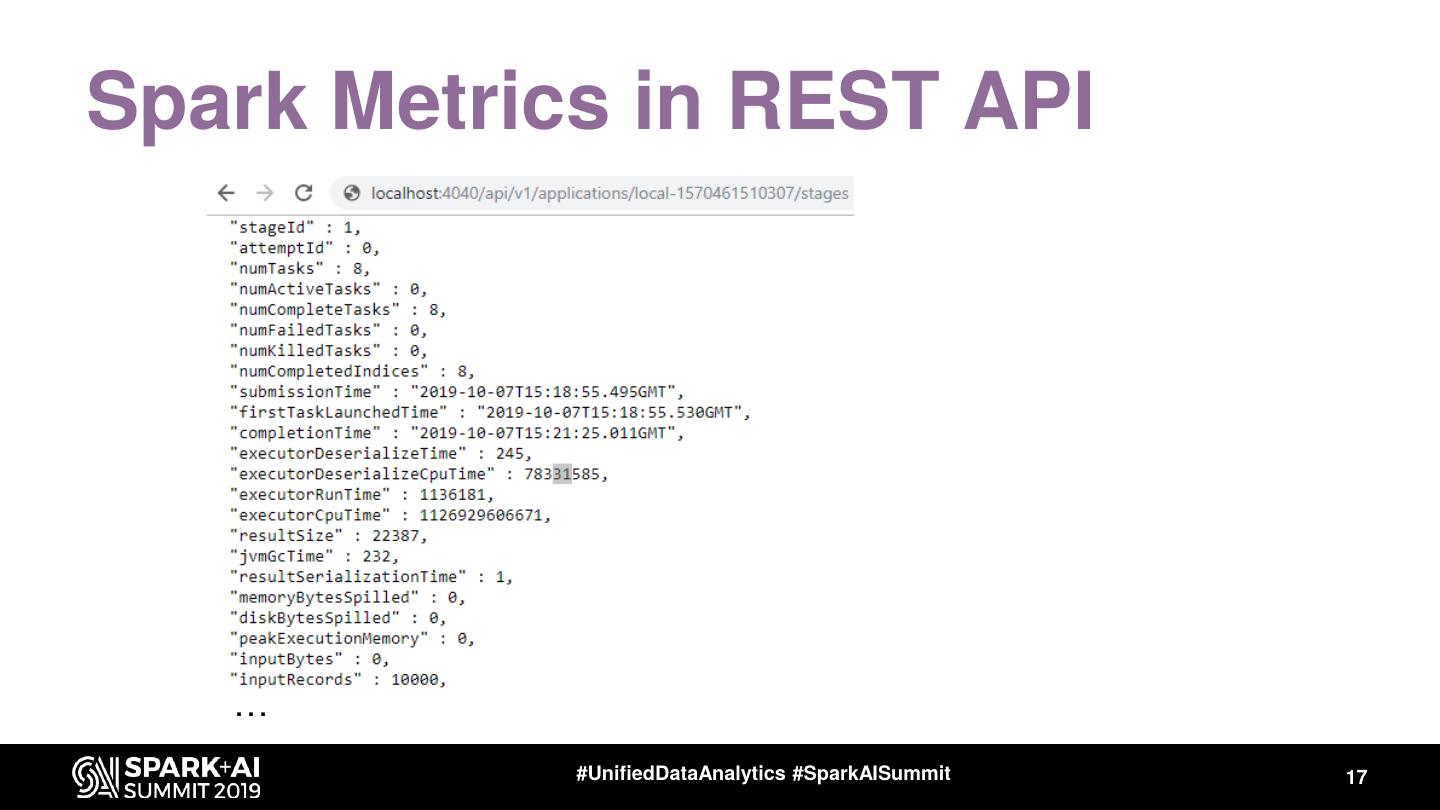
17 .Spark Metrics in REST API … #UnifiedDataAnalytics #SparkAISummit 17
18 .Task Metrics in the Event Log val df = spark.read.json("/var/log/spark-history/application_1567507314781_..") df.filter("Event='SparkListenerTaskEnd'").select("Task Metrics.*").printSchema |-- Disk Bytes Spilled: long (nullable = true) |-- Executor CPU Time: long (nullable = true) |-- Executor Deserialize CPU Time: long (nullable = true) |-- Executor Deserialize Time: long (nullable = true) |-- Executor Run Time: long (nullable = true) Spark Internal Task metrics: |-- Input Metrics: struct (nullable = true) | |-- Bytes Read: long (nullable = true) Provide info on executors’ activity: | |-- Records Read: long (nullable = true) |-- JVM GC Time: long (nullable = true) Run time, CPU time used, I/O metrics, JVM |-- Memory Bytes Spilled: long (nullable = true) |-- Output Metrics: struct (nullable = true) Garbage Collection, Shuffle activity, etc. | |-- Bytes Written: long (nullable = true) | |-- Records Written: long (nullable = true) |-- Result Serialization Time: long (nullable = true) |-- Result Size: long (nullable = true) |-- Shuffle Read Metrics: struct (nullable = true) | |-- Fetch Wait Time: long (nullable = true) | |-- Local Blocks Fetched: long (nullable = true) | |-- Local Bytes Read: long (nullable = true) | |-- Remote Blocks Fetched: long (nullable = true) | |-- Remote Bytes Read: long (nullable = true) | |-- Remote Bytes Read To Disk: long (nullable = true) | |-- Total Records Read: long (nullable = true) |-- Shuffle Write Metrics: struct (nullable = true) | |-- Shuffle Bytes Written: long (nullable = true) | |-- Shuffle Records Written: long (nullable = true) | |-- Shuffle Write Time: long (nullable = true) |-- Updated Blocks: array (nullable = true) | |-- element: string (containsNull = true) #UnifiedDataAnalytics #SparkAISummit 18
19 .Spark Listeners, @DeveloperApi • Custom class, extends SparkListener • Methods react on events to collect data, example: • Attach custom Lister class to Spark Session --conf spark.extraListeners=.. 19
20 .SparkMeasure Architecture #UnifiedDataAnalytics #SparkAISummit 20
21 .SparkMeasure – Getting Started • bin/spark-shell --packages ch.cern.sparkmeasure:spark- measure_2.11:0.15 • val stageMetrics = ch.cern.sparkmeasure.StageMetrics(spark) • • val myQuery = "select count(*) from range(1000) cross join range(1000) cross join range(1000)" • stageMetrics.runAndMeasure(spark.sql(myQuery).show()) #UnifiedDataAnalytics #SparkAISummit 21
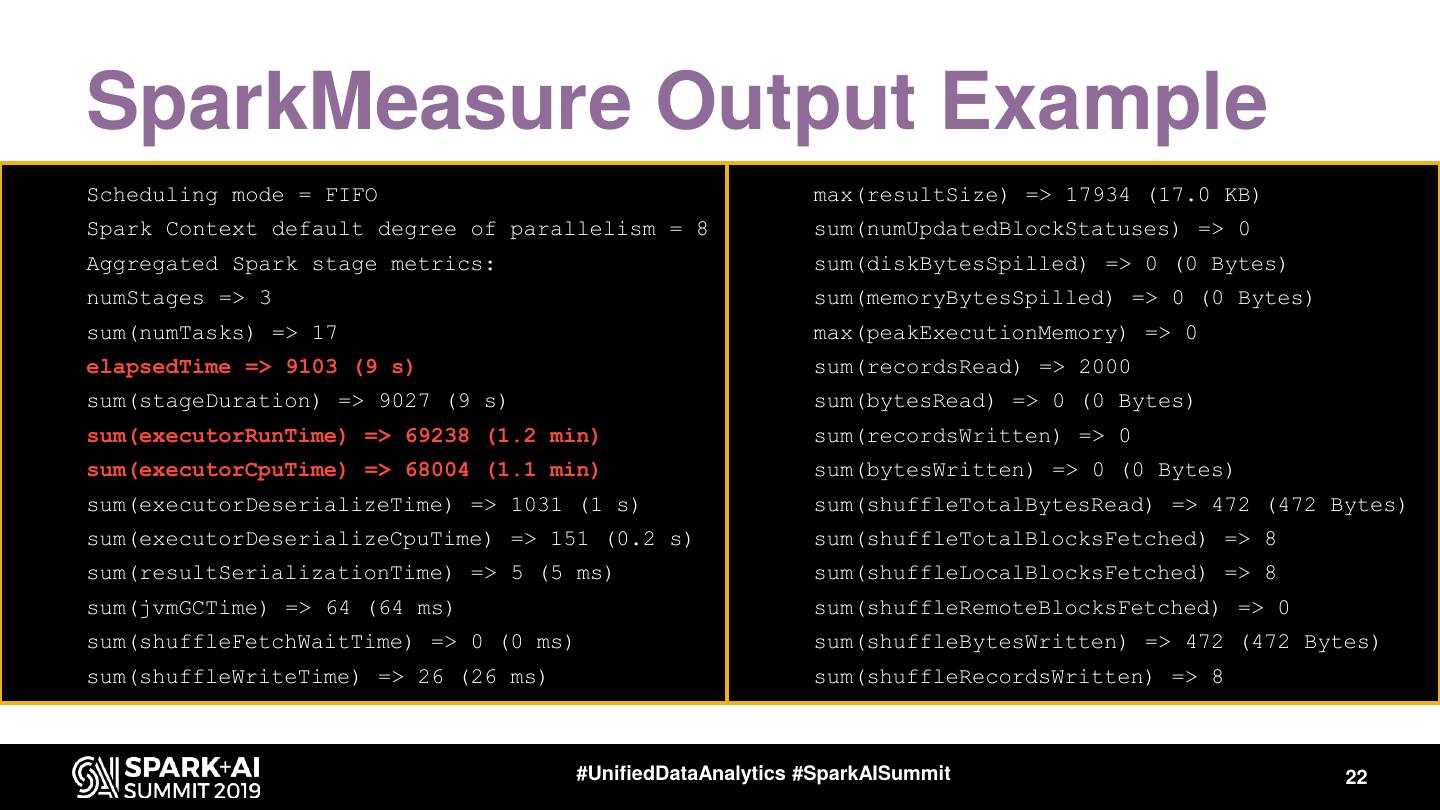
22 . SparkMeasure Output Example • Scheduling mode = FIFO • max(resultSize) => 17934 (17.0 KB) • Spark Context default degree of parallelism = 8 • sum(numUpdatedBlockStatuses) => 0 • Aggregated Spark stage metrics: • sum(diskBytesSpilled) => 0 (0 Bytes) • numStages => 3 • sum(memoryBytesSpilled) => 0 (0 Bytes) • sum(numTasks) => 17 • max(peakExecutionMemory) => 0 • elapsedTime => 9103 (9 s) • sum(recordsRead) => 2000 • sum(stageDuration) => 9027 (9 s) • sum(bytesRead) => 0 (0 Bytes) • sum(executorRunTime) => 69238 (1.2 min) • sum(recordsWritten) => 0 • sum(executorCpuTime) => 68004 (1.1 min) • sum(bytesWritten) => 0 (0 Bytes) • sum(executorDeserializeTime) => 1031 (1 s) • sum(shuffleTotalBytesRead) => 472 (472 Bytes) • sum(executorDeserializeCpuTime) => 151 (0.2 s) • sum(shuffleTotalBlocksFetched) => 8 • sum(resultSerializationTime) => 5 (5 ms) • sum(shuffleLocalBlocksFetched) => 8 • sum(jvmGCTime) => 64 (64 ms) • sum(shuffleRemoteBlocksFetched) => 0 • sum(shuffleFetchWaitTime) => 0 (0 ms) • sum(shuffleBytesWritten) => 472 (472 Bytes) • sum(shuffleWriteTime) => 26 (26 ms) • sum(shuffleRecordsWritten) => 8 #UnifiedDataAnalytics #SparkAISummit 22
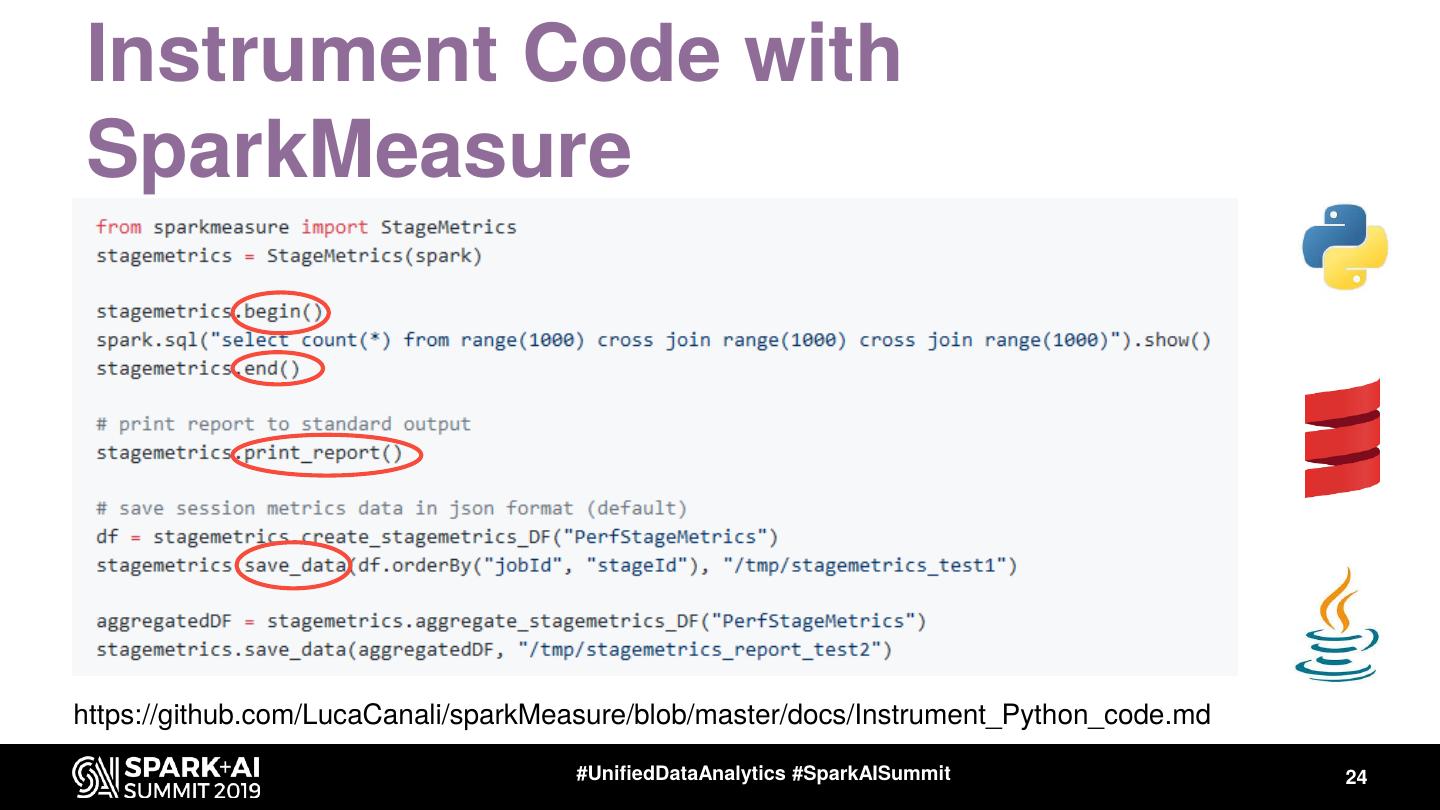
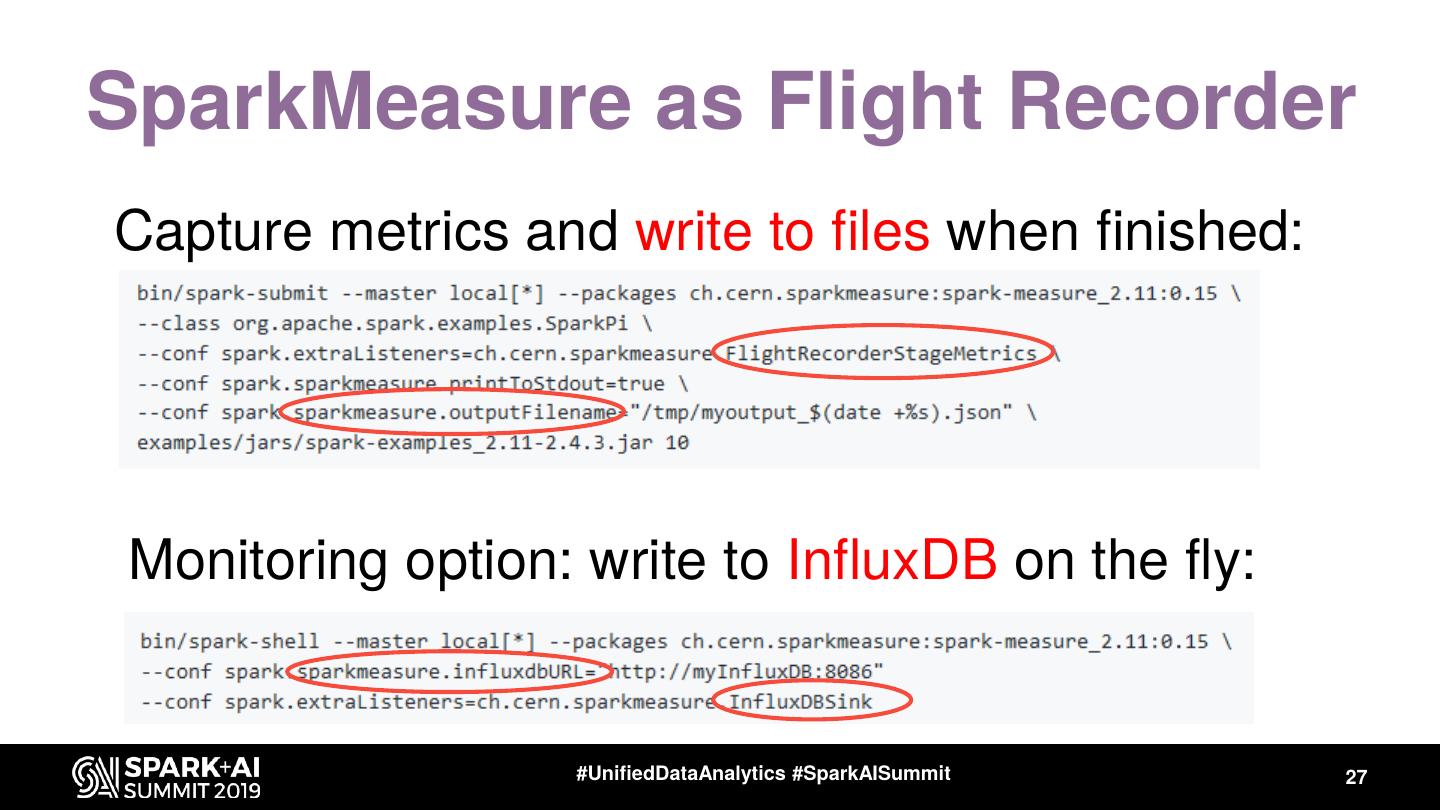
23 .SparkMeasure, Usage Modes • Interactive: use from shell or notebooks – Works with Jupyter notebooks, Azure, Colab, Databricks, etc. • Use to instrument your code • Flight recorder mode – No changes needed to the code – For Troubleshooting, for CI/CD pipelines, … • Use with Scala, Python, Java https://github.com/LucaCanali/sparkMeasure #UnifiedDataAnalytics #SparkAISummit 23
24 .Instrument Code with SparkMeasure https://github.com/LucaCanali/sparkMeasure/blob/master/docs/Instrument_Python_code.md #UnifiedDataAnalytics #SparkAISummit 24
25 .SparkMeasure on Notebooks: Local Jupyter and Cloud Services https://github.com/LucaCanali/sparkMeasure/tree/master/examples #UnifiedDataAnalytics #SparkAISummit 25
26 .SparkMeasure on Notebooks: Jupyter Magic: %%sparkmeasure … (note, output truncated to fit in slide #UnifiedDataAnalytics #SparkAISummit 26
27 .SparkMeasure as Flight Recorder Capture metrics and write to files when finished: Monitoring option: write to InfluxDB on the fly: #UnifiedDataAnalytics #SparkAISummit 27
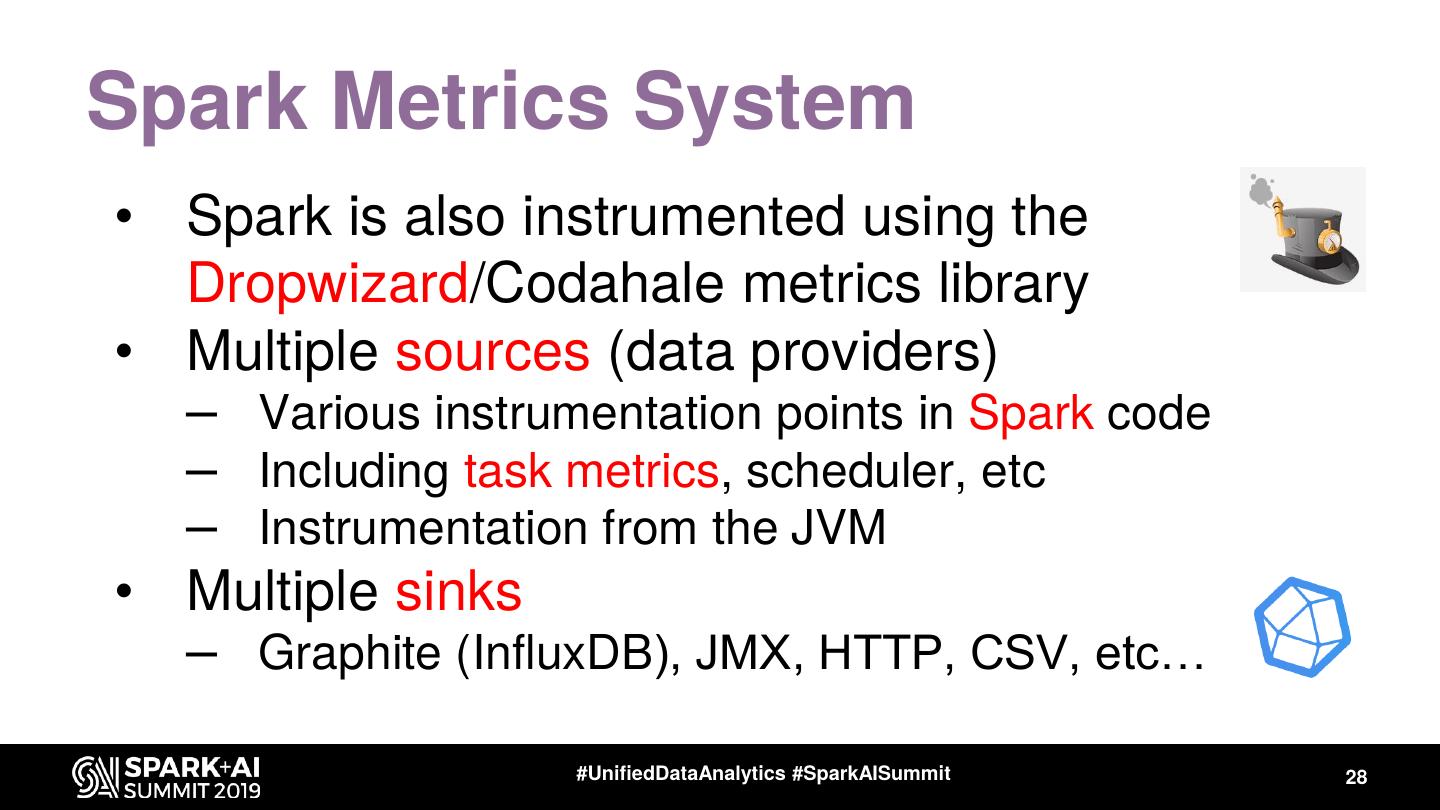
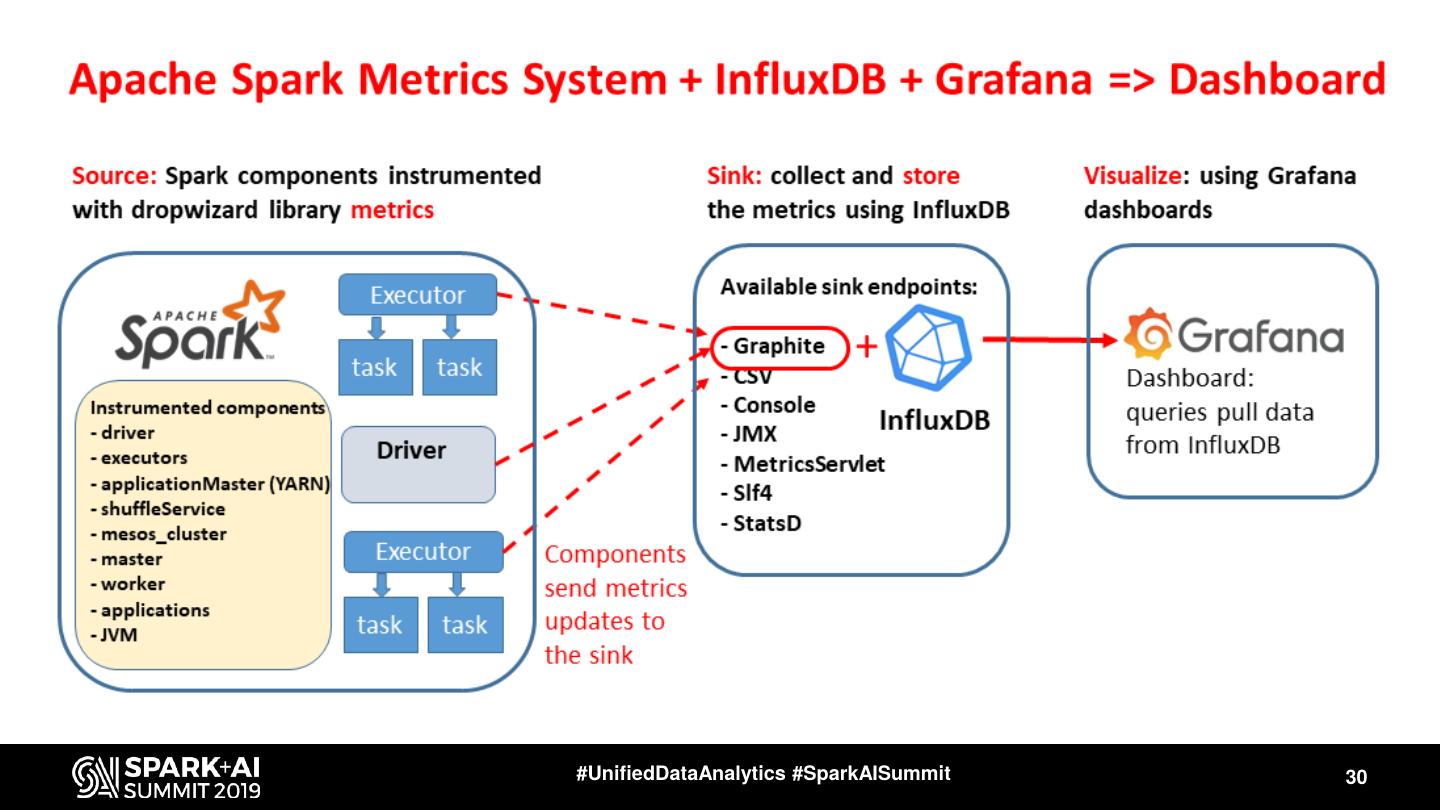
28 .Spark Metrics System • Spark is also instrumented using the Dropwizard/Codahale metrics library • Multiple sources (data providers) – Various instrumentation points in Spark code – Including task metrics, scheduler, etc – Instrumentation from the JVM • Multiple sinks – Graphite (InfluxDB), JMX, HTTP, CSV, etc… #UnifiedDataAnalytics #SparkAISummit 28
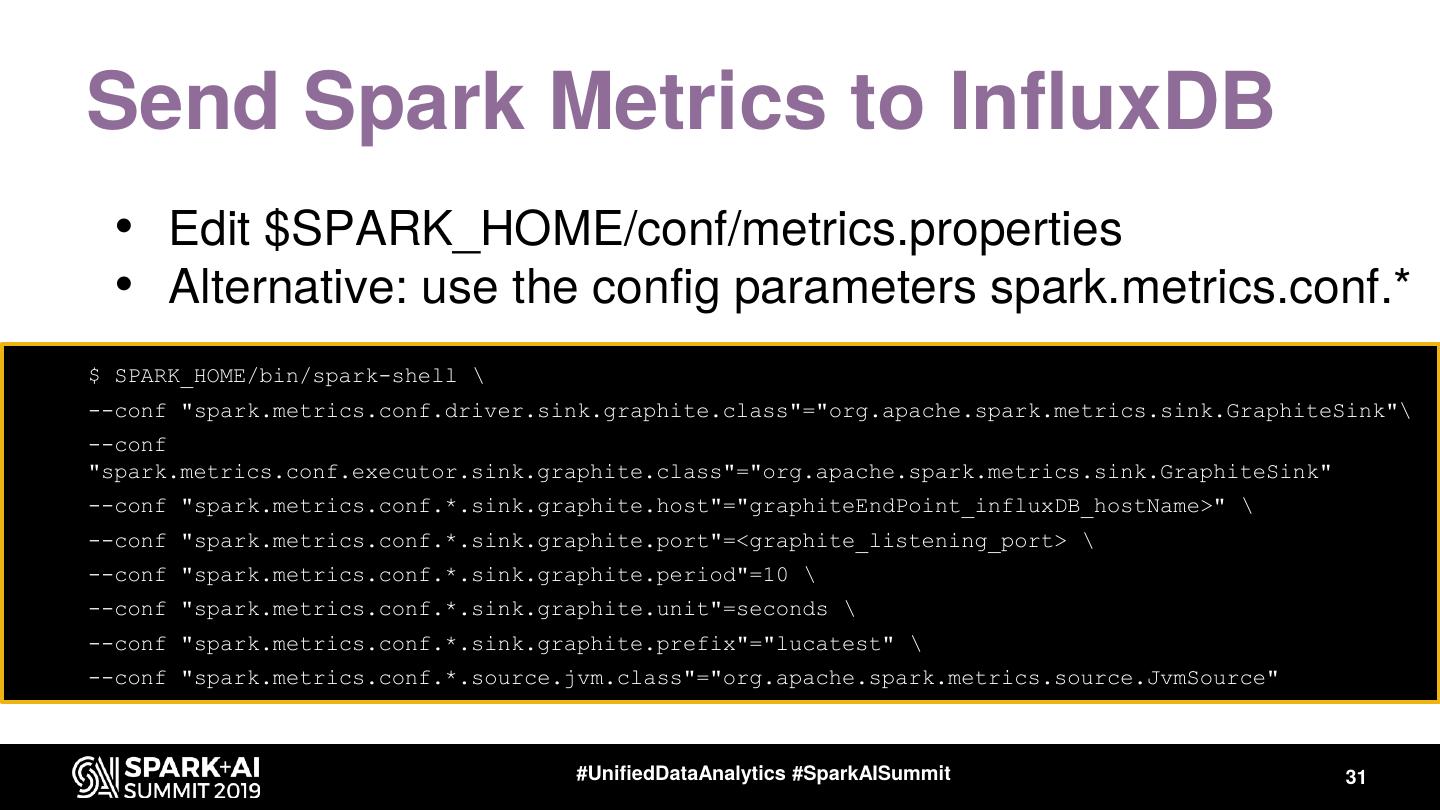
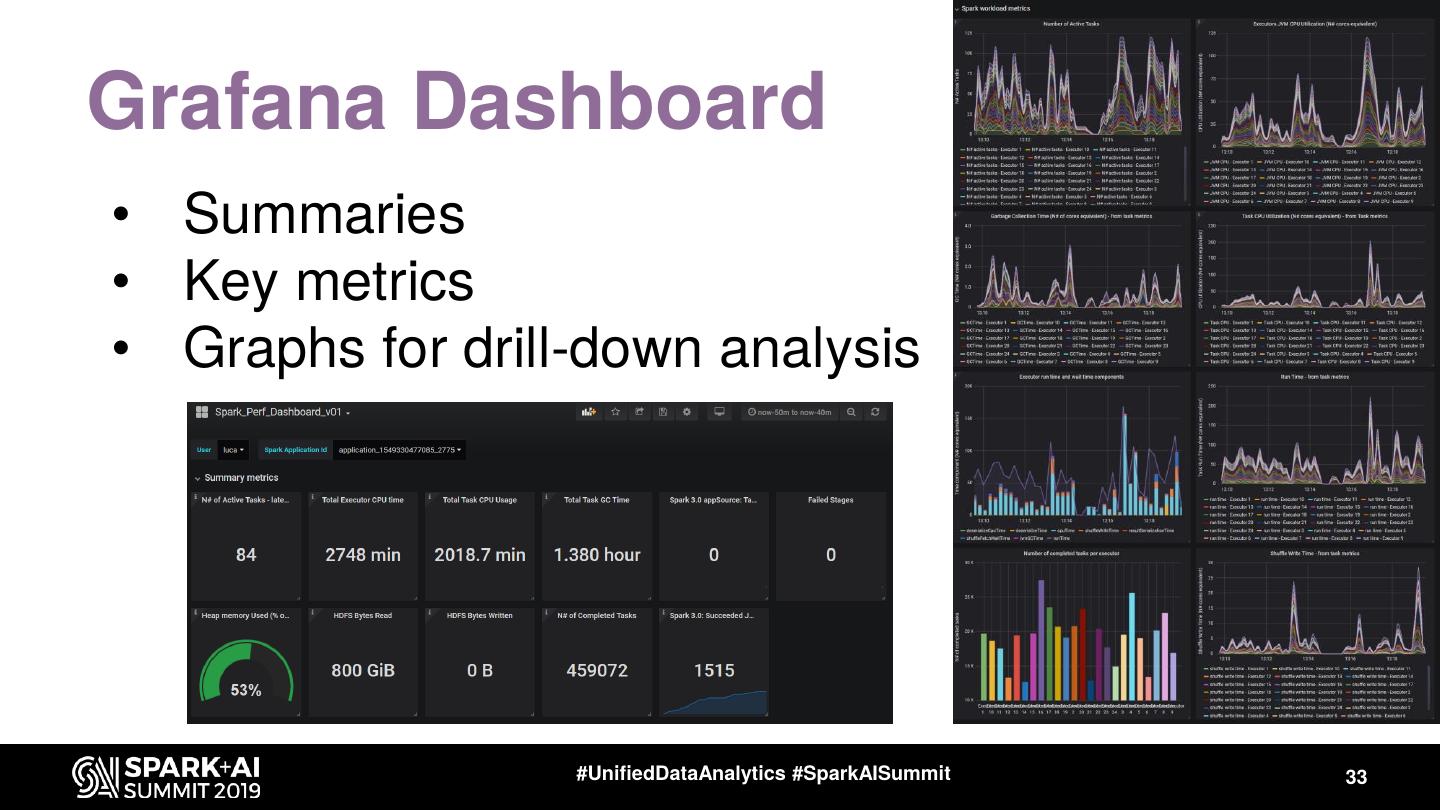
29 .Ingredients for a Spark Performance Dashboard • Architecture – Know how the “Dropwizard metrics system” works – Which Spark components are instrumented • Configure backend components – InfluxDB and Grafana • Relevant Spark configuration parameters • Dashboard graphs – familiarize with available metrics – InfluxDB query building for dashboard graphs #UnifiedDataAnalytics #SparkAISummit 29


