- 快召唤伙伴们来围观吧
- 微博 QQ QQ空间 贴吧
- 文档嵌入链接
- 复制
- 微信扫一扫分享
- 已成功复制到剪贴板
Running MongoDB in Production part 3
你是一个经验丰富的MySQL DBA,需要添加MongoDB到你的技能中吗?您是否习惯于管理一个运行良好的小环境,但想知道您可能还不知道的内容?
MongoDB工作得很好,但是当它有问题时,第一个问题是“我应该去哪里解决问题?”
本教程将涵盖:
-故障排除
-方案设计
-数据完整性
-缩放(读/写)
展开查看详情
1 .Running MongoDB in Production, Part III Tim Vaillancourt Sr Technical Operations Architect, Percona Speaker Name
2 .`whoami` { name: “tim”, lastname: “vaillancourt”, employer: “percona”, techs: [ “mongodb”, “mysql”, “cassandra”, “redis”, “rabbitmq”, “solr”, “mesos” “kafka”, “couch*”, “python”, “golang” ] }
3 .Agenda ● Troubleshooting ● Schema ● Data Integrity ● Scaling (Read/Writes)
4 . Troubleshooting “The problem with troubleshooting is trouble shoots back” ~ Unknown
5 .Troubleshooting: Usual Suspects ● Locking ○ Collection-level locks ○ Document-level locks ○ Software mutex/semaphore ● Limits ○ Max connections ○ Operation rate limits ○ Resource limits ● Resources ○ Lack of IOPS, RAM, CPU, network, etc
6 .Troubleshooting: db.currentOp() ● A function that dumps status info about running operations and various lock/execution details ● Only queries currently in progress are shown ● Provides Query ID number, used for killing ops ● Includes ○ Original Query ○ Parsed Query ○ Query Runtime ○ Locking details
7 .Troubleshooting: db.currentOp() ● Filter Documents ○ { "$ownOps": true } == Only show operations for the current user ○ https://docs.mongodb.com/manual/refe rence/method/db.currentOp/#examples
8 .Troubleshooting: db.currentOp()
9 .Troubleshooting: db.stats() ● db.stats() ● Returns ○ Document-data size (dataSize) ○ Index-data size (indexSize) ○ Real-storage size (storageSize) ○ Average Object Size ○ Number of Indexes ○ Number of Objects
10 .Troubleshooting: Log File ● Interesting details are logged to the mongod/mongos log files ○ Slow queries ○ Storage engine details (sometimes) ○ Index operations ○ Sharding ■ Chunk moves ○ Elections / Replication ○ Authentication
11 .Troubleshooting: Log File - Slow Query 2017-09-19T20:58:03.896+0200 I COMMAND [conn175] command config.locks appName: "MongoDB Shell" command: findAndModify { findAndModify: "locks", query: { ts: ObjectId('59c168239586572394ae37ba') }, update: { $set: { state: 0 } }, writeConcern: { w: "majority", wtimeout: 15000 }, maxTimeMS: 30000 } planSummary: IXSCAN { ts: 1 } update: { $set: { state: 0 } } keysExamined:1 docsExamined:1 nMatched:1 nModified:1 keysInserted:1 keysDeleted:1 numYields:0 reslen:604 locks:{ Global: { acquireCount: { r: 2, w: 2 } }, Database: { acquireCount: { w: 2 } }, Collection: { acquireCount: { w: 1 } }, Metadata: { acquireCount: { w: 1 } }, oplog: { acquireCount: { w: 1 } } } protocol:op_command 106ms
12 .Troubleshooting: Operation Profiler ● Writes slow database operations to a new MongoDB collection for analysis ○ Capped Collection “system.profile” in each database, default 1mb ○ The collection is capped, ie: profile data doesn’t last forever ● Support for operationProfiling data in Percona Monitoring and Management in current future goals
13 .Troubleshooting: Operation Profiler ● Enable operationProfiling in “slowOp” mode ○ Start with a very high threshold and decrease it in steps ○ Usually 50-100ms is a good threshold ○ Enable in mongod.conf operationProfiling: slowOpThresholdMs: 100 mode: slowOp
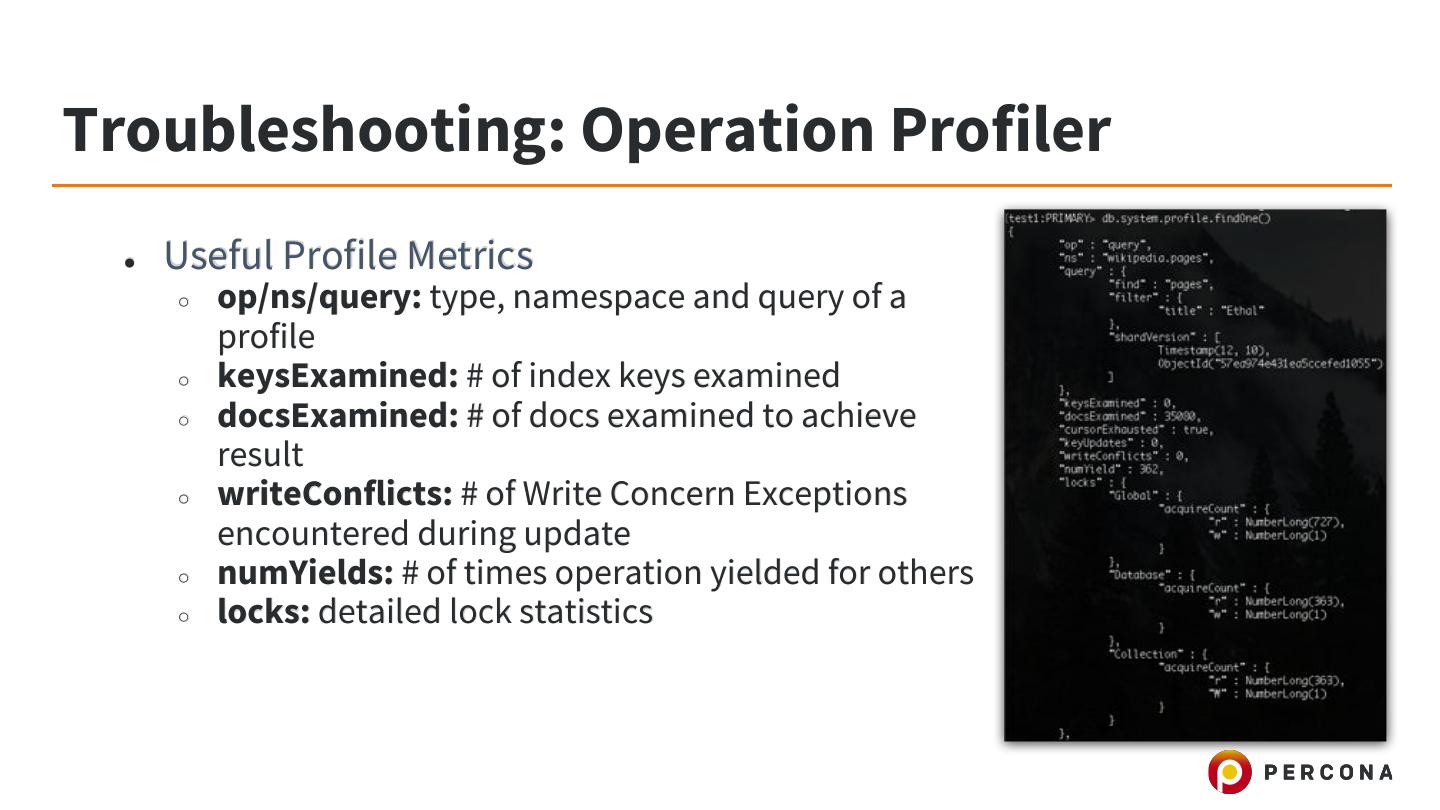
14 .Troubleshooting: Operation Profiler ● Useful Profile Metrics ○ op/ns/query: type, namespace and query of a profile ○ keysExamined: # of index keys examined ○ docsExamined: # of docs examined to achieve result ○ writeConflicts: # of Write Concern Exceptions encountered during update ○ numYields: # of times operation yielded for others ○ locks: detailed lock statistics
15 .Troubleshooting: .explain() ●Shows query explain plan for query cursors ● This will include ○ Winning Plan ■ Query stages ● Query stages may include sharding info in clusters ■ Index chosen by optimiser ○ Rejected Plans
16 .Troubleshooting: .explain() and Profiler
17 .Troubleshooting: PSMDB AuditLog ● Free, open-source PSMDB feature ○ MongoDB Enterprise feature ($$$) ● Provides ○ Authentication and authorization ○ Cluster operations ○ Read and write operations
18 .Troubleshooting: PSMDB AuditLog ● Provides ○ Schema operations ○ Custom application messages (if configured) ● Writes to BSON files on disk ○ Read data with ‘bsondump --pretty’ ○ Ensure directory NOT world-readable!
19 .Troubleshooting: Cluster Metadata ● The “config” database on Cluster Config servers ○ Use .find() queries to view Cluster Metadata ● Contains ○ changelog and actionlog (3.0+): Cluster Operations ○ databases: Sharding enabled databases ○ collections: Sharding enabled collections ○ shards: Cluster Shards ○ chunks: Chunk mapping/info ○ settings: Sharding settings
20 .Troubleshooting: Cluster Metadata ● Contains ○ mongos: All mongos processes (forever) ○ locks: Internal Cluster locks ○ lockpings
21 .Troubleshooting: Percona PMM QAN ● Allows DBAs and developers to: ○ Analyze queries over periods of time ○ Find performance problems ○ Access database performance data securely ● Agent collected from MongoDB Profiler (required) from agent ● Query Normalization ○ ie:“{ item: 123456 }” -> “{ item: ##### }”. ○ Good for reduced data exposure ● CLI alternative: pt-mongodb-query-digest tool
22 .Troubleshooting: Percona PMM QAN
23 .Troubleshooting: Other tools ● mlogfilter ○ A useful tool for processing mongod.log files ● pt-mongodb-summary ○ Great for a high-level view of a MongoDB environment ● pt-mongodb-query-digest ○ A command-line tool similar to PMM QAN (although much simpler)
24 .Schema Design & Workflow
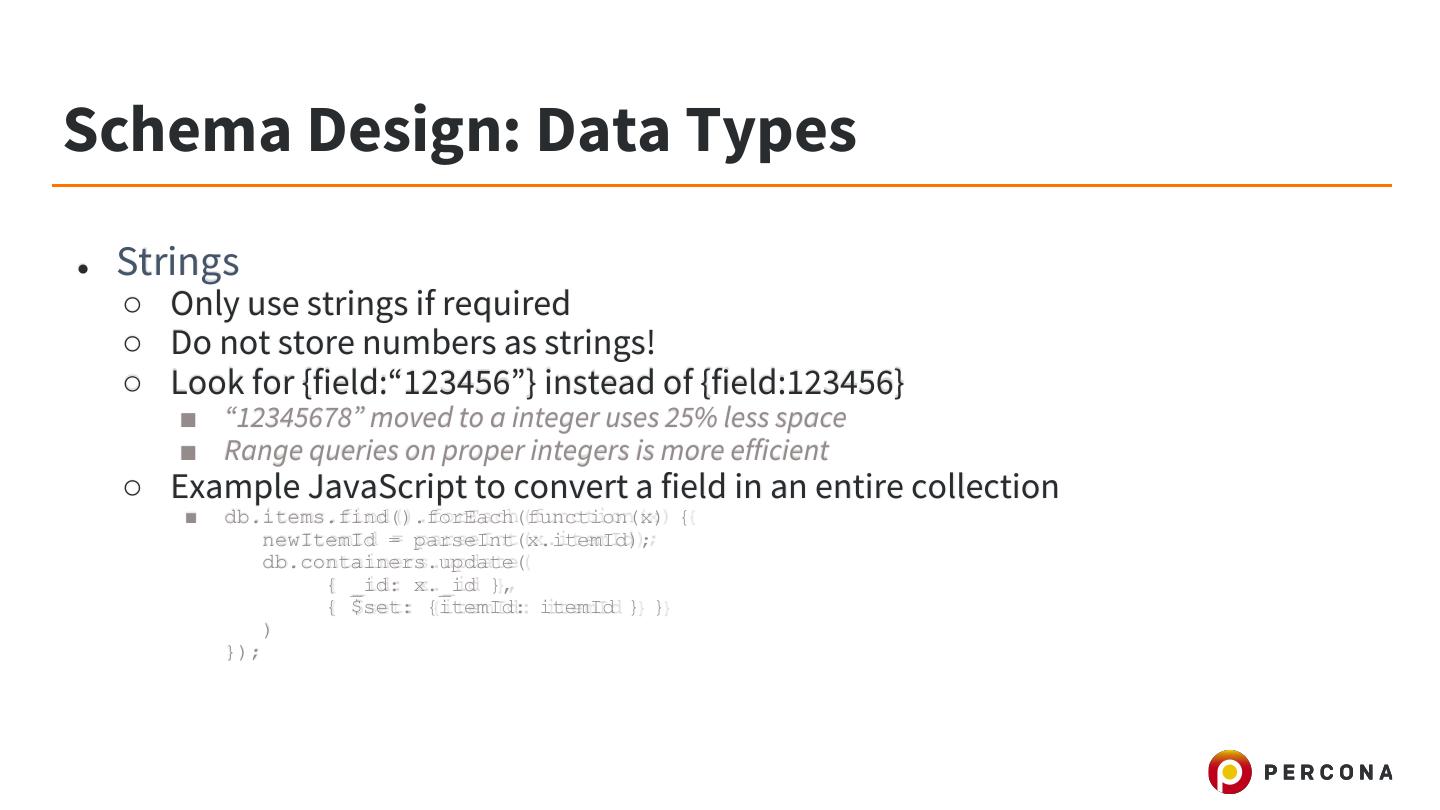
25 .Schema Design: Data Types ● Strings ○ Only use strings if required ○ Do not store numbers as strings! ○ Look for {field:“123456”} instead of {field:123456} ■ “12345678” moved to a integer uses 25% less space ■ Range queries on proper integers is more efficient ○ Example JavaScript to convert a field in an entire collection ■ db.items.find().forEach(function(x) { newItemId = parseInt(x.itemId); db.containers.update( { _id: x._id }, { $set: {itemId: itemId } } ) });
26 .Schema Design: Data Types ● Strings ○ Do not store dates as strings! ■ The field "2017-08-17 10:00:04 CEST" stores in 52.5% less space as a real date! ○ Do not store booleans as strings! ■ “true” -> true = 47% less space wasted ● DBRefs ○ DBRefs provide pointers to another document ○ DBRefs can be cross-collection ● NumberLong (3.4+) ○ Higher precision for floating-point numbers
27 .Schema Design: Indexes ● MongoDB supports BTree, text and geo indexes ○ Default behaviour ● Collection lock until indexing completes ● { background:true } ○ Runs indexing in the background avoiding pauses ○ Hard to monitor and troubleshoot progress ○ Unpredictable performance impact ○ Our suggestion: rollout indexes one node at a time ■ Disable replication and change TCP port, restart. ■ Apply index. ■ Enable replication, restore TCP port.
28 .Schema Design: Indexes ● Avoid drivers that auto-create indexes ○ Use real performance data to make indexing decisions, find out before Production! ● Too many indexes hurts write performance for an entire collection ● Indexes have a forward or backward direction ○ Try to cover .sort() with index and match direction!
29 .Schema Design: Indexes ● Compound Indexes ○ Several fields supported ○ Fields can be in forward or backward direction ■ Consider any .sort() query options and match sort direction! ○ Composite Keys are read Left -> Right! ■ Index can be partially-read ■ Left-most fields do not need to be duplicated! ■ All Indexes below are duplicates of the first index: ● {username: 1, status: 1, date: 1, count: -1} ● {username: 1, status: 1, data: 1 } ● {username: 1, status: 1 } ● {username: 1 } ● Use db.collection.getIndexes() to view current Indexes


