- 快召唤伙伴们来围观吧
- 微博 QQ QQ空间 贴吧
- 文档嵌入链接
- 复制
- 微信扫一扫分享
- 已成功复制到剪贴板
MySQL Performance Optimization with PMM
优化MySQL性能和解决MySQL问题是MySQL DBA最关键和最具挑战性的任务之一。为应用程序供电的数据库需要能够处理大量的流量负载,同时保持响应性和稳定性,以便提供出色的用户体验。此外,DBA还希望找到解决这些问题的经济高效的方法。
在本次网络研讨会中,Peter将讨论如何优化和解决MySQL性能问题,并演示Percona监控和管理(PMM)如何使您能够使用免费和开源软件解决这些难题。我们将查看特定的、常见的MySQL问题,并查看PMM中允许您诊断和解决这些问题的基本组件。
展开查看详情
1 .MySQL Performance Optimization and Troubleshooting with PMM Peter Zaitsev, CEO, Percona Percona Technical Webinars 9 May 2018
2 .Few words about Percona Monitoring and Management (PMM) 100% Free, Open Source database troubleshooting and performance optimization platform for MySQL and MongoDB Based on Industry Leading Technology Roll your own in and out of the Cloud 2
3 .Exploring Percona Monitoring and Management You should be able to install PMM in • http://bit.ly/InstallPMM 15 minutes or less Would like to follow along in the • https://pmmdemo.percona.com demo ? 3
4 .In the Presentation Practical approach to deal with some of the common MySQL Issues 4
5 .PMM is not just for MySQL Supports MongoDB as well Other databases can be added via External Exporters This Presentation is MySQL Focused 5
6 .Assumptions You’re looking to Have your MySQL Queries Run Faster You want to troubleshoot sudden MySQL Performance Problem You want to find way to run more efficiently (use less Resources) 6
7 .How to Look at MySQL Performance Resource Based Query Based Approach Approach • All the users • Queries use resources. (developers) care is Slow Performance how quickly their often caused by queries perform resource constraints 7
8 .Primary Resources CPU Disk IO Memory Network 8
9 .Low Resource Usage + Poor Performance Contention Mixed Resource Usage • Table Locks/Row Level Locks • Single worker spending 33% • Locking/Latching in MySQL on CPU and Kernel • 33% Waiting on Disk • 33% on Network • Will not be seen as directly constrained by any resource 9
10 .Load Average • What can you tell me about server load ? 10
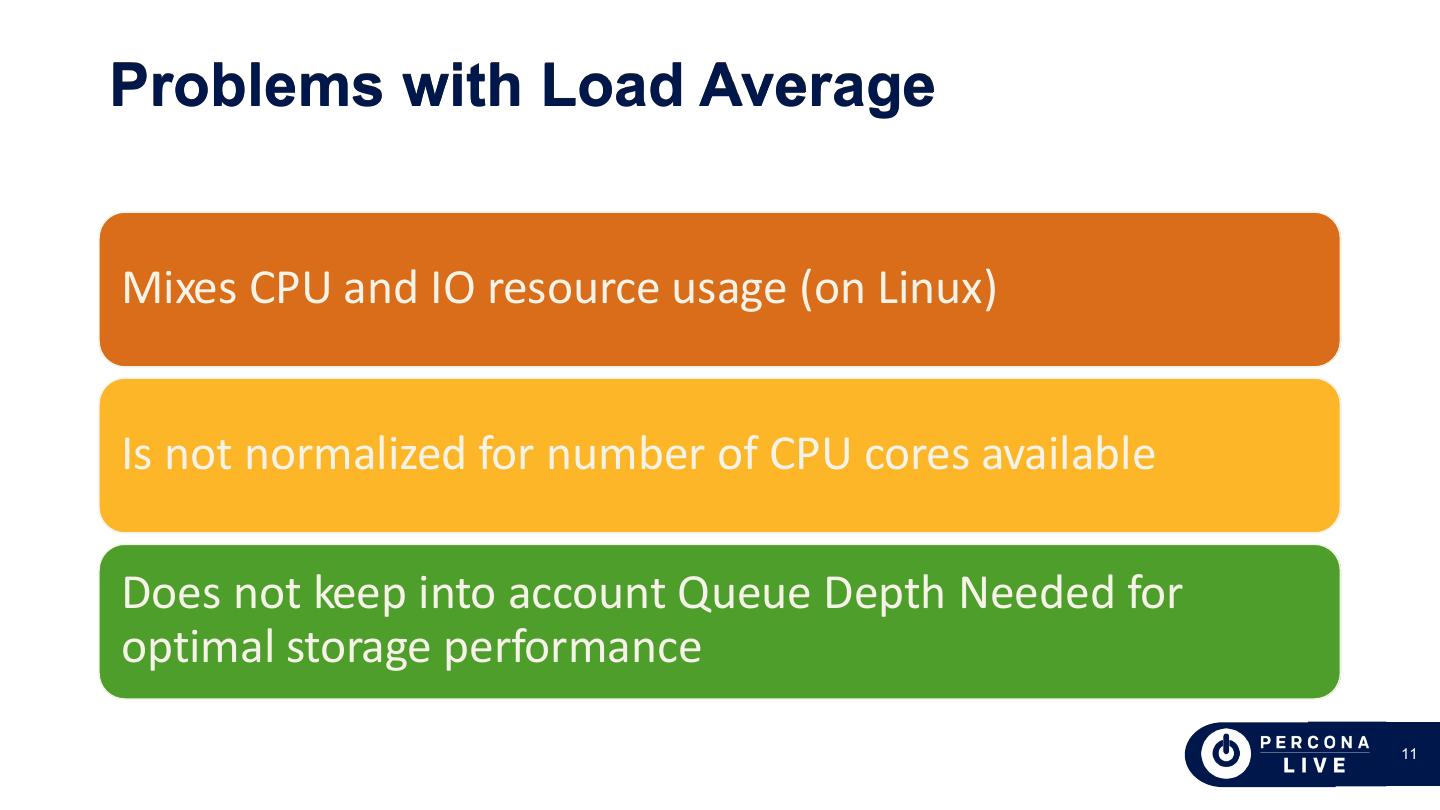
11 .Problems with Load Average Mixes CPU and IO resource usage (on Linux) Is not normalized for number of CPU cores available Does not keep into account Queue Depth Needed for optimal storage performance 11
12 .CPU Usage • Can observe overall or per core • Matching Load Average in the previous screen 12
13 .Saturation Metrics • Good to understand where waits are happening • IO Load is not normalized 13
14 .Looking at CPU Saturation Separately • Can normalize CPU Saturation based on number of threads 14
15 .Row Locks – Logical Contention • Row Locks are often declared by transaction semantics • But more transactions underway also mean more locks 15
16 .Zooming in on Row Locks Wait Load • How many MySQL Connections are Blocked because or Row Level Lock Waits 16
17 .“Load at MySQL Side” • “threads_running” - MySQL is busy handling query • CPU ? Disk ? Row Level Locks ? Need to dig deeper 17
18 .MySQL Questions – Inflow of Queries • Are we serving more queries or less queries ? • Any spikes or dips ? 18
19 .Innodb Rows – Actual Work Being Done • Better number to think re system capacity • Not all rows are created equal, but more equal than queries 19
20 .Commands – What kind of operations • Note if prepared statements are used MySQL is “double counting” 20
21 .MySQL “Handlers” low lever row access • Works for all storage engines • Gives more details on access type • Mixes Temporary Tables and Non-Temporary tables together 21
22 .Memory usage by MySQL Leave some memory available for OS Cache and other needs 22
23 .Innodb in Depth
24 .Innodb Checkpointing • The log file size is good enough as Uncheckpointed bytes are fraction of log file size 24
25 .Innodb Checkpointing • Very Close – Innodb Log File Size too small for optimal performance 25
26 .Innodb Transaction History - not yet Purged Transactions • Short term spikes are normal if some longer transactions are ran on the system 26
27 .Innodb Transaction History • Growth over long period of time without long queries in the processlist • Often identifies orphaned transactions (left open) 27
28 .Transaction History Recovery • If Backlog is resolved quickly it is great • If not you may be close to the limit of purge subsystem 28
29 .Is your Innodb Log Buffer Large Enough? • You will be surprised to see how little log buffer space Innodb needs 29


