- 快召唤伙伴们来围观吧
- 微博 QQ QQ空间 贴吧
- 文档嵌入链接
- 复制
- 微信扫一扫分享
- 已成功复制到剪贴板
Extending and Customizing Percona Monitoring and Management
您是否已经在您的环境中运行了stock pmm,并且想要了解如何扩展pmm平台?来了解:
1。仪表板自定义
如何从现有图形创建自定义仪表板,或构建跨服务器仪表板
2。外部出口商-随时随地监控任何服务!
添加导出器、在数据探索中查看数据、部署工作仪表板
3。使用自定义查询(mysql和postgresql)
对数据库执行select语句并存储在prometheus中
构建与您的环境相关的仪表盘
4。自定义导出器选项
启用适用于您的环境的取消激活功能
5。使用Grafana警报
如何设置频道(smtp、slack等)
如何配置阈值和警报
6。使用mysql/postgresql数据源
对数据库执行SELECT语句并绘制应用程序度量
展开查看详情
1 . Extending and Customizing PMM Michael Coburn Percona
2 .Michael Coburn ● Product Manager for PMM (as well as for Percona Toolkit) ● At Percona for 6 years across multiple MySQL roles ○ Principal Architect, Managing Consultant, Technical Account Manager 2
3 .What is PMM ● Free, Open Source database troubleshooting and performance optimization platform for MySQL, MongoDB, and PostgreSQL ○ We also support: ■ ProxySQL ■ Amazon RDS MySQL & Aurora MySQL ■ Remote MySQL & PostgreSQL instances ● Runs in your secure environment (this is not a SaaS product!) and on your equipment ● Secured with SSL between client and server 3
4 .Customizing Dashboards Click to add text
5 .Grafana in a Nutshell ● Open Source data visualisation tool ● Dashboards are just JSON ● Popular datasources ○ Prometheus ○ CloudWatch ○ Graphite ○ Elasticsearch ● Templated Variables ○ Define your graph metrics, and let the hosts get filled in automatically ○ GREAT for large, dynamic environments where hosts are considered ephemeral 5
6 .Dashboard Example - MySQL Overview 6
7 .Editing a Dashboard ● Enter into Edit mode ● Review Metrics formulas & define graph characteristics 7
8 .Collect Metrics from anywhere Click to add text
9 .External Exporters ● Prometheus is a very active community, hundreds of exporters exist ● First configure an Exporter to run, then notify PMM to scrape the new Exporter ● pmm-admin add external:service --service-port=9187 postgresql 9
10 .Adding Dashboards ● Create your own! ● Or use one from grafana.com/dashboards and edit as needed ○ Datasource name (change to Prometheus) ○ Edit instance variables to match PMM variable names (i.e. $host when most grafana.com Dashboards use $instance) 10
11 .Custom Queries Available for MySQL and PostgreSQL
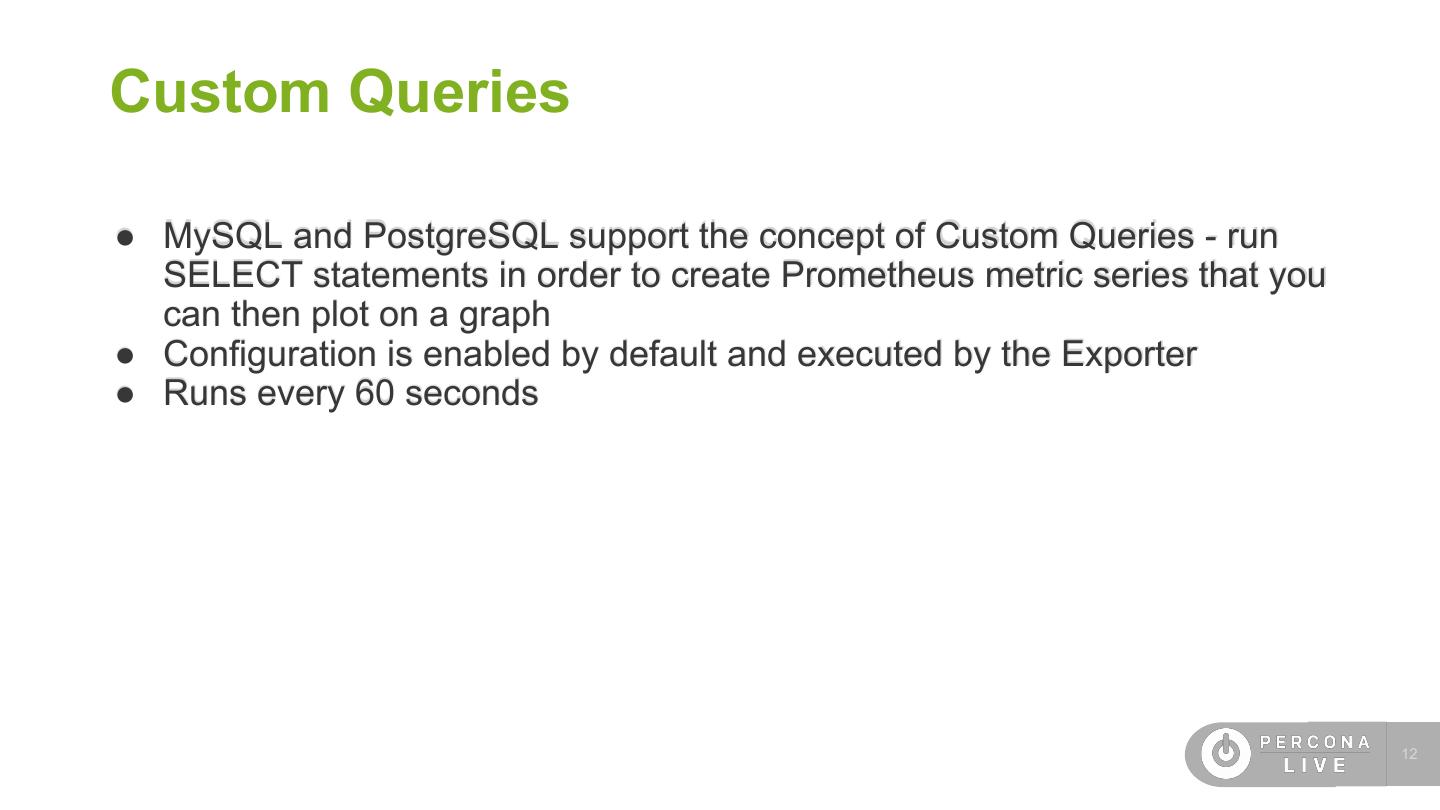
12 .Custom Queries ● MySQL and PostgreSQL support the concept of Custom Queries - run SELECT statements in order to create Prometheus metric series that you can then plot on a graph ● Configuration is enabled by default and executed by the Exporter ● Runs every 60 seconds 12
13 .Users table - MySQL view 13
14 .Users table - queries-mysqld.yml ● Configuration is stored in /usr/local/pmm-client/ 14
15 .Users table - Advanced Data Exploration 15
16 .Customizing Exporter Options
17 .Exporter Options ● Exporters have multiple collectors - specific code to collect specific metrics from the service being monitored ● Percona balances maximum data collection with minimum impact on the observed system ● This leads to some Exporter collectors being disabled 17
18 .node_exporter Example ● 48 total collectors: 32 are enabled by default, 16 disabled ● We want to enable monitoring of NTP ○ pmm-admin remove linux:metrics ○ pmm-admin add linux:metrics -- --collectors.enabled=...,ntp ○ ps aux | grep node_exporter 18
19 .Using Grafana Alerting Click to add text
20 .Grafana Alerting ● Rules are added to graphs that react based on defined thresholds ● Alerts are sent to pre-defined Notification Channels ○ You can have multiple channels defined 20
21 .Grafana Alerting 21
22 .Grafana Notification Channels ● Defines how you will learn about new alerts ● Over a dozen are available: ○ Email ○ Slack ○ PagerDuty ○ AlertManager ○ ... 22
23 .Using MySQL Data Source Click to add text
24 .MySQL Data Source ● Grafana feature which PMM inherits from upstream ● Results of a SELECT statement can draw graphs ● Our example is using Percona Production data 24
25 .PMM Versions over Time 25
26 .Do's and Don'ts Click to add text
27 .PMM Best Practices ● Grafana Alerting works great for < 50 instances ○ over that it becomes prohibitive to manage the variable -> string mappings ● Don't edit Percona-provided Dashboards - your changes will be overwritten at next upgrade! ○ Instead copy the dashboard and edit your copy, and it will survive upgrades ● Send us your ideas, and even better, your Dashboards ○ Percona loves Pull Requests! Your changes can make it into a future release ● Participate in the percona.com/forums ! 27
28 .Rate My Session 28
29 .29


