- 快召唤伙伴们来围观吧
- 微博 QQ QQ空间 贴吧
- 文档嵌入链接
- 复制
- 微信扫一扫分享
- 已成功复制到剪贴板
Open Source Databases and Non-Volatile Memory
请看一下Intel的Optane技术是什么,以及一些软件附加组件和开放源代码数据库是如何在此技术上进行测试的。
展开查看详情
1 . Frank Ober @fxober @IntelStorage November 7, 2018 NVM Solutions Group
2 . Legal Disclaimer Intel may make changes to specifications and product descriptions at any time, without notice. Designers must not rely on the absence or characteristics of any features or instructions marked "reserved" or "undefined". Intel reserves these for future definition and shall have no responsibility whatsoever for conflicts or incompatibilities arising from future changes to them. The information here is subject to change without notice. Do not finalize a design with this information. The products described in this document may contain design defects or errors known as errata which may cause the product to deviate from published specifications. Current characterized errata are available on request. Intel technologies’ features and benefits depend on system configuration and may require enabled hardware, software or service activation. Performance varies depending on system configuration. No computer system can be absolutely secure. Check with your system manufacturer or retailer or learn more atintel.com. Intel disclaims all express and implied warranties, including without limitation, the implied warranties of merchantability, fitness for a particular purpose, and non-infringement, as well as any warranty arising from course of performance, course of dealing, or usage in trade. Software and workloads used in performance tests may have been optimized for performance only on Intel microprocessors. Performance tests, such as SYSmark and MobileMark, are measured using specific computer systems, components, software, operations and functions. Any change to any of those factors may cause the results to vary. You should consult other information and performance tests to assist you in fully evaluating your contemplated purchases, including the performance of that product when combined with other products. For more complete information visit www.intel.com/benchmarks. Cost reduction scenarios described are intended as examples of how a given Intel-based product, in the specified circumstances and configurations, may affect future costs and provide cost savings. Circumstances will vary. Intel does not guarantee any costs or cost reduction. Intel does not control or audit the design or implementation of third party benchmark data or Web sites referenced in this document. Intel encourages all of its customers to visit the referenced Web sites or others where similar performance benchmark data are reported and confirm whether the referenced benchmark data are accurate and reflect performance of systems available for purchase. Intel, the Intel logo, 3D XPoint, Intel Core, Intel Optane, Xeon, and others are trademarks of Intel Corporation in the U.S. and/or other countries. © 2018 Intel Corporation. *Other names and brands may be claimed as the property of others. NVM Solutions Group 2
3 . Agenda Primer on Intel’s SSDs & Non-Volatile Memory Benchmarks – sysbench, other Access to Intel® Optane™ DC SSDs & helpful tools NVM Solutions Group 3
4 .4
5 .Intel Innovations – Transforming the Data Tiering Hierarchy Intel® 3D Intel® NAND Optane™ Technology Technology Lower cost and Higher higher density Performance Capacity data Working data LOWER HIGHER LESS MORE Cost Delay NVMNVM SOLUTIONS Solutions GroupGROUP Intel Confidential 5
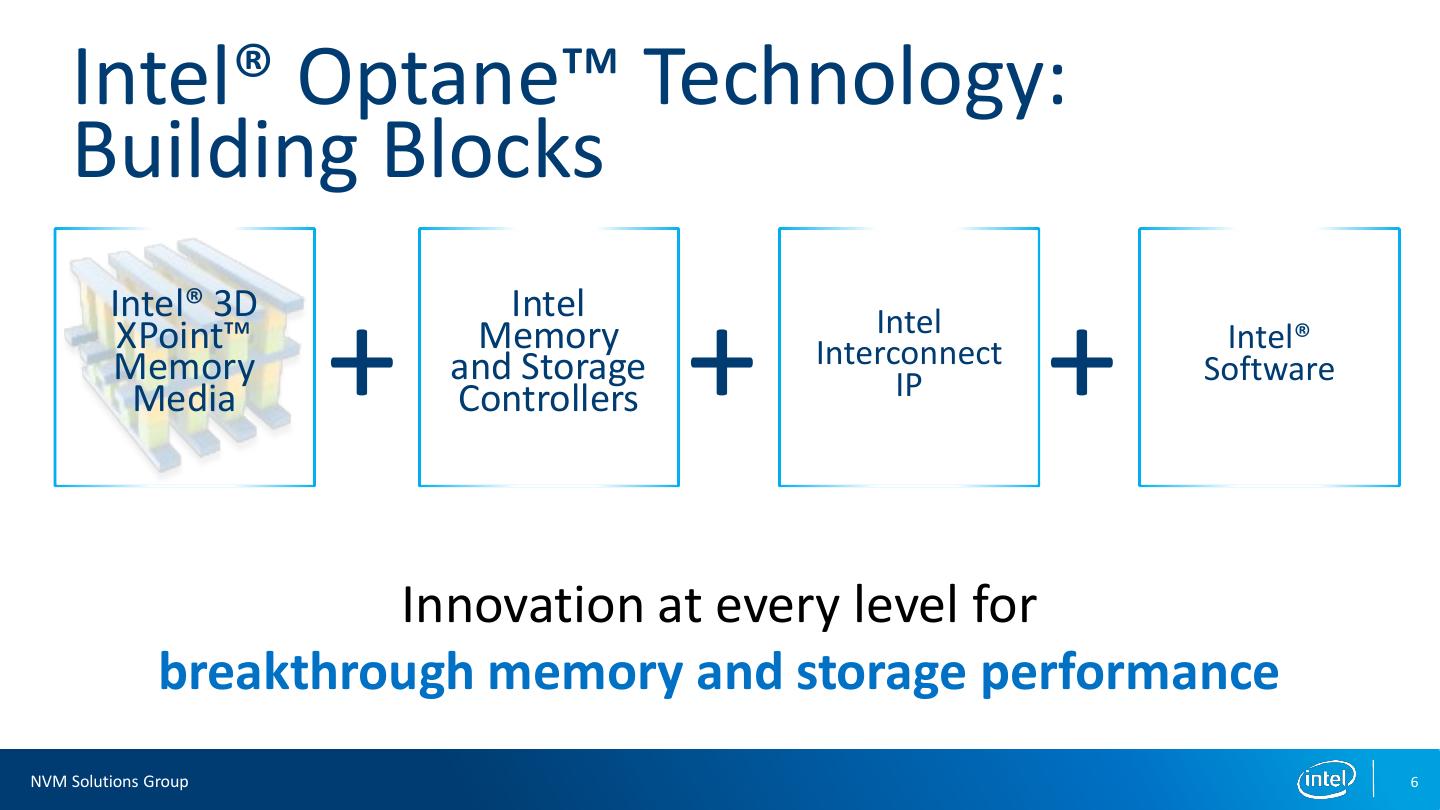
6 . Intel® Optane™ Technology: Building Blocks Intel® 3D Intel XPoint™ Memory Media + Memory and Storage Controllers + Intel Interconnect IP + Intel® Software Innovation at every level for breakthrough memory and storage performance NVM Solutions Group 6
7 . Intel® Optane™ DC SSD P4800X. the ideal caching solution. lower and more consistent latency + higher endurance = more efficient Average Read Latency under Random Write Workload1 Drive Writes Per Day (DWPD)2 Cache as a % of Storage Capacity3 60 Intel® Optane™ DC SSD P4800X Intel® SSD DC P3700 Random Write 800 DWPD Intel® Optane™ 1000 700 Intel® Optane™ DC SSD P4800X 600 DC SSD P4800X as cache 800 Storage Avg Read Latency (us) Random Write MB/s 500 400 600 300 3.0 200 400 40x DWPD lower 100 Intel® SSD DC Intel® SSD DC 200 0 P4600 (3D NAND) 8x P4600 (3D NAND) as cache lower 0 Storage Lower latency + higher endurance = greater SDS system efficiency 1. Source – Intel-tested: Average read latency measured at queue depth 1 during 4k random write workload. Measured using FIO 3.1. Common Configuration - Intel 2U Server System, OS CentOS 7.5, kernel 4.17.6-1.el7.x86_64, CPU 2 x Intel® Xeon® 6154 Gold @ 3.0GHz (18 cores), RAM 256GB DDR4 @ 2666MHz. Configuration – Intel® Optane™ SSD DC P4800X 375GB and Intel® SSD DC P4600 1.6TB. Latency – Average read latency measured at QD1 during 4K Random Write operations using FIO 3.1. Intel Microcode: 0x2000043; System BIOS: 00.01.0013; ME Firmware: 04.00.04.294; BMC Firmware: 1.43.91f76955; FRUSDR: 1.43. SSDs tested were commercially available at time of test. The benchmark results may need to be revised as additional testing is conducted. Performance results are based on testing as of July 24, 2018 and may not reflect all publicly available security updates. See configuration disclosure for details. No product can be absolutely secure. Software and workloads used in performance tests may have been optimized for performance only on Intel microprocessors. Performance tests, such as SYSmark and MobileMark, are measured using specific computer systems, components, software, operations and functions. Any change to any of those factors may cause the results to vary. You should consult other information and performance tests to assist you in fully evaluating your contemplated purchases, including the performance of that product when combined with other products. For more complete information visit www.intel.com/benchmarks. 2. Source – Intel: Endurance ratings available at https://www.intel.com/content/www/us/en/solid-state-drives/optane-ssd-dc-p4800x-brief.html 3. Source – Intel: General proportions shown for illustrative purposes. NVM Solutions Group 7
8 . Modern data center: recommended configuration with Intel dataCloud center SSDs. Compute Server Storage Cluster • Journals Local Intel® CAS or SPDK Intel® Optane™ Intel® Optane™ • Metadat 4 optional Intel® Intel® SSDOptane™ Intel® SSDOptane™ Intel® 1 Storage/ SSDOptane™ Intel® SSDOptane™ SSD SSDOptane™ Intel® SSDOptane™ SSD a Cache Intel® Optane™ SSD Intel® 3D Intel® 3D Intel® 3D Intel® 3D NAND™ NAND™ NAND™ NAND™ DC SSD DC SSD DC SSD DC SSD • Tiering expanded optional Intel® Memory Drive 2 virtual Intel® Technology or Swap memory Optane™ SSD Intel® 3D NAND™ Intel® 3D NAND™ Intel® 3D NAND™ DC SSD DC SSD DC SSD Local Cache 3to Remote optional Storage Intel® Optane™ SSD Intel® CAS Intel® 3D NAND™ Intel® 3D NAND™ Intel® 3D NAND™ DC SSD DC SSD DC SSD Intel® Xeon Intel® Intel® Intel® E1.L Intel® 3D Intel® 3D DRAM Optane™ Optane™ NAND™ HARDWARE LEGEND CPU SSD “Ruler” SSD DC SSD NAND SSD SSD NVM Solutions Group 8
9 . USAGE MODELs for Optane in Databases Create a Caching drive over SATA SSDs (Intel® CAS) Tiering Intel® Optane™ SSDs for specific cases Write Logs or High Ingest drive Temp Data drive NVM Solutions Group 9
10 . Intel® SSDs support broad Range of EDSFF Form Factors EDSFF 1U Short EDSFF 1U Long x4, x8 (ruler) EDSFF EDSFF 1U Long 18mm heatsink family 6W 8 10 12 15 20 25 30 40W Power (W) Current PCIE* Low Power NVMe* Server Performance NVMe* Server Performance NVMe* Form M.2 80mm and 110mm U.2 2.5in x 7mm Low profile HHHL x4 AIC U.2 2.5in x 15mm Low profile HHHL x8 AIC Factors *Other names and brands may be claimed as the property of others. NVM Solutions Group 10
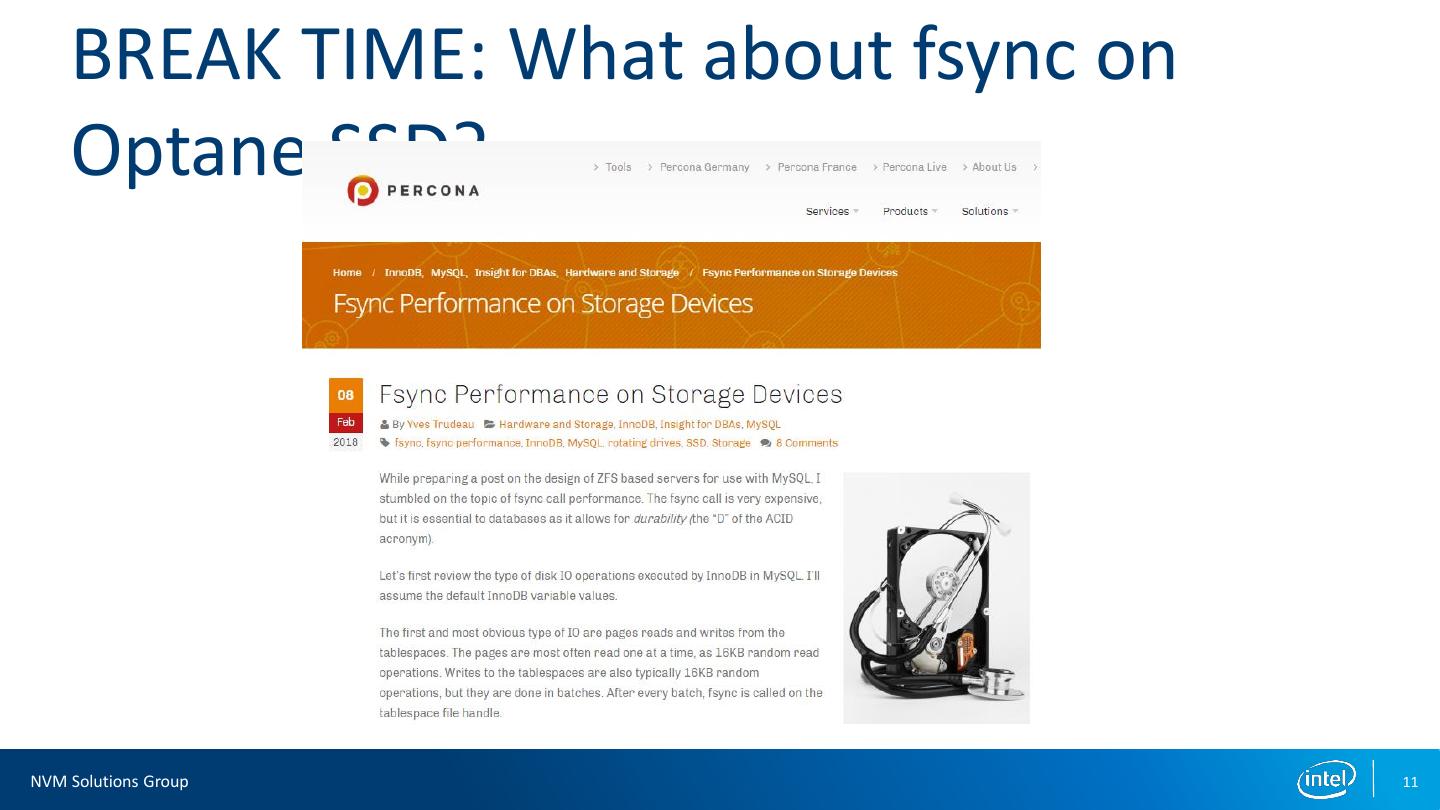
11 . BREAK TIME: What about fsync on Optane SSD? NVM Solutions Group 11
12 .
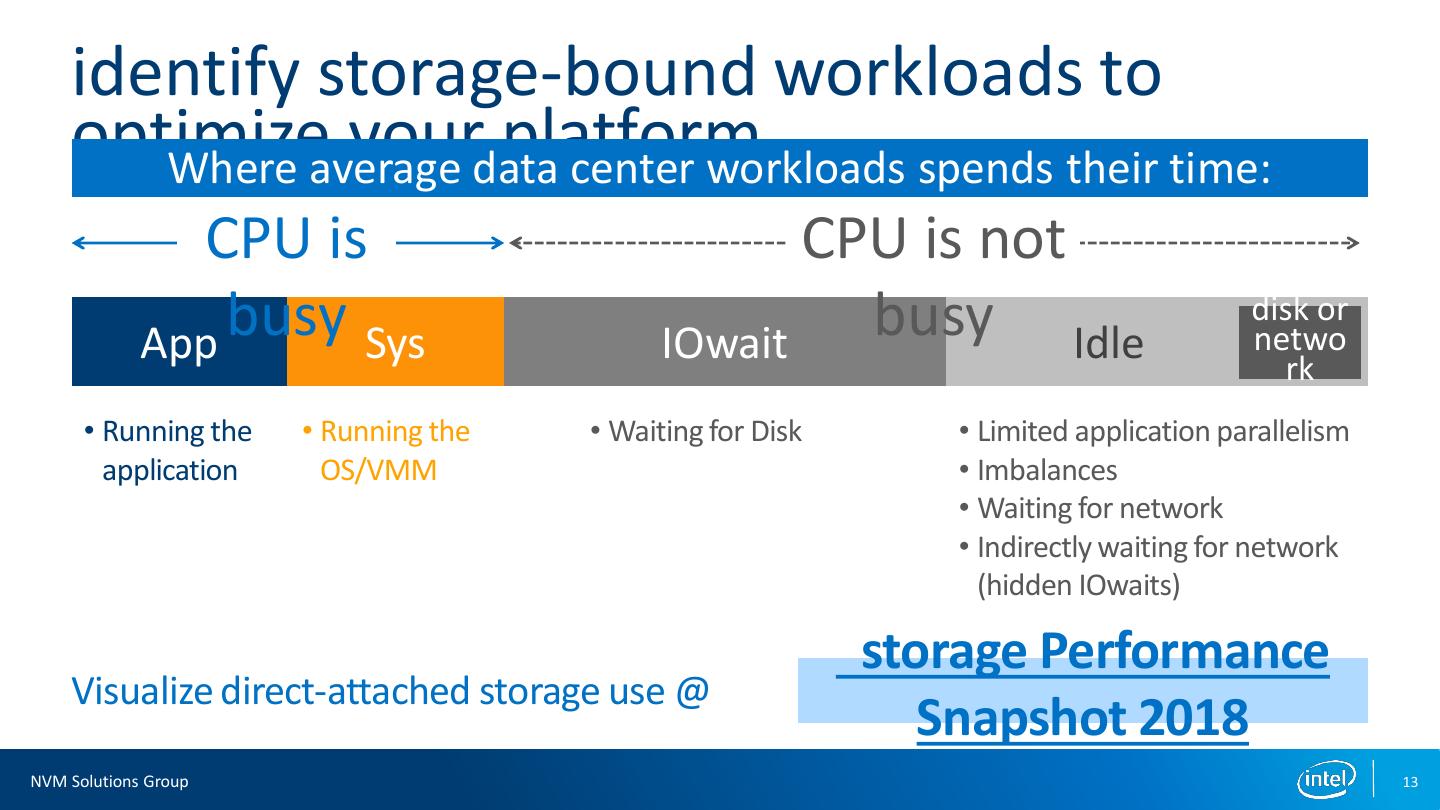
13 . identify storage-bound workloads to optimize your platform Where average data center workloads spends their time: CPU is CPU is not App busy Sys IOwait busy Idle disk or netwo rk • Running the • Running the • Waiting for Disk • Limited application parallelism application OS/VMM • Imbalances • Waiting for network • Indirectly waiting for network (hidden IOwaits) storage Performance Visualize direct-attached storage use @ Snapshot 2018 NVM Solutions Group 13
14 . TPCC on NVMe* Devices…. Intel® SSD DC P4510 (NVMe NAND) Software and workloads used in performance tests may have been optimized for performance only on Intel microprocessors. Performance tests, such as SYSmark and MobileMark, are measured using specific computer systems, components, software, operations and functions. Any change to any of those factors may cause the results to vary. You should consult other information and performance tests to assist you in fully evaluating your contemplated purchases, including the performance of that product when combined with other products. For more complete information visitwww.intel.com/benchmarks. 1 System configuration: Intel Sourced: Tested: October 3, 2018. Server Intel® Server System , 2x Intel® Xeon® Scalable 6154, 384 GB DDR4 DRAM, database drives- 3x Intel® SSD DC P4800X Series (375 GB) and 1x Intel® SSD DC P4510 Series, CentOS 7.5 (kernel 4.18.8 (from elrepo)), BIOS: SE5C620.86B.00.01.0014.070920180847 system product type: S2600WFT Percona MySQL Server 5.7.23, Sysbench 1.0.15 configured TPCC / sysbench per github project https://github.com/Percona-Lab/sysbench-tpcc 100GB database size. 30% Database Memory provided to MySQL (30GB). Performance results are based on testing as of Oct 3, 2018 and may not reflect all publicly available security updates. See configuration disclosure for details. No component or product can be absolutely secure. *Other names and brands names may be claimed as the property of others NVM Solutions Group 14
15 . TPCC on Intel® Optane DC SSDs (NVMe* 3DXP) Software and workloads used in performance tests may have been optimized for performance only on Intel microprocessors. Performance tests, such as SYSmark and MobileMark, are measured using specific computer systems, components, software, operations and functions. Any change to any of those factors may cause the results to vary. You should consult other information and performance tests to assist you in fully evaluating your contemplated purchases, including the performance of that product when combined with other products. You should consult other information and performance tests to assist you in fully evaluating your contemplated purchases, including the performance of that product when combined with other products. For more complete information visitwww.intel.com/benchmarks. 1 System configuration: Intel Sourced: Tested: October 3, 2018. Server Intel® Server System , 2x Intel® Xeon® Scalable 6154, 384 GB DDR4 DRAM, database drives- 3x Intel® SSD DC P4800X Series (375 GB) and 1x Intel® SSD DC P4510 Series, CentOS 7.5 (kernel 4.18.8 (from elrepo)), BIOS: SE5C620.86B.00.01.0014.070920180847 system product type: S2600WFT Percona MySQL Server 5.7.23, Sysbench 1.0.15 configured TPCC / sysbench per github project https://github.com/Percona-Lab/sysbench-tpcc 100GB database size. 30% Database Memory provided to MySQL (30GB). Performance results are based on testing as of Oct 3, 2018 and may not reflect all publicly available security updates. See configuration disclosure for details. No component or product can be absolutely secure. *Other names and brands names may be claimed as the property of others NVM Solutions Group 15
16 . ORACLE* MySQL* 8.0 Sysbench OLTP (R/W – 70/30, 128u, 8t, 50m) vs SSD D3-S4510 vs SSD D3-S4510 D3-S4510 Software and workloads used in performance tests may have been optimized for performance only on Intel microprocessors. Performance tests, such as SYSmark and MobileMark, are measured using specific computer systems, components, software, operations and functions. Any change to any of those factors may cause the results to vary. You should consult other information and performance tests to assist you in fully evaluating your contemplated purchases, including the performance of that product when combined with other products. You should consult other information and performance tests to assist you in fully evaluating your contemplated purchases, including the performance of that product when combined with other products. For more complete information visitwww.intel.com/benchmarks. 1 System configuration: Intel Sourced: Tested: September 20, 2018. Server Intel® Server System , 2x Intel® Xeon® Scalable 6154,384 GB DDR4 DRAM, database drives- 2x Intel® SSD DC P4800X Series (375 GB) and 1x Intel® SSD DC P4510 Series, 1x Intel® SSD DC S4510 Series, CentOS 7.5 (kernel 4.18 (elrepo)), BIOS: SE5C620.86B.00.01.0014.070920180847 system product type: S2600WFT. MySQL Server 8.0.13, Sysbench 1.0,15 configured for 70/30 Read/Write OLTP transaction split using a 100GB database. 30% Database Memory provided to MySQL (30GB). Performance results are based on testing as of Sept 20, 2018 and may not reflect all publicly available security updates. See configuration disclosure for details. No component or product can be absolutely secure. *Other names and brands names may be claimed as the property of others NVM Solutions Group 16
17 . PERCONA* MySQL* 5.7 Sysbench OLTP (R/W – 70/30, 128u, 8t, 50m) vs SSD D3-S4510 vs SSD D3-S4510 D3-S4510 Software and workloads used in performance tests may have been optimized for performance only on Intel microprocessors. Performance tests, such as SYSmark and MobileMark, are measured using specific computer systems, components, software, operations and functions. Any change to any of those factors may cause the results to vary. You should consult other information and performance tests to assist you in fully evaluating your contemplated purchases, including the performance of that product when combined with other products. You should consult other information and performance tests to assist you in fully evaluating your contemplated purchases, including the performance of that product when combined with other products. For more complete information visitwww.intel.com/benchmarks. 1 System configuration: Intel Sourced: Tested: September 20, 2018. Server Intel® Server System , BIOS: SE5C620.86B.00.01.0014.070920180847 system product type: S2600WFT 2x Intel® Xeon® Scalable 6154, 384 GB DDR4 DRAM, database drives- 2x Intel® SSD DC P4800X Series (375 GB) and 1x Intel® SSD DC P4510 Series, 1x Intel® SSD DC S4510 Series, CentOS 7.5 (kernel 4.18 (elrepo)), Percona MySQL Server 5.7.23, Sysbench 1.0,15 configured for 70/30 Read/Write OLTP transaction split using a 100GB database. 30% Database Memory provided to MySQL (30GB). Performance results are based on testing as of Sept 20, 2018 and may not reflect all publicly available security updates. See configuration disclosure for details. No component or product can be absolutely secure. *Other names and brands names may be claimed as the property of others NVM Solutions Group 17
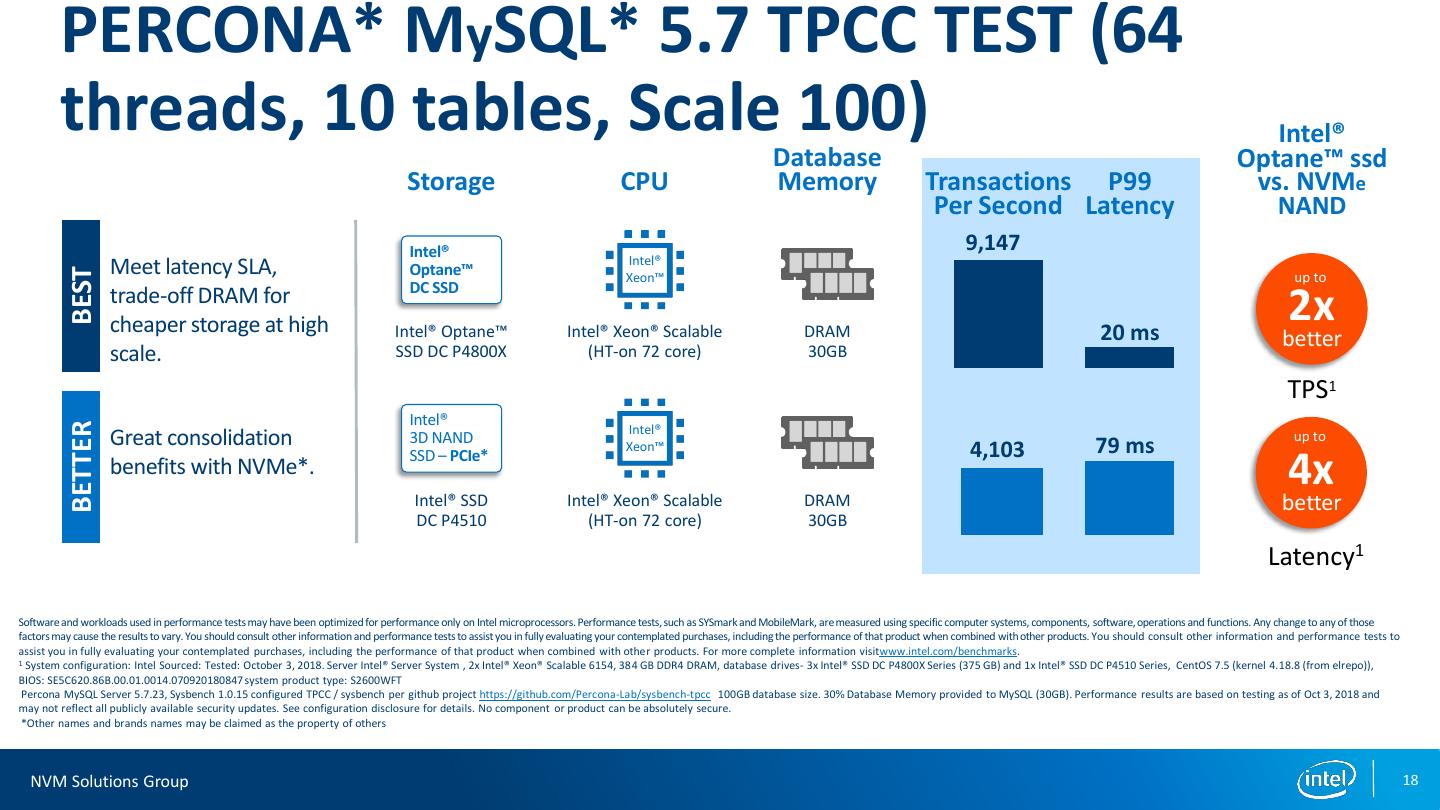
18 . PERCONA* MySQL* 5.7 TPCC TEST (64 threads, 10 tables, Scale 100) Intel® Database Optane™ ssd Storage CPU Memory Transactions P99 vs. NVMe Per Second Latency NAND Intel® 9,147 Intel® Meet latency SLA, Optane™ BEST Xeon™ up to DC SSD trade-off DRAM for cheaper storage at high Intel® Optane™ Intel® Xeon® Scalable DRAM 20 ms 2x better scale. SSD DC P4800X (HT-on 72 core) 30GB TPS1 Intel® BETTER Intel® Great consolidation 3D NAND 79 ms up to Xeon™ 4,103 benefits with NVMe*. SSD – PCIe* 4x Intel® SSD Intel® Xeon® Scalable DRAM better DC P4510 (HT-on 72 core) 30GB Latency1 Software and workloads used in performance tests may have been optimized for performance only on Intel microprocessors. Performance tests, such as SYSmark and MobileMark, are measured using specific computer systems, components, software, operations and functions. Any change to any of those factors may cause the results to vary. You should consult other information and performance tests to assist you in fully evaluating your contemplated purchases, including the performance of that product when combined with other products. You should consult other information and performance tests to assist you in fully evaluating your contemplated purchases, including the performance of that product when combined with other products. For more complete information visitwww.intel.com/benchmarks. 1 System configuration: Intel Sourced: Tested: October 3, 2018. Server Intel® Server System , 2x Intel® Xeon® Scalable 6154, 384 GB DDR4 DRAM, database drives- 3x Intel® SSD DC P4800X Series (375 GB) and 1x Intel® SSD DC P4510 Series, CentOS 7.5 (kernel 4.18.8 (from elrepo)), BIOS: SE5C620.86B.00.01.0014.070920180847 system product type: S2600WFT Percona MySQL Server 5.7.23, Sysbench 1.0.15 configured TPCC / sysbench per github project https://github.com/Percona-Lab/sysbench-tpcc 100GB database size. 30% Database Memory provided to MySQL (30GB). Performance results are based on testing as of Oct 3, 2018 and may not reflect all publicly available security updates. See configuration disclosure for details. No component or product can be absolutely secure. *Other names and brands names may be claimed as the property of others NVM Solutions Group 18
19 . ORACLE* MySQL* 8.0 OLTP RW TEST (32 threads, Intel Cache 8 tables X SOFTWARE Acceleration 50M rows) for LINUX 3.6 Intel® Database Optane™ ssd Storage CPU Memory Transactions AVG AS A CACHE Per Second Latency DRIVE Intel CAS Cache using Intel® 10,007 an Optane and coalesce CACHE Intel® Intel® Optane™ Xeon™ up to writes to cheaper DC SSD3D NAND SSD NAND. Accelerate reads – SATA* Intel® Optane™ Intel® Xeon® Scalable Database 3.2 ms 3x with lower latency SSD DC P4800X (HT-on 72 core) Memory 30GB better device. + S4510 20G / 100G TPS1 Intel® Intel® SATA is a baseline 3D NAND SSD 10.45 ms up to SATA Xeon™ configuration for many. – SATA* Database 3,060 3x Intel® SSD Intel® Xeon® Scalable better DC S4510 (HT-on 72 core) Memory 30GB 100GB DB Average Latency1 TESTED WITH PARETO 80/20 RANDOMIZATION Software and workloads used in performance tests may have been optimized for performance only on Intel microprocessors. Performance tests, such as SYSmark and MobileMark, are measured using specific computer systems, components, software, operations and functions. Any change to any of those factors may cause the results to vary. You should consult other information and performance tests to assist you in fully evaluating your contemplated purchases, including the performance of that product when combined with other products. You should consult other information and performance tests to assist you in fully evaluating your contemplated purchases, including the performance of that product when combined with other products. For more complete information visitwww.intel.com/benchmarks. 1 System configuration: Intel Sourced: Tested: October 20, 2018. Server Intel® Server System , 2x Intel® Xeon® Scalable 6154, 384 GB DDR4 DRAM, database drives- 2x Intel® SSD DC P4800X Series (375 GB) and 1x Intel® SSD DC P4510 Series, 1x Intel® SSD DC S4510 Series, CentOS 7.5 (kernel 4.18 (elrepo)), BIOS: SE5C620.86B.00.01.0014.070920180847 system product type: S2600WFT, Intel version of Intel CAS used version 3.6 set in write back mode over a single S4510 SSD. MySQL Server 8.0.13, Sysbench 1.0,15 configured for 70/30 Read/Write OLTP transaction split using a 100GB database. 30% Database Memory provided to MySQL (30GB). Performance results are based on testing as of [Oct 20, 2018] and may not reflect all publicly available security updates. See configuration disclosure for details. No component or product can be absolutely secure. *Other names and brands names may be claimed as the property of others NVM Solutions Group 19
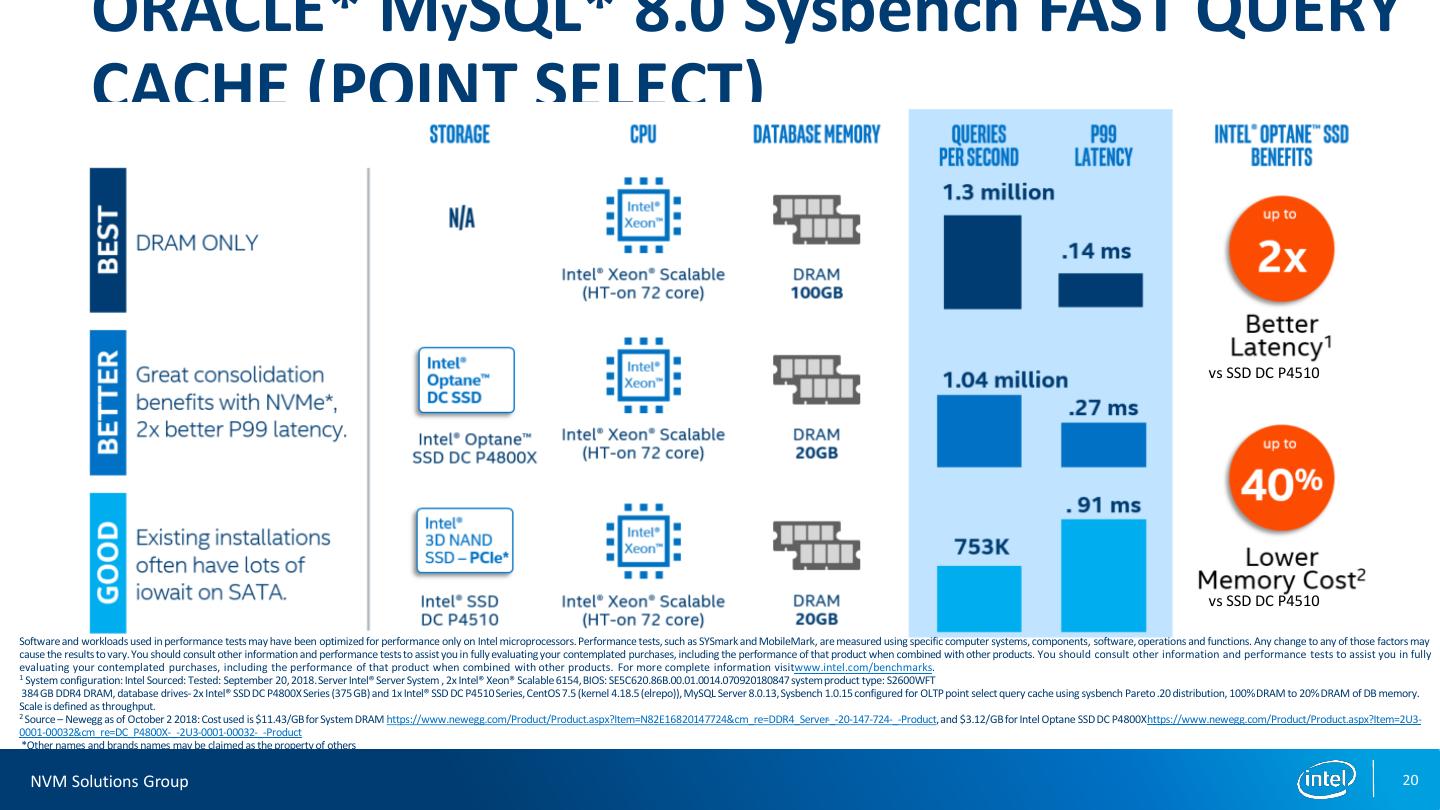
20 . ORACLE* MySQL* 8.0 Sysbench FAST QUERY CACHE (POINT SELECT) vs SSD DC P4510 vs SSD DC P4510 Software and workloads used in performance tests may have been optimized for performance only on Intel microprocessors. Performance tests, such as SYSmark and MobileMark, are measured using specific computer systems, components, software, operations and functions. Any change to any of those factors may cause the results to vary. You should consult other information and performance tests to assist you in fully evaluating your contemplated purchases, including the performance of that product when combined with other products. You should consult other information and performance tests to assist you in fully evaluating your contemplated purchases, including the performance of that product when combined with other products. For more complete information visitwww.intel.com/benchmarks. 1 System configuration: Intel Sourced: Tested: September 20, 2018. Server Intel® Server System , 2x Intel® Xeon® Scalable 6154,BIOS: SE5C620.86B.00.01.0014.070920180847 system product type: S2600WFT 384 GB DDR4 DRAM, database drives- 2x Intel® SSD DC P4800X Series (375 GB) and 1x Intel® SSD DC P4510 Series, CentOS 7.5 (kernel 4.18.5 (elrepo)), MySQL Server 8.0.13, Sysbench 1.0.15 configured for OLTP point select query cache using sysbench Pareto .20 distribution, 100% DRAM to 20% DRAM of DB memory. Scale is defined as throughput. 2 Source – Newegg as of October 2 2018: Cost used is $11.43/GB for System DRAM https://www.newegg.com/Product/Product.aspx?Item=N82E16820147724&cm_re=DDR4_Server-_-20-147-724-_-Product, and $3.12/GB for Intel Optane SSD DC P4800Xhttps://www.newegg.com/Product/Product.aspx?Item=2U3- 0001-00032&cm_re=DC_P4800X-_-2U3-0001-00032-_-Product *Other names and brands names may be claimed as the property of others NVM Solutions Group 20
21 . Memcached*: a latency study with extstore feature • Memcached* users can now use extstore to Latency Per Target Request Rate offload values from DRAM to storage 1400 1200 • 99th Percentile Latnecy (us) Offloading DRAM to Intel® Optane™ SSD 1000 instead of a NAND SSD enables higher throughput per server while staying below a 800 latency SLA of 1ms 600 400 • Intel ® Optane™ SSD stays within 33% of all 200 DRAM latency, while NAND is 100%+ above 0 DRAM latency. 50k 100k 150k 200k 250k 300k 350k 400k 450k 500k Target Request Rate RAM P4800X P4500 Software and workloads used in performance tests may have been optimized for performance only on Intel microprocessors. Performance tests, such as SYSmark and MobileMark, are measured using specific computer systems, components, software, operations and functions. Any change to any of those factors may cause the results to vary. You should consult other information and performance tests to assist you in fully evaluating your contemplated purchases, including the performance of that product when combined with other products. You should consult other information and performance tests to assist you in fully evaluating your contemplated purchases, including the performance of that product when combined with other products. For more complete information visitwww.intel.com/benchmarks. System configuration: Source – Intel October 23, 2018: Server model: 2x Intel® Xeon® Gold 6142 @ 2.6 GHz, 64 hyper threaded cores, Intel system board S2600WF, 192GB installed DDR4 @ 2666Mhz, 1x Intel® Optane™ SSD DC P4800X 750GB, 1x Intel SSD DC P4500 4TB; CentOS 7; kernel 4.15.0-33-generic; testing completed October 23, 2018 – blogs with additional reference material and full server and test configuration are available here: https://memcached.org/blog/nvm-caching/ https://memcached.org/blog/nvme-multidisk/ Requires memcached version 1.5.11 and greater. Performance results are based on testing as of Oct 23, 2018 and may not reflect all publicly available security updates. See configuration disclosure for details. No component or product can be absolutely secure. * Other names and brands may be claimed as the property of others NVM Solutions Group 21
22 . Postgresql: benchmarking by 2ndquadrant* Mixed: Select (Read) Transactions/s • 2ndQuadrant, a Major Sponsor of the PostgreSQL 100000 community, benchmarked Intel Optane DC SSD 80000 60000 against NAND SSD using pgbench 40000 20000 • For mixed workload (75/25 read/write), Optane 0 8.9x 1 5 10 15 20 25 30 outperformed NAND by up to 8.9X (average 5.5X) for Client Connections reads, and up to 2.7X (average 2.5X) for writes Optane P4800X NAND P4500 • For simple updates (writes) Optane outperformed Mixed: Simple Update (Write) Transactions/s 20000 NAND by 2.8X 15000 • For selects (reads), Optane outperformed NAND by 10000 2.7x 1.2X, with NAND leading at 40+ clients 5000 0 1 5 10 15 20 25 30 Client Connections Optane P4800X NAND P4500 Software and workloads used in performance tests may have been optimized for performance only on Intel microprocessors. Performance tests, such as SYSmark and MobileMark, are measured using specific computer systems, components, software, operations and functions. Any change to any of those factors may cause the results to vary. You should consult other information and performance tests to assist you in fully evaluating your contemplated purchases, including the performance of that product when combined with other products. For more complete information visit www.intel.com/benchmarks. System configuration: Source – Intel [August 2, 2018]: Server model: 2x Intel® Xeon® Gold 6142 @ 2.6 GHz, 64 hyper threaded cores, Intel system board S2600WF, 192GB installed DDR4 @ 2666Mhz, 1x Intel® Optane™ SSD DC P4800X 750GB, 1x Intel SSD DC P4500 4TB; CentOS 7; testing completed August 2, 2018. PostgreSQL master branch used as of commit 8f6c94272c. Non-default parameters used for benchmarks: checkpoint_completion_target 0.9; checkpoint_timeout 3600; maintenance_work_mem 16777216; max_connections 400; max_wal_size 16384; min_wal_size 4096; shared_buffers 8388608; wal_buffers 131072; wal_writer_delay 50. 2 billion row table with 120 byte-wide rows used with pgbench. Performance results are based on testing as of [August 2, 2018] and may not reflect all publicly available security updates. See configuration disclosure for details. No component or product can be absolutely secure. * Other names and brands may be claimed as the property of others NVM Solutions Group 22
23 .23
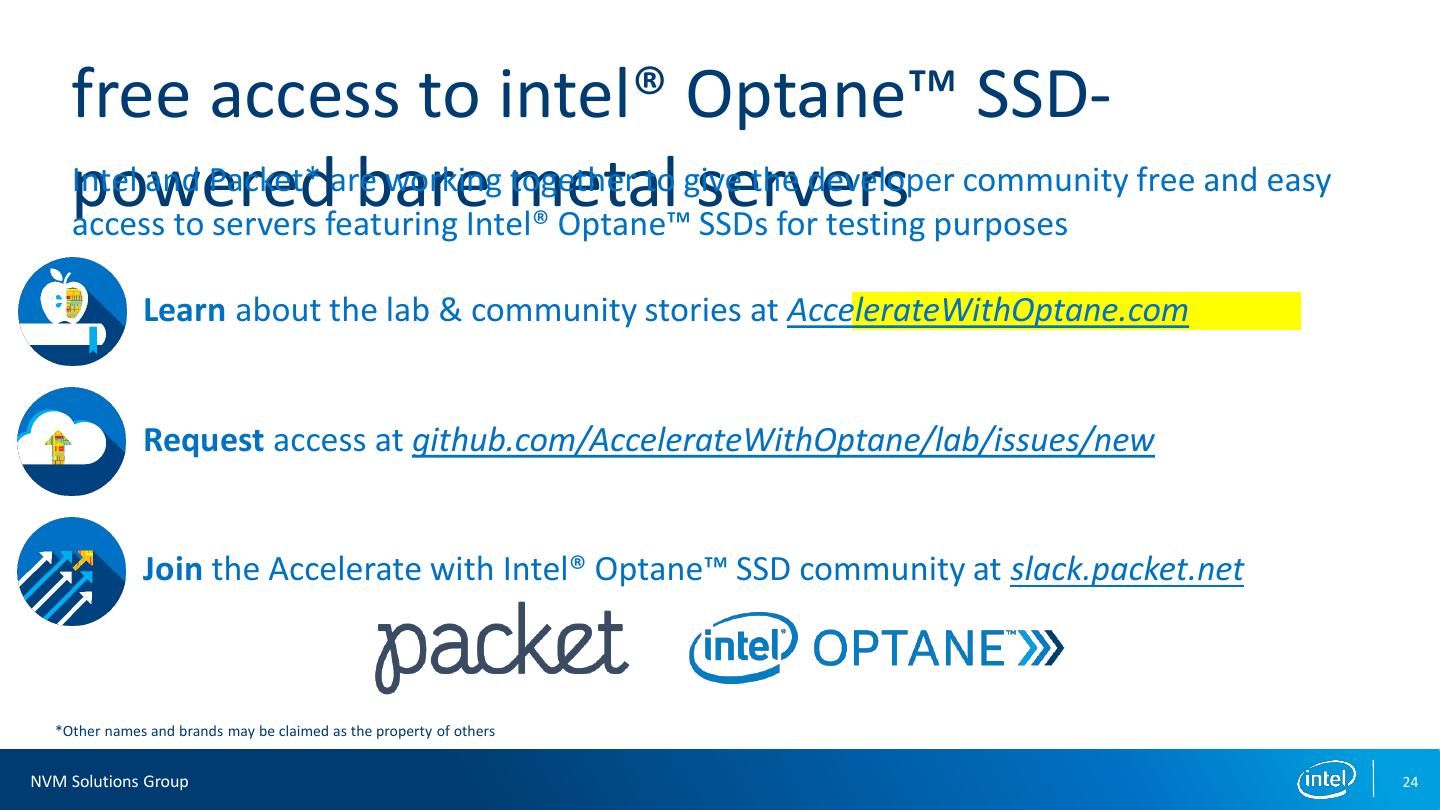
24 . free access to intel® Optane™ SSD- powered Intel bare and Packet* are working metal servers together to give the developer community free and easy access to servers featuring Intel® Optane™ SSDs for testing purposes Learn about the lab & community stories at AccelerateWithOptane.com Request access at github.com/AccelerateWithOptane/lab/issues/new Join the Accelerate with Intel® Optane™ SSD community at slack.packet.net *Other names and brands may be claimed as the property of others NVM Solutions Group 24
25 . TOOLS and GUIDES… How to efficiently test Intel® Optane™ SSDs (Intel® Optane™ SSD Optimization Guide) – https://itpeernetwork.intel.com/tuning-performance-intel-optane-ssds-linux- operating-systems/ How to start with SPDK and VHOST (Virtualization with low latency SSDs) – http://spdk.io/ – https://spdk.io/doc/vhost.html More info CAS-Linux and Intel® Memory Drive Technology – http://intel.com/cas and http://intel.com/imdt Persistent Memory Programming - http://pmem.io/ Performance Analysis Tool - https://github.com/intel-hadoop/PAT NVM Solutions Group 25
26 . Intel® VTune Amplifier - Platform Profiler Finds Performance Metrics ▪ Configuration issues ▪ Extended capture (minutes to hours) ▪ Poorly tuned software ▪ Low overhead – coarse grain metrics Target Users ▪ Sampling OS & hardware performance counters ▪ Infrastructure Architects ▪ RESTful API for easy analysis by scripts ▪ Software Architects & QA Timelines & Histograms Core to Core Comparisons Server Topology Overview NVM Solutions Group 26
27 . Questions? Thanks for listening! NVM Solutions Group 27
28 .


