- 快召唤伙伴们来围观吧
- 微博 QQ QQ空间 贴吧
- 文档嵌入链接
- 复制
- 微信扫一扫分享
- 已成功复制到剪贴板
Untapping PMM full potential
自定义功能
关于作者
Agustin Gallego
Agustín joined Percona’s Support team in December 2013, after being part of the Administrative team from February 2012. He has previously worked as a Cambridge IT examinations Supervisor and as a Junior BI, SQL & C# developer. He is studying to get a Computer Systems Engineer degree at the Universidad de la República, in Uruguay. He lives in Montevideo, and when he is not working or studying he likes to spend his time playing music, reading and finding new places in the city for his favourite hobby: taking photographs using his old film cameras.
展开查看详情
1 . Untapping PMM's Full Potential: Features For Customizing It Percona University Montevideo Agustín Gallego Support Engineer April 23rd, 2019 1 © 2019 Percona
2 .Agenda ▪ What is Percona Monitoring and Management (PMM)? ▪ How to extend its functionality ▪ Adding external exporters ▪ Getting data from custom queries ▪ Extending collected metrics ▪ Providing semantics to graphs with annotations 2 © 2019 Percona
3 .What is Percona Monitoring and Management? 3 © 2019 Percona
4 .What is Percona Monitoring and Management? ▪ Open Source software (as all Percona software) ▪ A collection of tools: ▪ Prometheus ▪ Grafana ▪ Nginx ▪ Consul ▪ Query Analytics ▪ PostgreSQL (MySQL in v1) ▪ https://github.com/percona/pmm/tree/PMM-2.0 4 © 2019 Percona
5 .What is Percona Monitoring and Management? 5 © 2019 Percona
6 .What is Percona Monitoring and Management? ▪ It's easy to deploy and test drive! ▪ https://www.percona.com/doc/percona-monitoring-and- management/deploy/index.html ▪ There are three deployment methods: ▪ Docker ▪ OVA (Open Virtual Appliance) ▪ AMI (Amazon Machine Instance) 6 © 2019 Percona
7 .What is Percona Monitoring and Management? ▪ https://pmmdemo.percona.com/ 7 © 2019 Percona
8 .PMM's functionality 8 © 2019 Percona
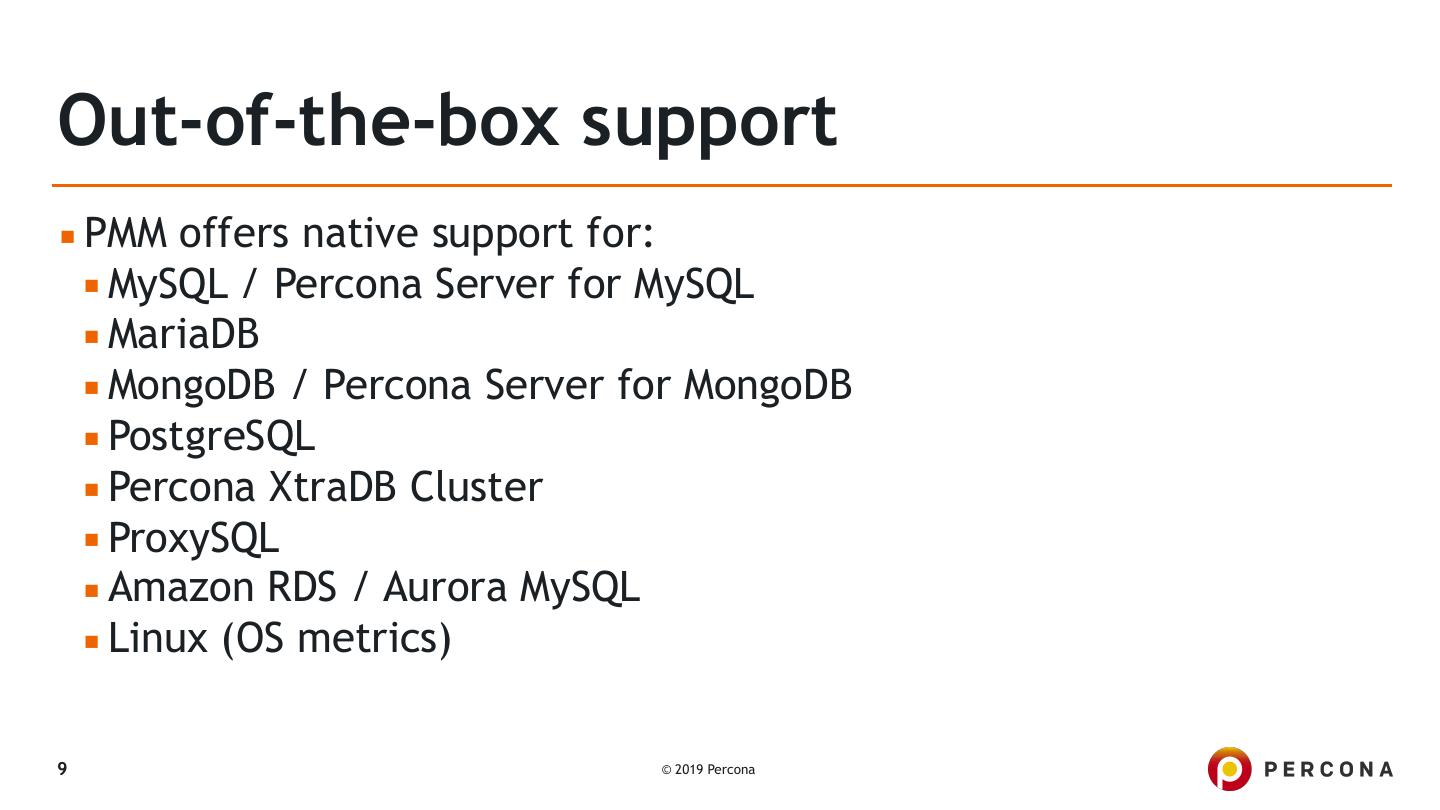
9 .Out-of-the-box support ▪ PMM offers native support for: ▪ MySQL / Percona Server for MySQL ▪ MariaDB ▪ MongoDB / Percona Server for MongoDB ▪ PostgreSQL ▪ Percona XtraDB Cluster ▪ ProxySQL ▪ Amazon RDS / Aurora MySQL ▪ Linux (OS metrics) 9 © 2019 Percona
10 .Extending PMM's functionality 10 © 2019 Percona
11 .Extending PMM's functionality ▪ We are going to go through four different ways: ▪ Adding external exporters ▪ Getting data from custom queries ▪ Getting data from custom scripts ▪ Providing semantics to graphs with annotations 11 © 2019 Percona
12 .Adding external exporters 12 © 2019 Percona
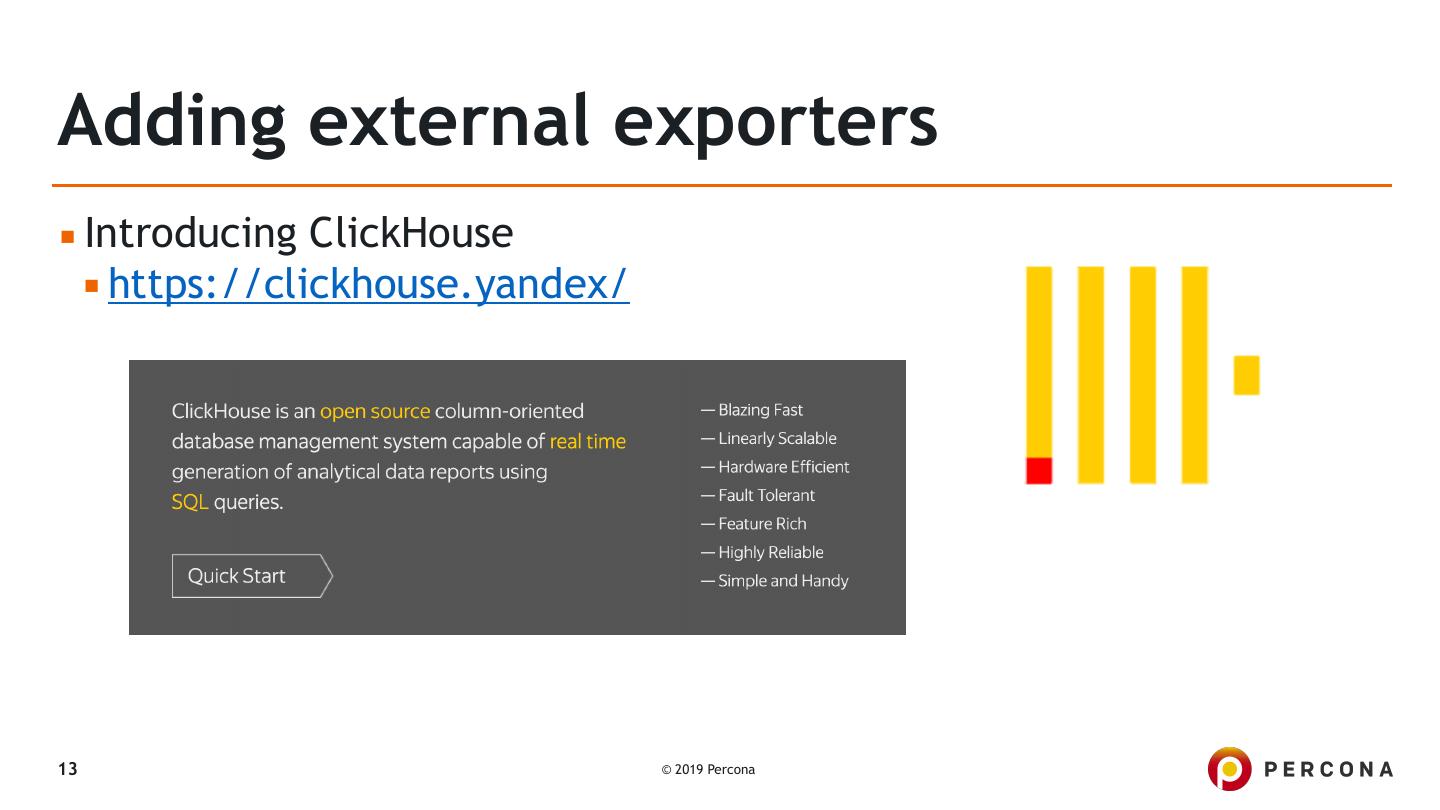
13 .Adding external exporters ▪ Introducing ClickHouse ▪ https://clickhouse.yandex/ 13 © 2019 Percona
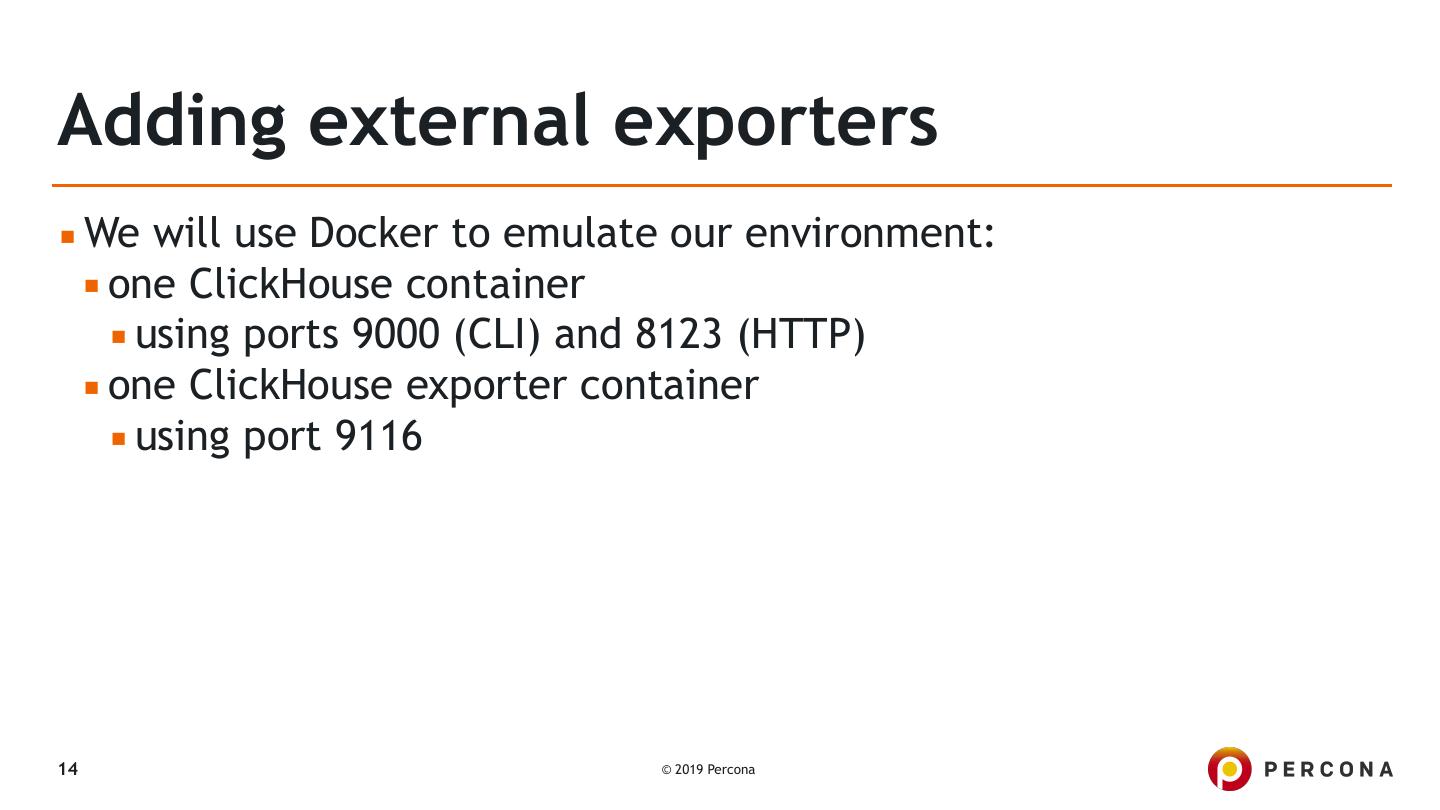
14 .Adding external exporters ▪ We will use Docker to emulate our environment: ▪ one ClickHouse container ▪ using ports 9000 (CLI) and 8123 (HTTP) ▪ one ClickHouse exporter container ▪ using port 9116 14 © 2019 Percona
15 .Adding external exporters agustin@bm-support01 ~ $ docker network create --driver bridge clickhouse-network d7f02a5841bceffb2cf3455aa0322244c9bef74a8aa4607665ea5f255085bda0 agustin@bm-support01 ~ $ docker run -d \ > --publish 8123:8123 \ > --publish 9000:9000 \ > --name clickhouse \ > --network clickhouse-network \ > guriandoro/clickhouse-pmm:1.0 0c5bc6e217ebab9a862076d90fe1ebc0681c71093770cb170bbaea9353380993 agustin@bm-support01 ~ $ curl 'http://localhost:8123/' Ok. 15 © 2019 Percona
16 .Adding external exporters agustin@bm-support01 ~ $ docker run -it --rm --network host yandex/clickhouse-client --host localhost ClickHouse client version 19.5.2.6 (official build). Connecting to localhost:9000 as user default. Connected to ClickHouse server version 1.1.54380 revision 54380. 0c5bc6e217eb :) show databases; SHOW DATABASES !"name""""# $ default $ $ system $ %"""""""""& 2 rows in set. Elapsed: 0.014 sec. 16 © 2019 Percona
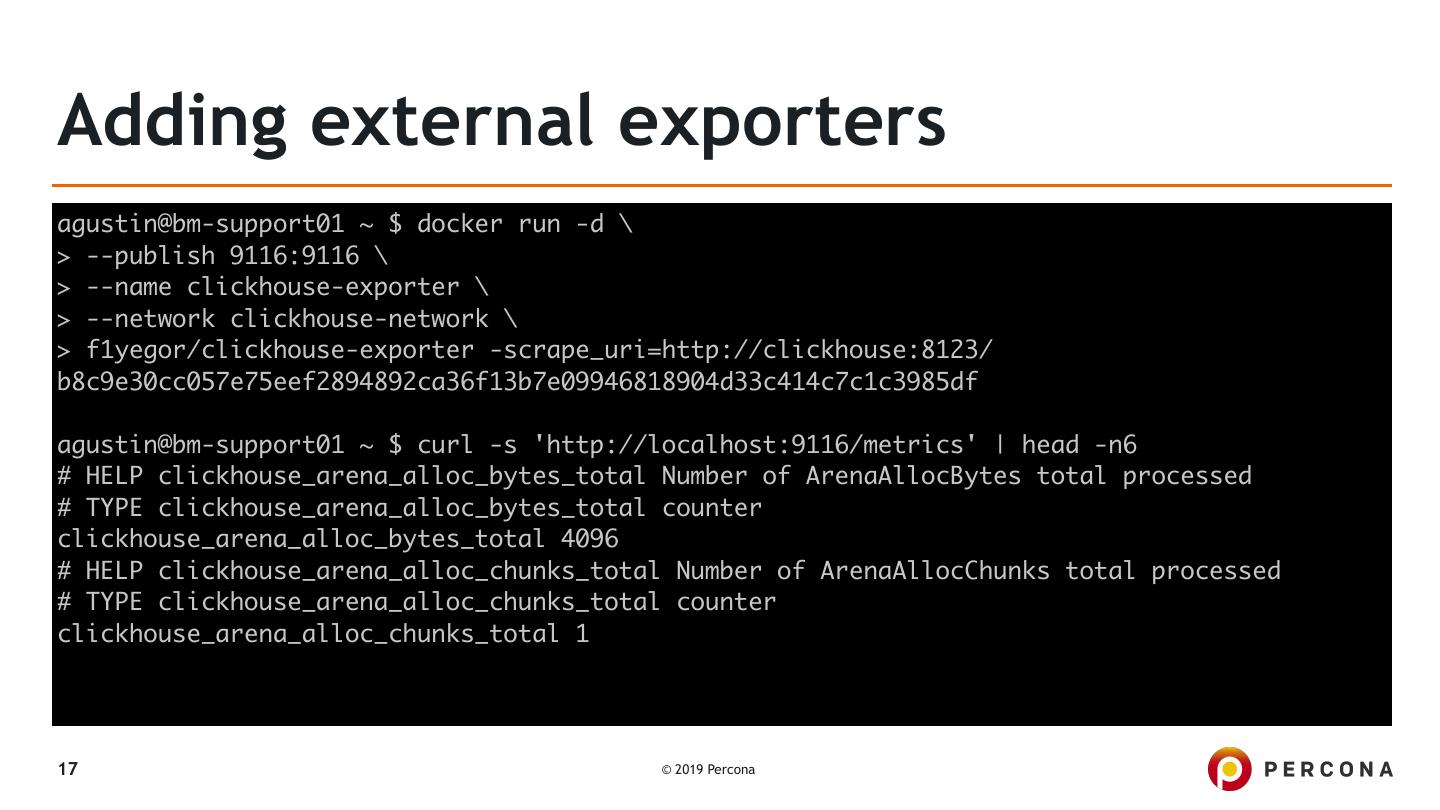
17 .Adding external exporters agustin@bm-support01 ~ $ docker run -d \ > --publish 9116:9116 \ > --name clickhouse-exporter \ > --network clickhouse-network \ > f1yegor/clickhouse-exporter -scrape_uri=http://clickhouse:8123/ b8c9e30cc057e75eef2894892ca36f13b7e09946818904d33c414c7c1c3985df agustin@bm-support01 ~ $ curl -s 'http://localhost:9116/metrics' | head -n6 # HELP clickhouse_arena_alloc_bytes_total Number of ArenaAllocBytes total processed # TYPE clickhouse_arena_alloc_bytes_total counter clickhouse_arena_alloc_bytes_total 4096 # HELP clickhouse_arena_alloc_chunks_total Number of ArenaAllocChunks total processed # TYPE clickhouse_arena_alloc_chunks_total counter clickhouse_arena_alloc_chunks_total 1 17 © 2019 Percona
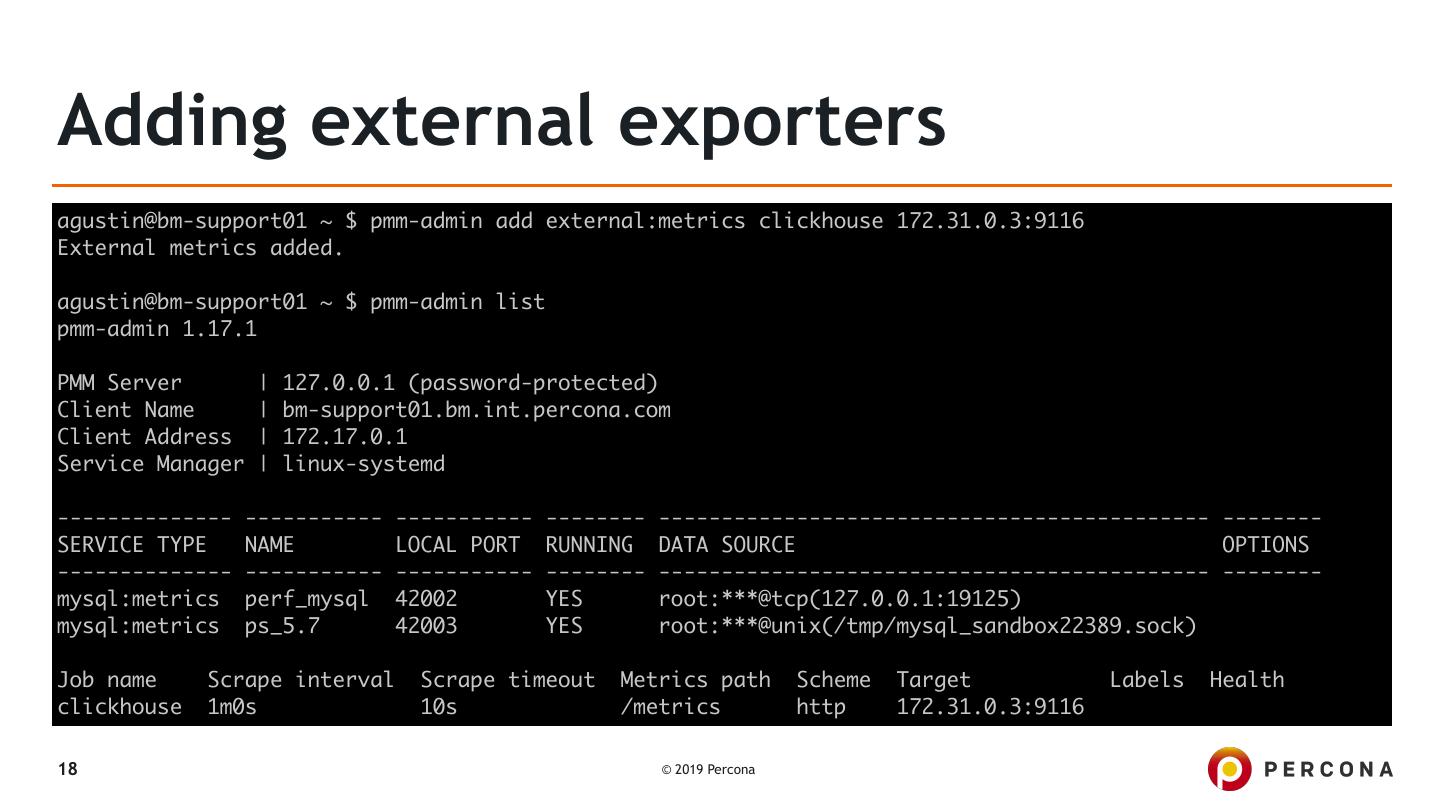
18 .Adding external exporters agustin@bm-support01 ~ $ pmm-admin add external:metrics clickhouse 172.31.0.3:9116 External metrics added. agustin@bm-support01 ~ $ pmm-admin list pmm-admin 1.17.1 PMM Server | 127.0.0.1 (password-protected) Client Name | bm-support01.bm.int.percona.com Client Address | 172.17.0.1 Service Manager | linux-systemd -------------- ----------- ----------- -------- -------------------------------------------- -------- SERVICE TYPE NAME LOCAL PORT RUNNING DATA SOURCE OPTIONS -------------- ----------- ----------- -------- -------------------------------------------- -------- mysql:metrics perf_mysql 42002 YES root:***@tcp(127.0.0.1:19125) mysql:metrics ps_5.7 42003 YES root:***@unix(/tmp/mysql_sandbox22389.sock) Job name Scrape interval Scrape timeout Metrics path Scheme Target Labels Health clickhouse 1m0s 10s /metrics http 172.31.0.3:9116 18 © 2019 Percona
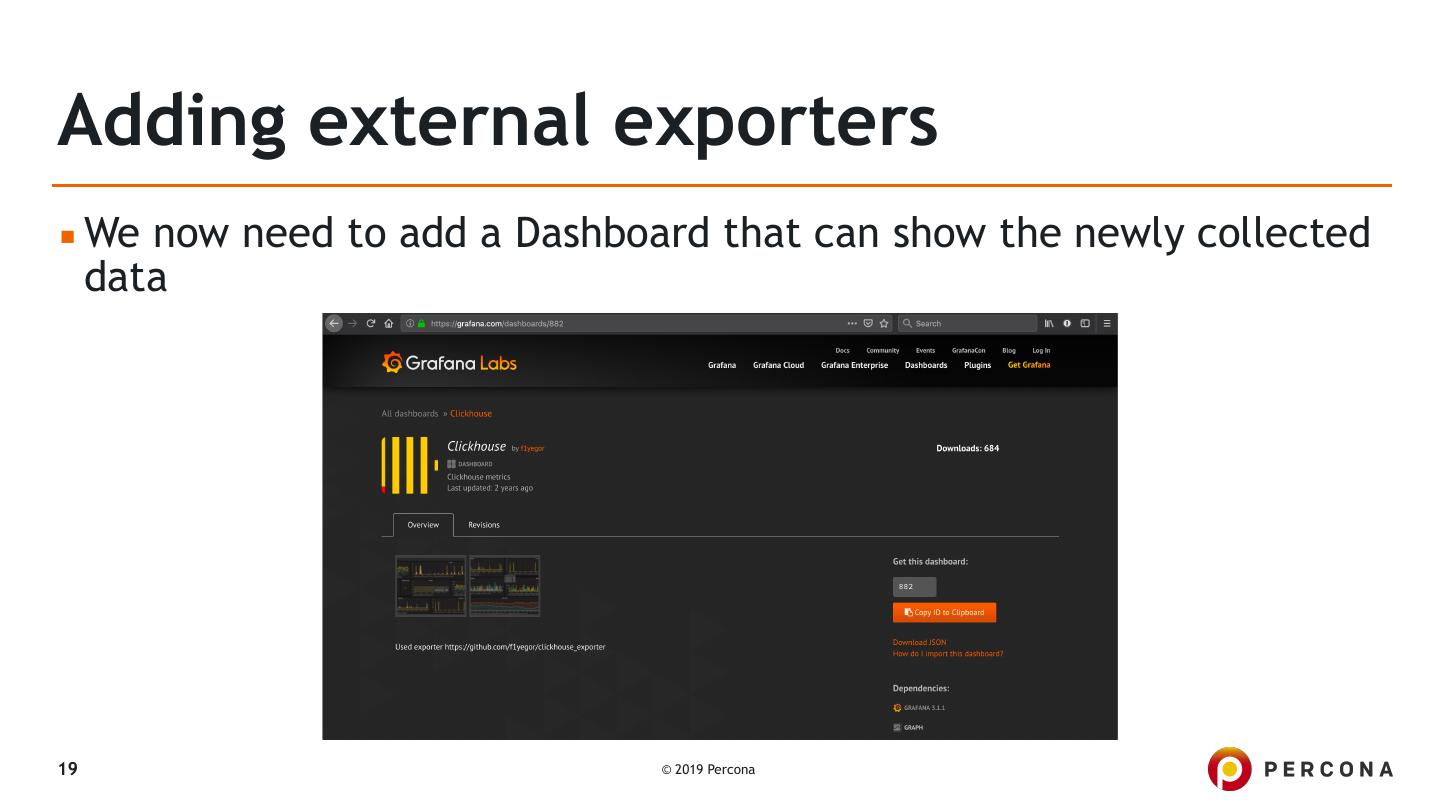
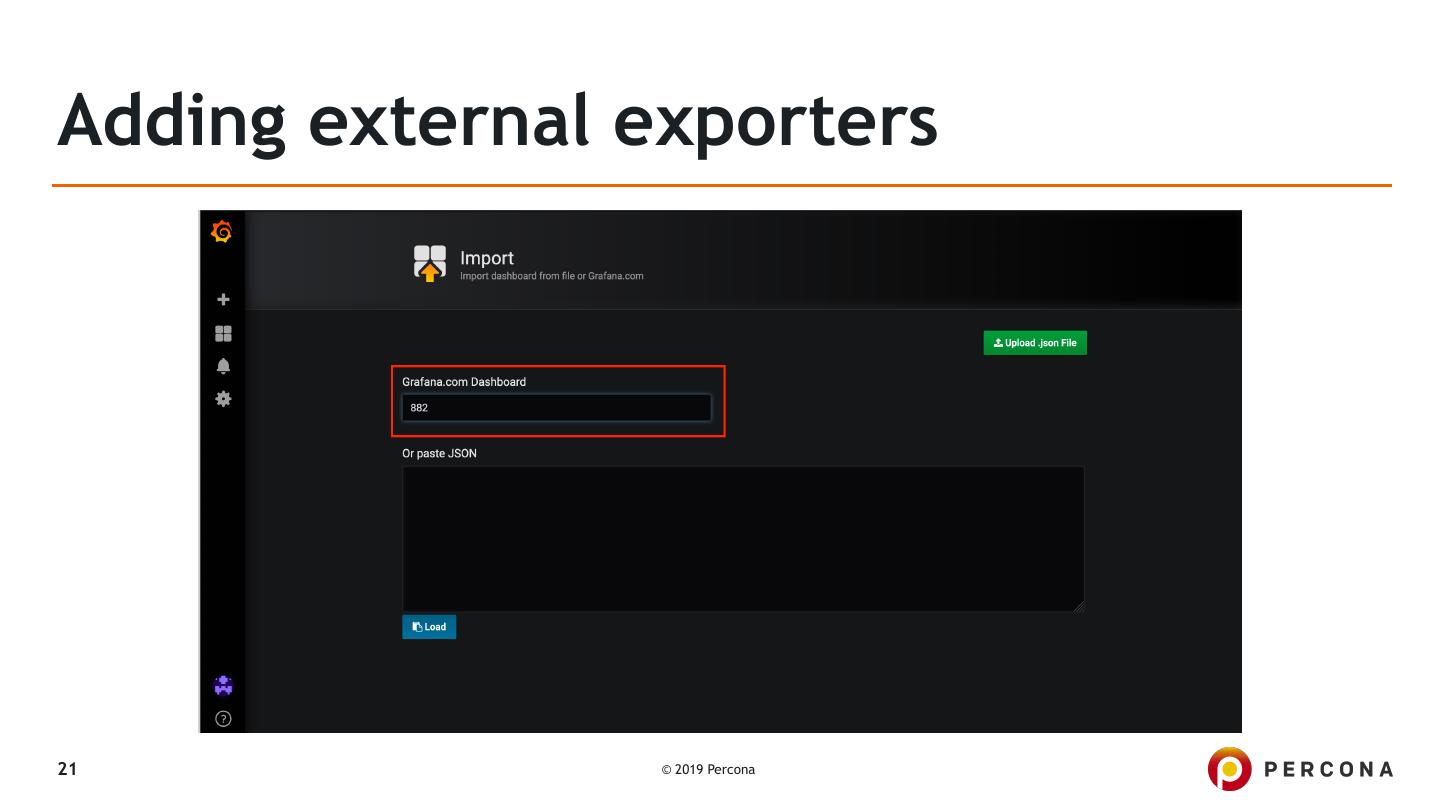
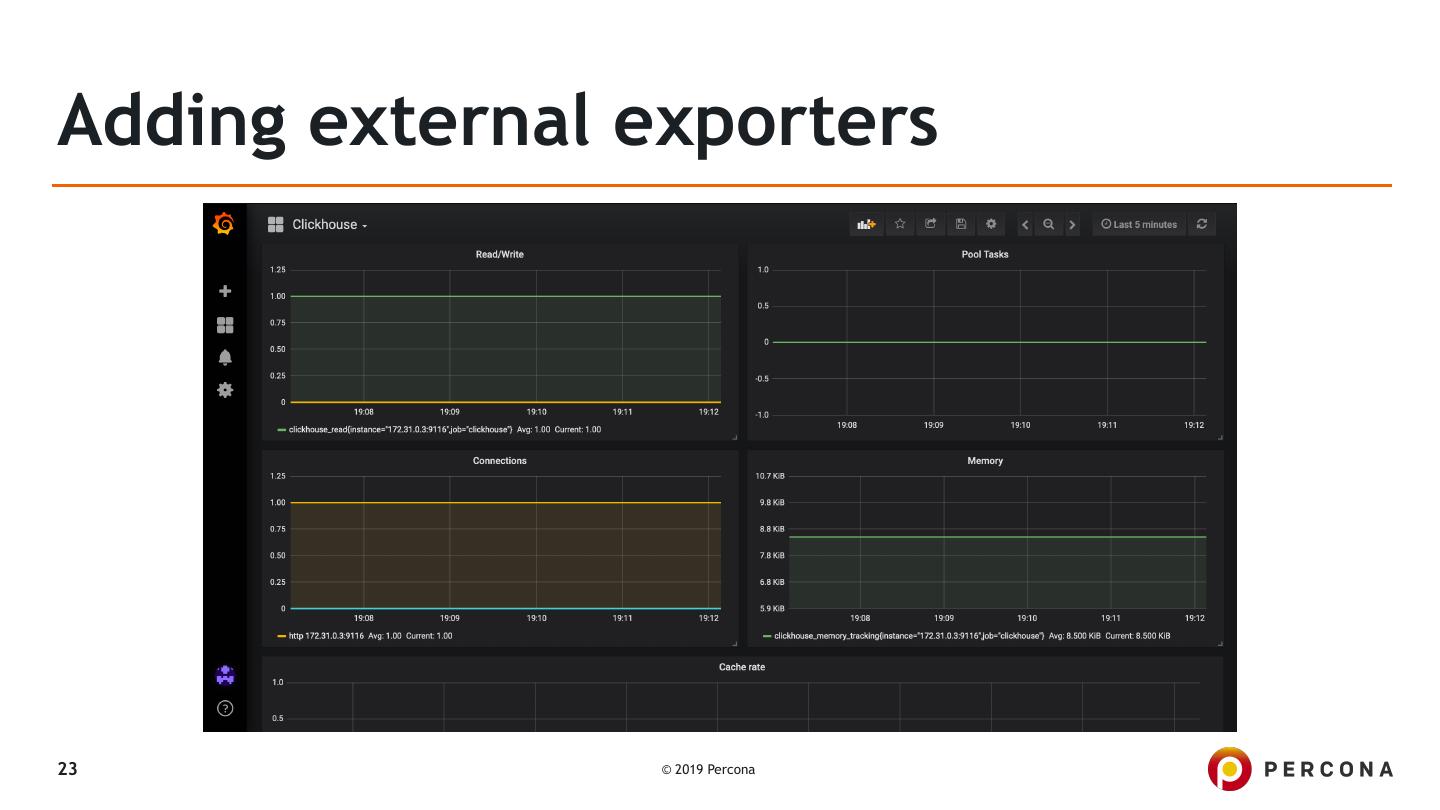
19 .Adding external exporters ▪ We now need to add a Dashboard that can show the newly collected data 19 © 2019 Percona
20 .Adding external exporters 20 © 2019 Percona
21 .Adding external exporters 21 © 2019 Percona
22 .Adding external exporters 22 © 2019 Percona
23 .Adding external exporters 23 © 2019 Percona
24 .Getting data from custom queries 24 © 2019 Percona
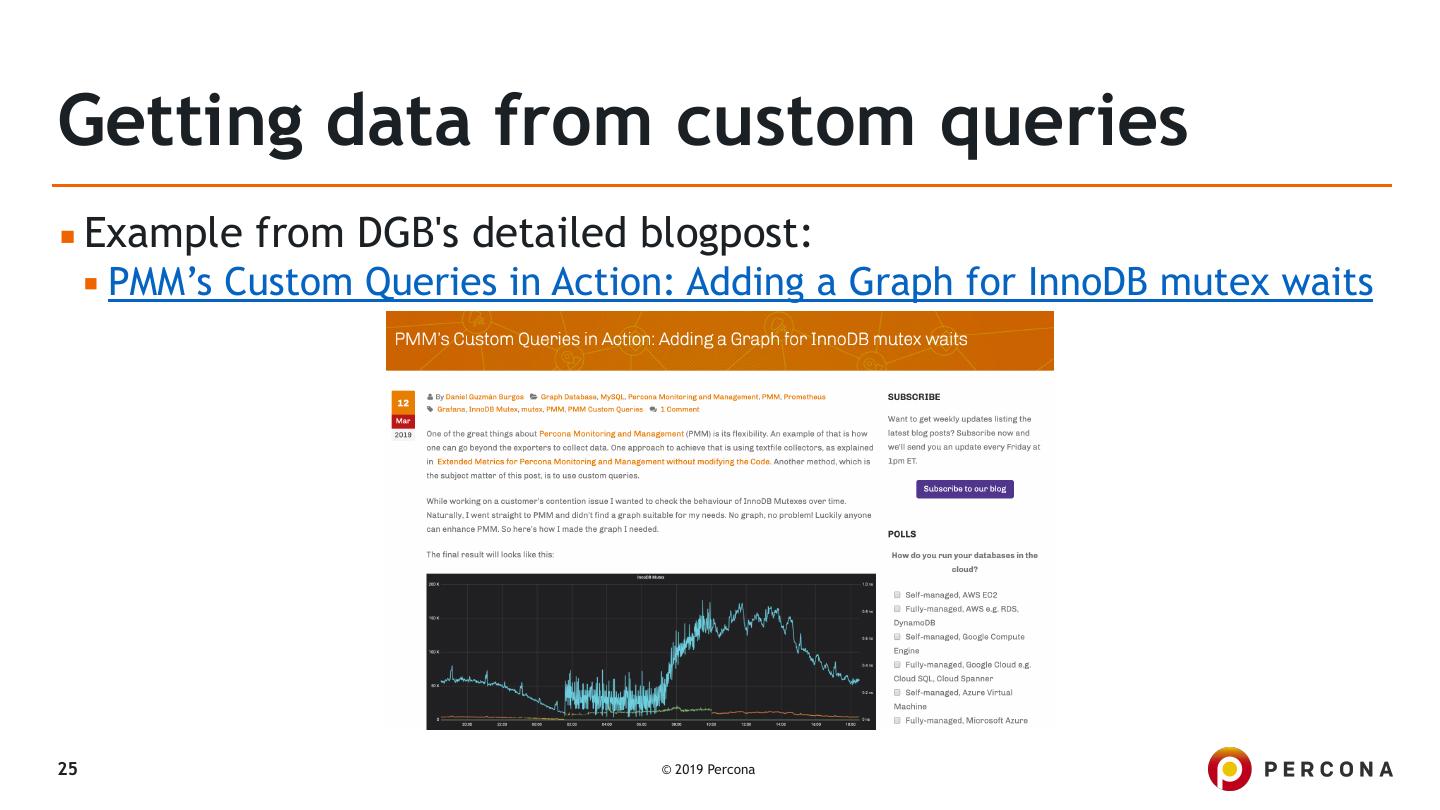
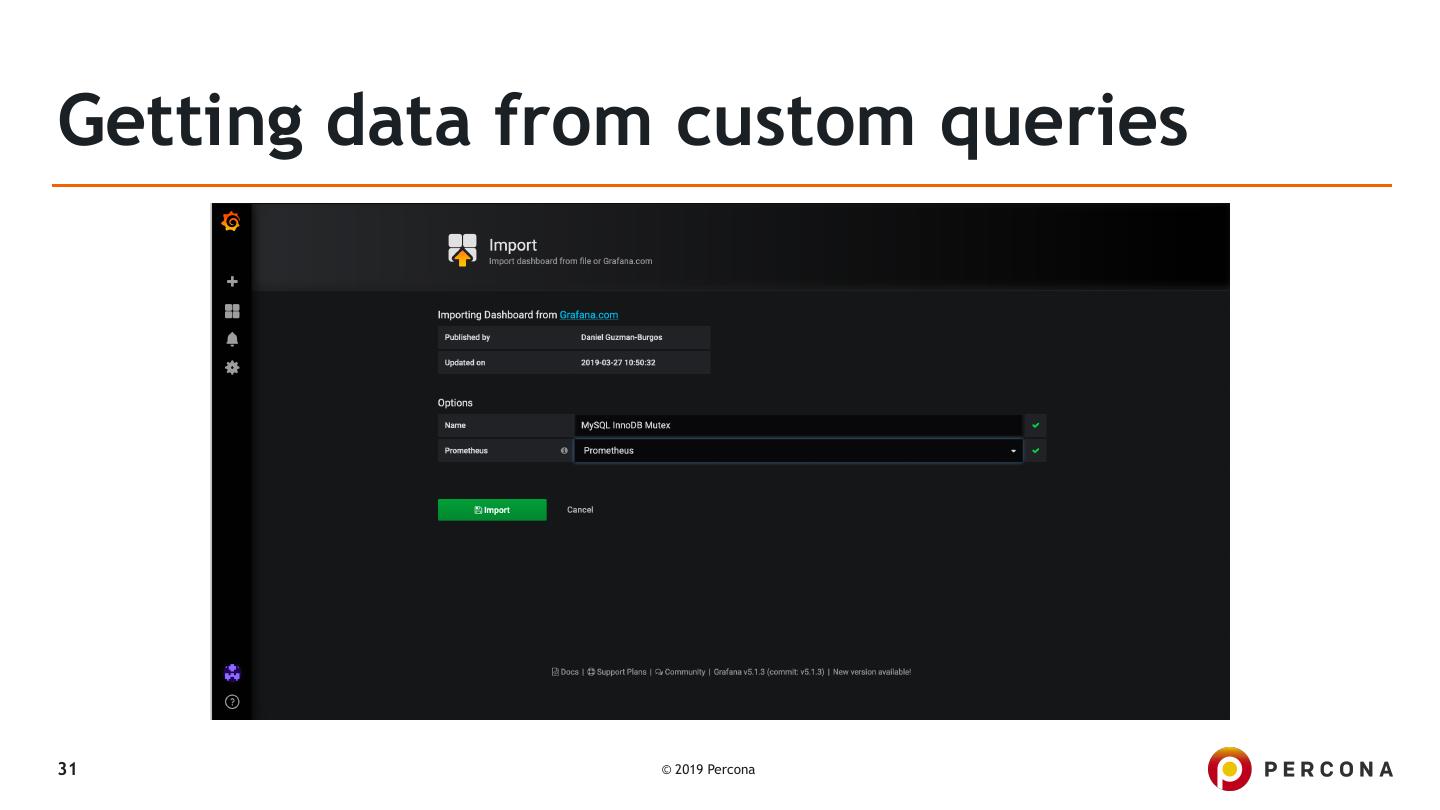
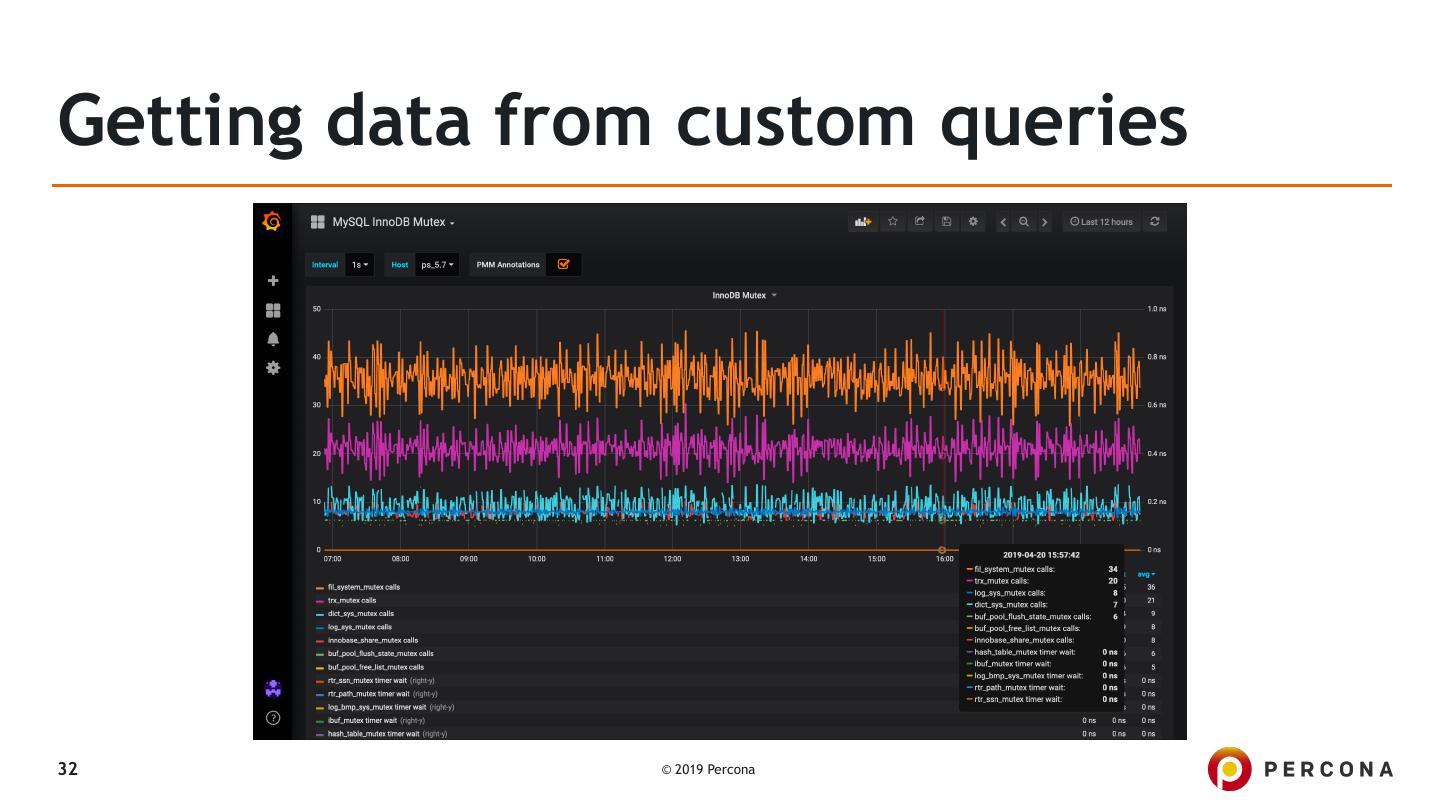
25 .Getting data from custom queries ▪ Example from DGB's detailed blogpost: ▪ PMM’s Custom Queries in Action: Adding a Graph for InnoDB mutex waits 25 © 2019 Percona
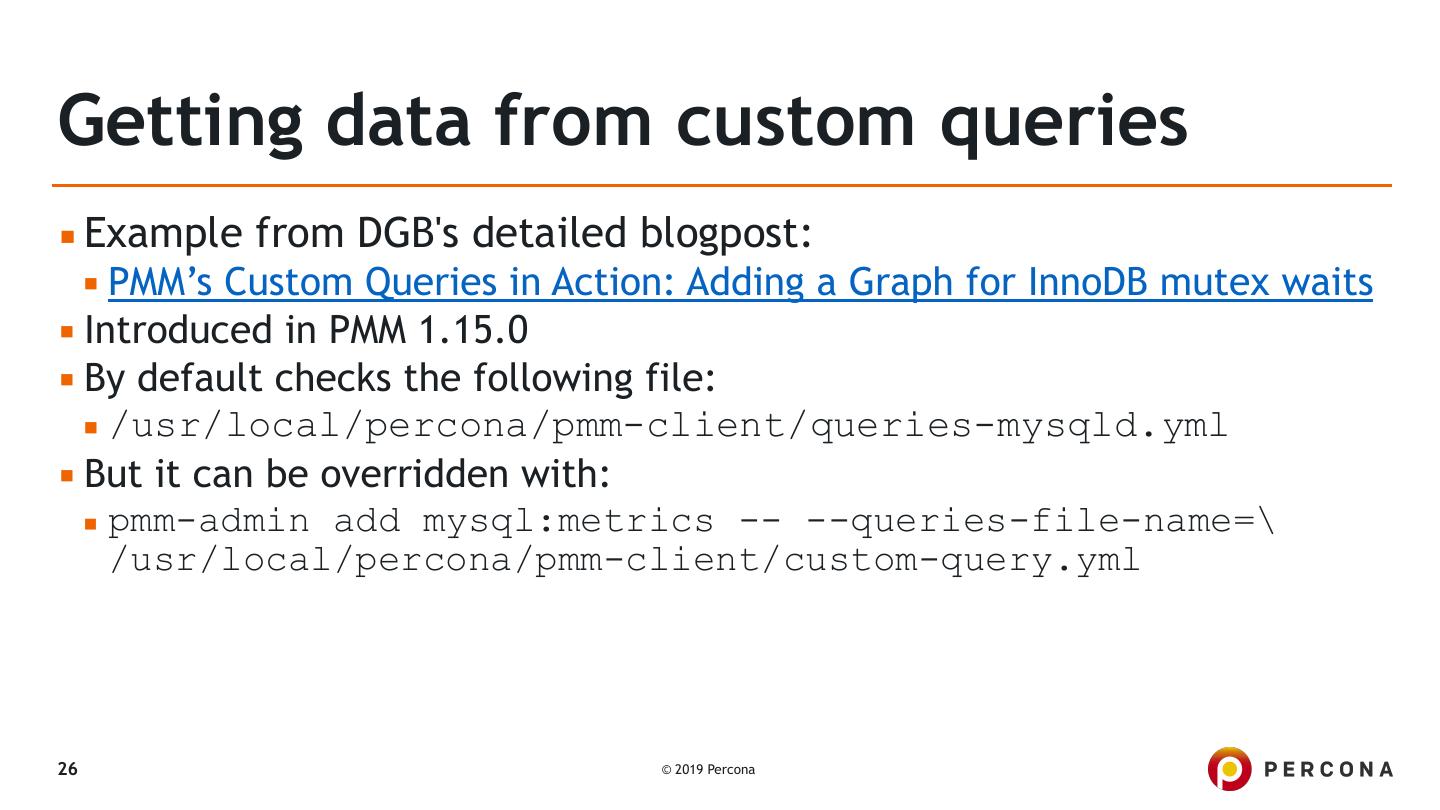
26 .Getting data from custom queries ▪ Example from DGB's detailed blogpost: ▪ PMM’s Custom Queries in Action: Adding a Graph for InnoDB mutex waits ▪ Introduced in PMM 1.15.0 ▪ By default checks the following file: ▪ /usr/local/percona/pmm-client/queries-mysqld.yml ▪ But it can be overridden with: ▪ pmm-admin add mysql:metrics -- --queries-file-name=\ /usr/local/percona/pmm-client/custom-query.yml 26 © 2019 Percona
27 .Getting data from custom queries mysql> SELECT @@global.performance_schema; +-----------------------------+ | @@global.performance_schema | +-----------------------------+ | 1 | +-----------------------------+ 1 row in set (0.00 sec) mysql> UPDATE performance_schema.setup_instruments SET enabled='YES' WHERE name LIKE 'wait/ synch/mutex/innodb%'; Query OK, 63 rows affected (0.01 sec) Rows matched: 63 Changed: 63 Warnings: 0 mysql> UPDATE performance_schema.setup_consumers SET enabled='YES' WHERE name LIKE 'events_waits%'; Query OK, 3 rows affected (0.00 sec) Rows matched: 3 Changed: 3 Warnings: 0 27 © 2019 Percona
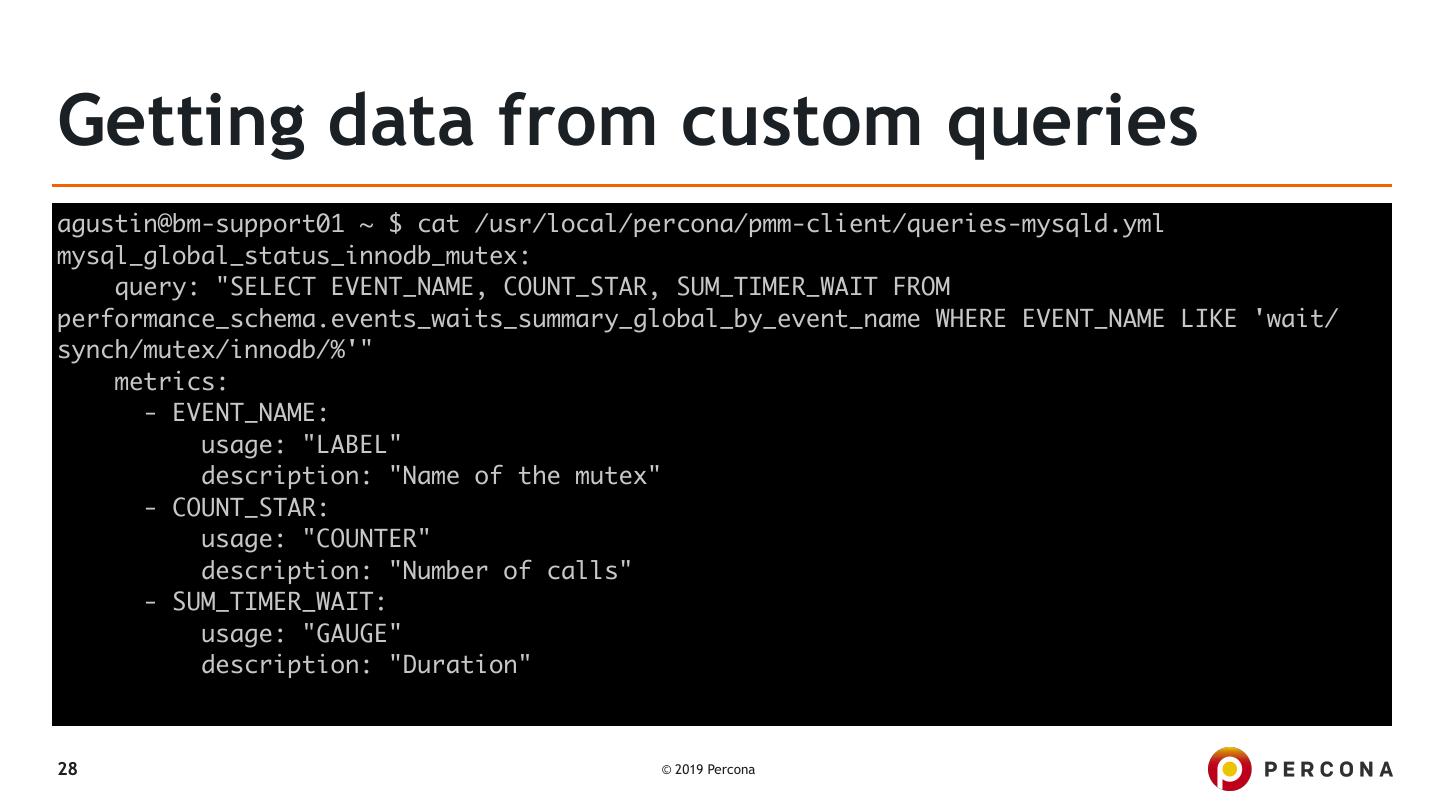
28 .Getting data from custom queries agustin@bm-support01 ~ $ cat /usr/local/percona/pmm-client/queries-mysqld.yml mysql_global_status_innodb_mutex: query: "SELECT EVENT_NAME, COUNT_STAR, SUM_TIMER_WAIT FROM performance_schema.events_waits_summary_global_by_event_name WHERE EVENT_NAME LIKE 'wait/ synch/mutex/innodb/%'" metrics: - EVENT_NAME: usage: "LABEL" description: "Name of the mutex" - COUNT_STAR: usage: "COUNTER" description: "Number of calls" - SUM_TIMER_WAIT: usage: "GAUGE" description: "Duration" 28 © 2019 Percona
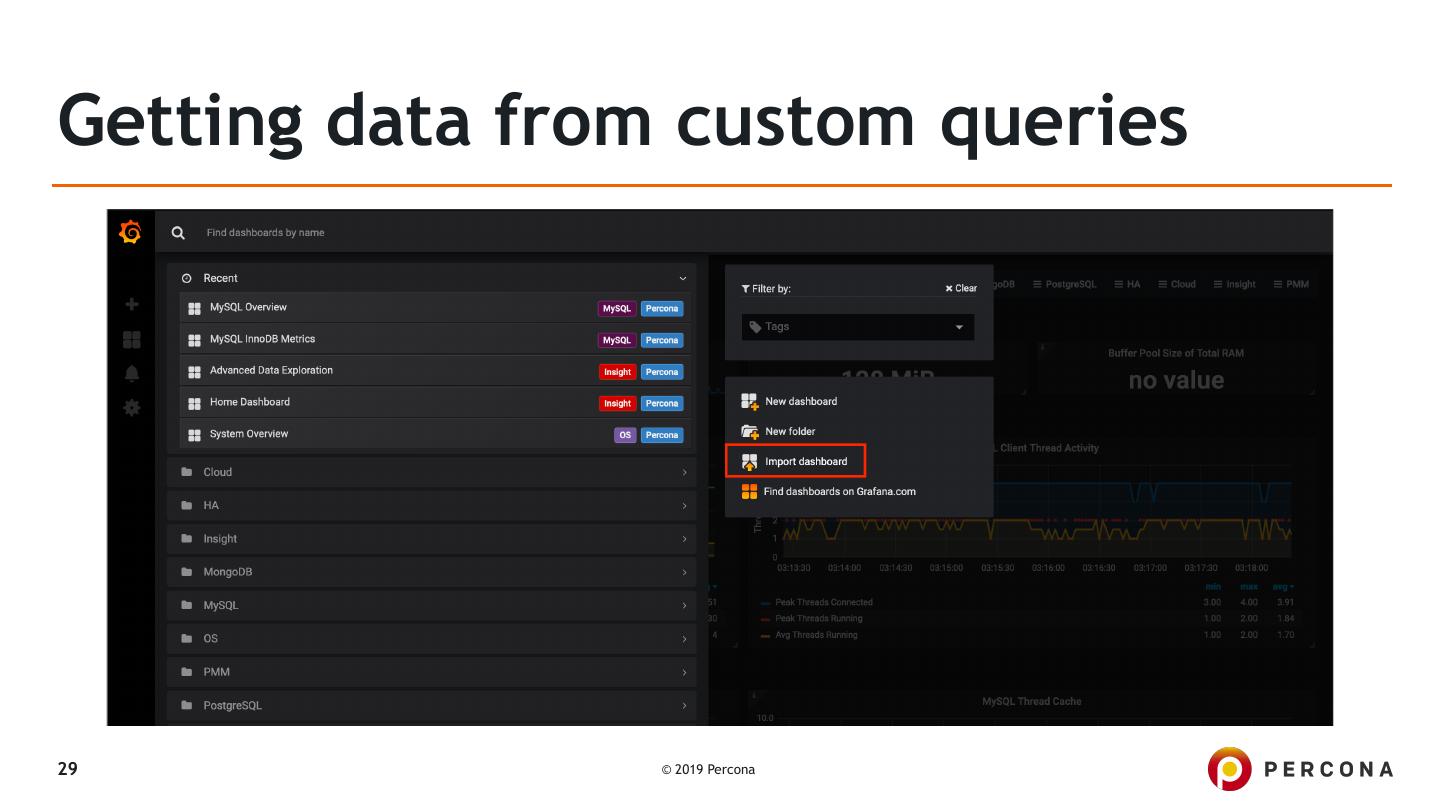
29 .Getting data from custom queries 29 © 2019 Percona


