- 快召唤伙伴们来围观吧
- 微博 QQ QQ空间 贴吧
- 文档嵌入链接
- 复制
- 微信扫一扫分享
- 已成功复制到剪贴板
Problem Identification and Resolution using PMM - A Case Study
在MySQL中,您是否在识别问题上遇到过困难?
来听听Verisure是如何通过PMM(Percona监测和管理)发现和解决问题的。Verisure能够找到有问题的查询/调优参数,进行修改,然后通过PMM观察随着时间的推移所产生的影响。
展开查看详情
1 .Problem Identification and Resolution Using PMM - A Case Study Johan Nilsson - Verisure Michael Coburn - Percona
2 .About Us Michael Coburn Johan Nilsson Product Manager, Percona Senior DBA, Verisure Innovation, Sweden • PMM and Percona Toolkit johan.nilsson@verisure.com • Joined Percona seven years ago as • Unix/Linux system administrator since 1999 a MySQL Consultant • MySQL/Oracle DBA since 2008 2
3 .PMM Background
4 .About PMM ● Open Source database troubleshooting and optimization tool ● Architecture - client/server ● Dashboards for MySQL, MongoDB, and PostgreSQL + OS ● Query Analytics - identify the queries consuming the most amount of time ● Runs in your environment (not a SaaS) 4
5 .PMM Distribution Methods 1. docker ○ docker pull percona/pmm-server:1 2. Virtual Appliance ○ Supports VMware, RedHat Virtualization, Microsoft Systems Center ○ … and VirtualBox! 3. AWS Marketplace ○ Production-ready AMI running in EC2 5
6 .AWS Marketplace ● Deploy directly to EC2 ● Running CentOS 7 Search for "pmm" or "Percona Monitoring and Management" https://aws.amazon.com/marketplace/pp/B077J7FYGX 6
7 .PMM Architecture ● pmm-client (eg. MySQL host) ○ mysqld_exporter - MySQL metrics ○ node_exporter - Linux/OS metrics ○ qan-agent - Query Analytics ● PMM Server ○ Query Analytics ■ QAN API and QAN Application ○ Metrics Monitor ■ Prometheus ■ Grafana 7
8 .Verisure Innovation
9 .About Verisure ● European leader in monitored alarm systems ● Present in 14 countries ● 3 million+ customers ● 10k employees ● Building the full stack inhouse ● Two innovation centers ○ Malmö (Sweden) ○ Madrid (Spain) ● Yes, we are hiring! https://verisure.avature.net/careers 9
10 .Verisure Versus MySQL ● Core application running in Sybase ASE ● “Bulk” installation data stored in MySQL ○ Driving mobile app and web page ○ Clustered, multi-site setup ● “Always on” - 100% uptime on the service ○ We are in the alarm monitoring business… ● Growing fast, adding 1 MySQL server-pair every 4th week 1 0
11 .Verisure vs PMM ● Why PMM? ○ Early adopter of Query Analytics, first install 2016 ■ Recommended and demonstrated by Percona consultant ○ Replaced by PMM, first install v1.0.6, 2016 ● The journey, together with Percona: ○ Some minor bugs found, and reported to Percona ○ Performance problems in early versions ■ Especially identified when monitoring many servers • Forcing us to tweak “everything” ○ Close cooperation with Percona support and developer ■ Acting in some cases as a benchmark 1 1
12 .How Are We Using PMM?
13 .How And What Are We Using PMM For? Three main uses: • Preventive statistics gathering and capacity planning • Troubleshooting during production problems • PMR and RCA - troubleshooting problems after resolving Tools in PMM • Performance graphs • Query statistics - mysql-prompt Additional benefits: • Possible to gather valuable information for bug reports, filed - Internally - MySQL 1 - Percona 3
14 .Preventive Use • Trends - using graphs ○ the mysql-instance is leaking memory… • Pattern finding ○ query statistics (mysql-cli) 1 4
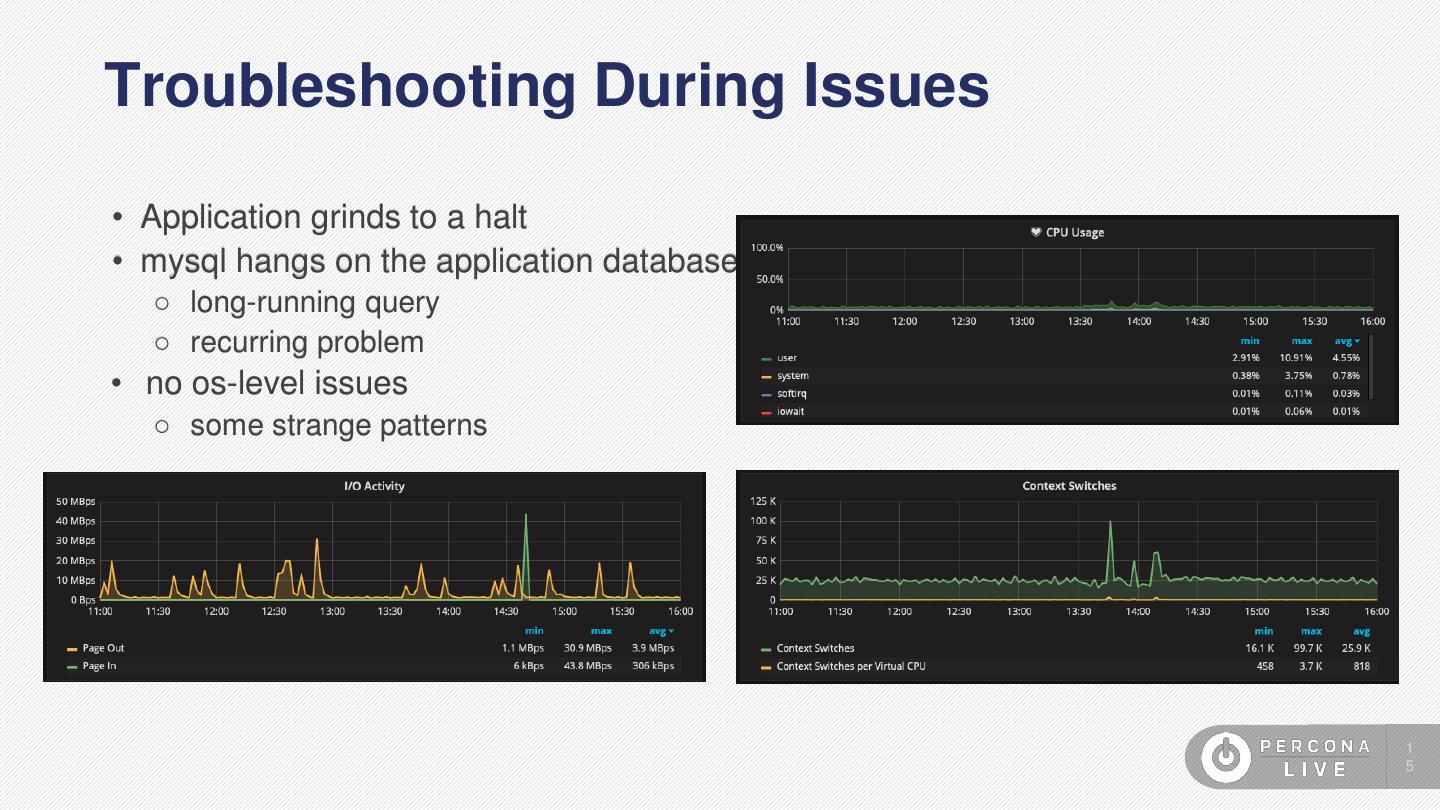
15 .Troubleshooting During Issues • Application grinds to a halt • mysql hangs on the application database ○ long-running query ○ recurring problem • no os-level issues ○ some strange patterns 1 5
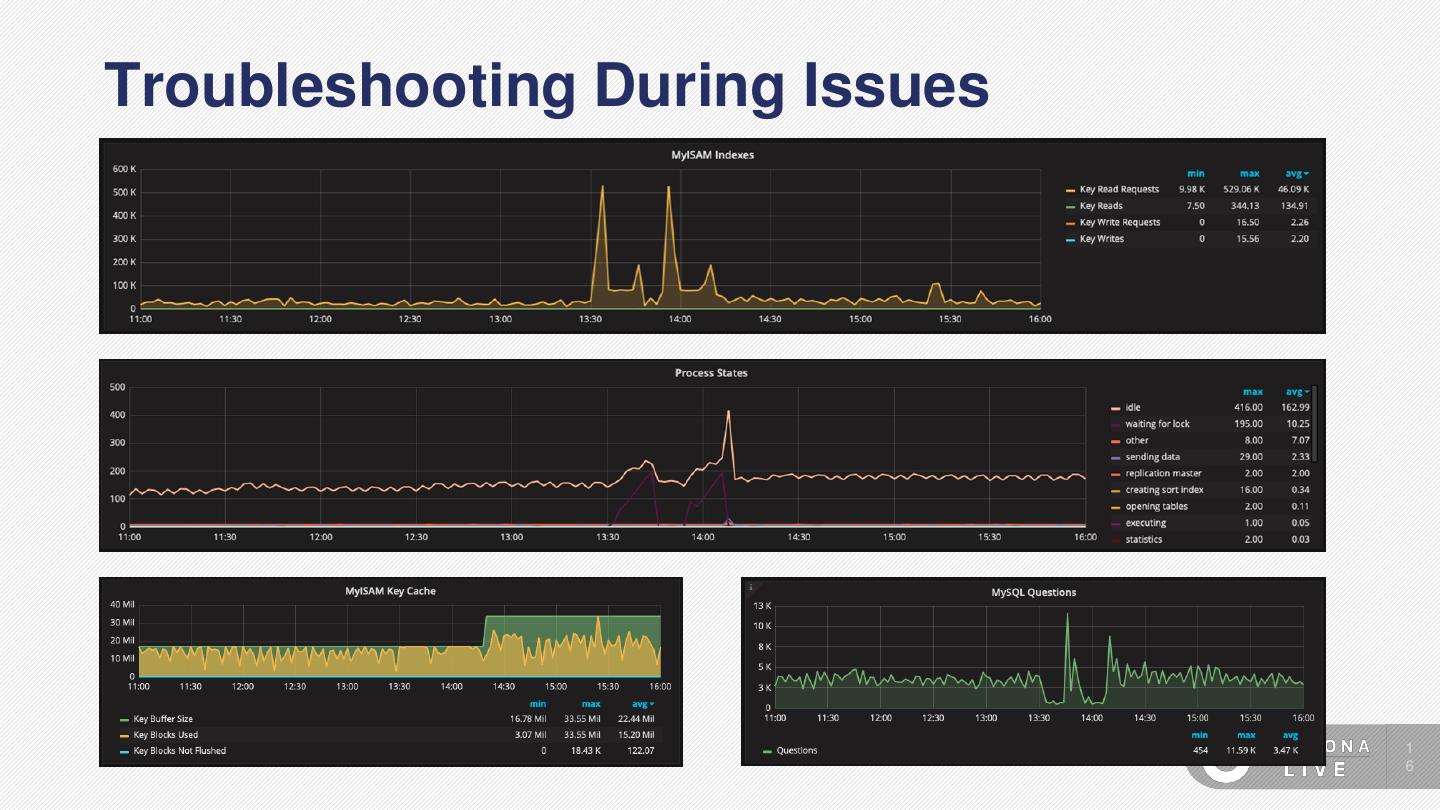
16 .Troubleshooting During Issues 1 6
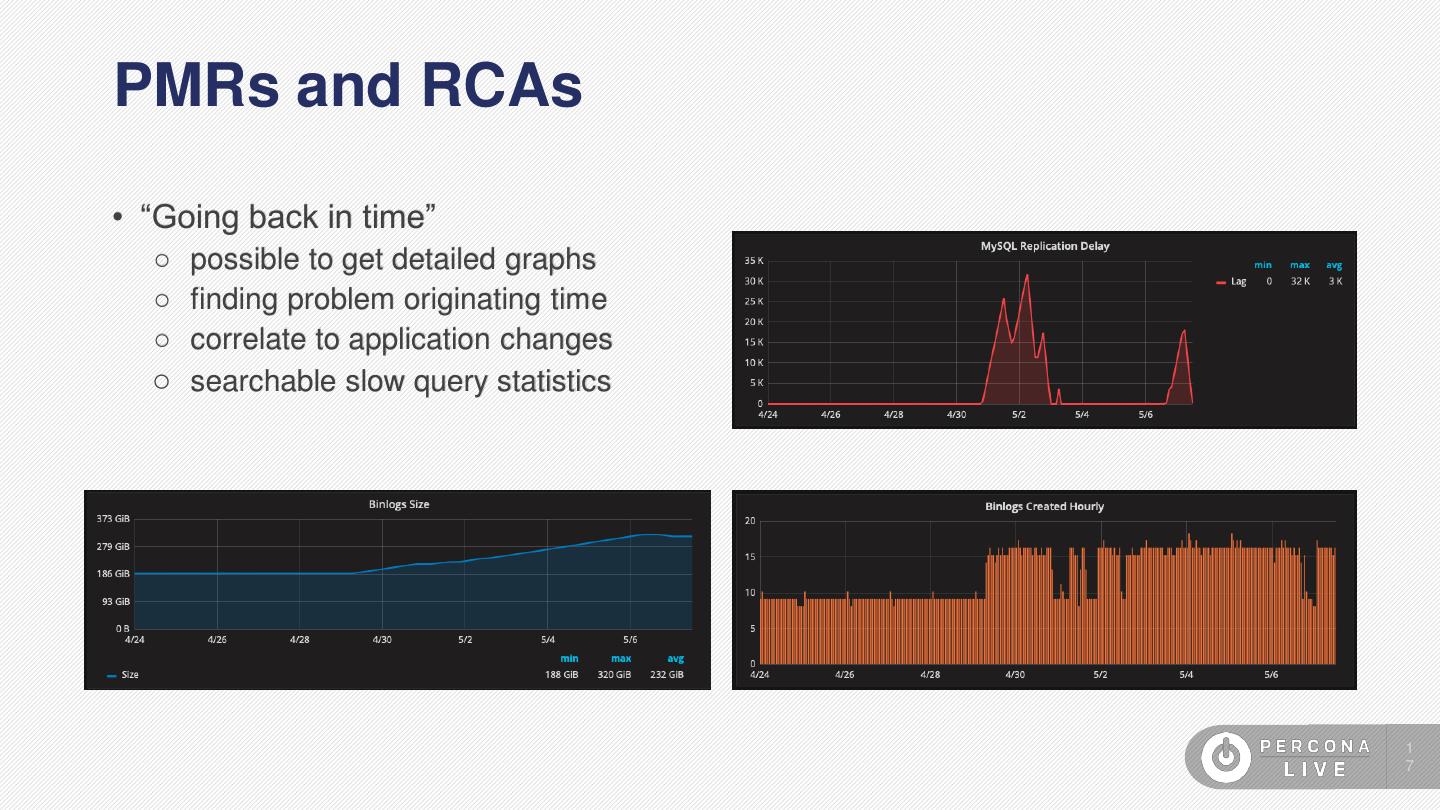
17 .PMRs and RCAs • “Going back in time” ○ possible to get detailed graphs ○ finding problem originating time ○ correlate to application changes ○ searchable slow query statistics 1 7
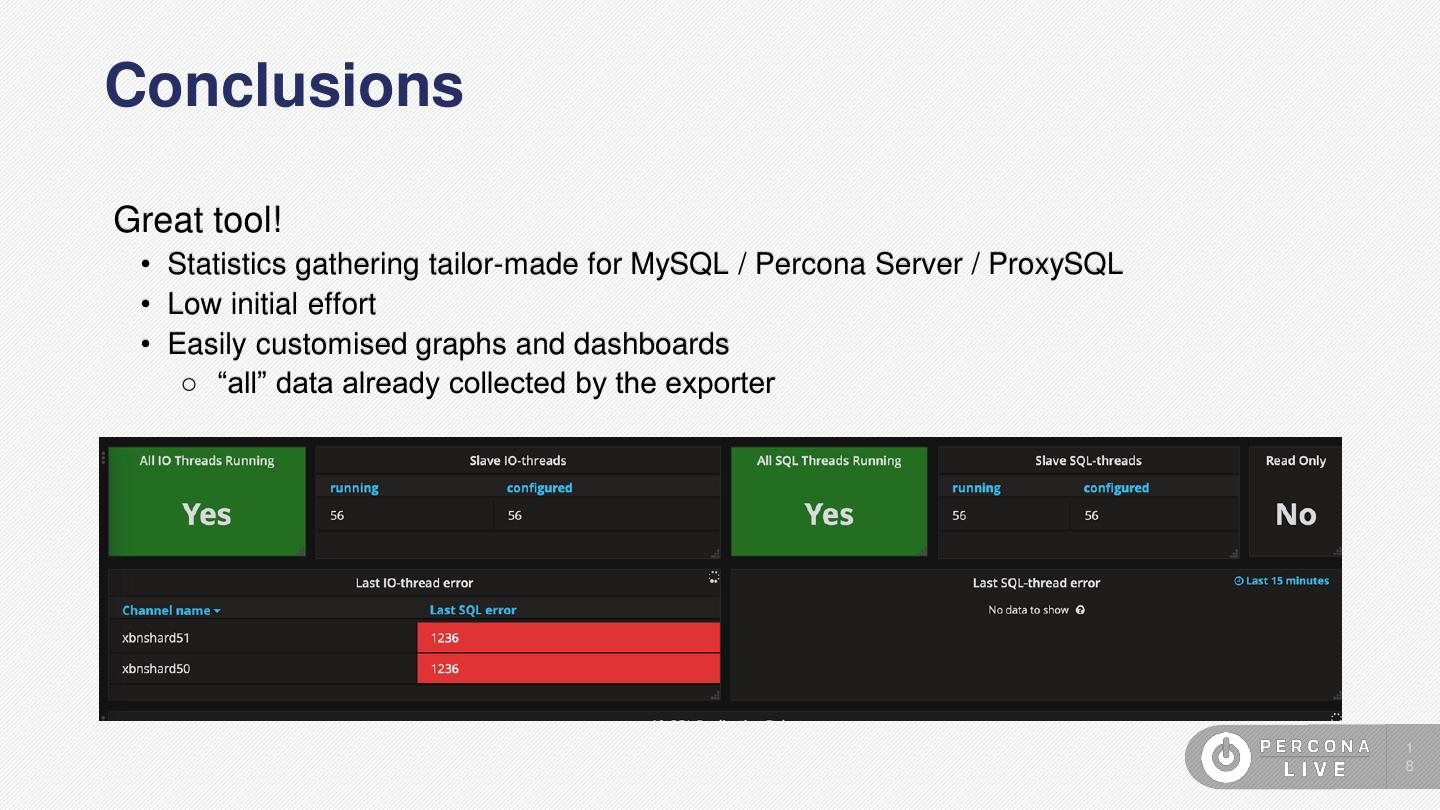
18 .Conclusions Great tool! • Statistics gathering tailor-made for MySQL / Percona Server / ProxySQL • Low initial effort • Easily customised graphs and dashboards ○ “all” data already collected by the exporter 1 8
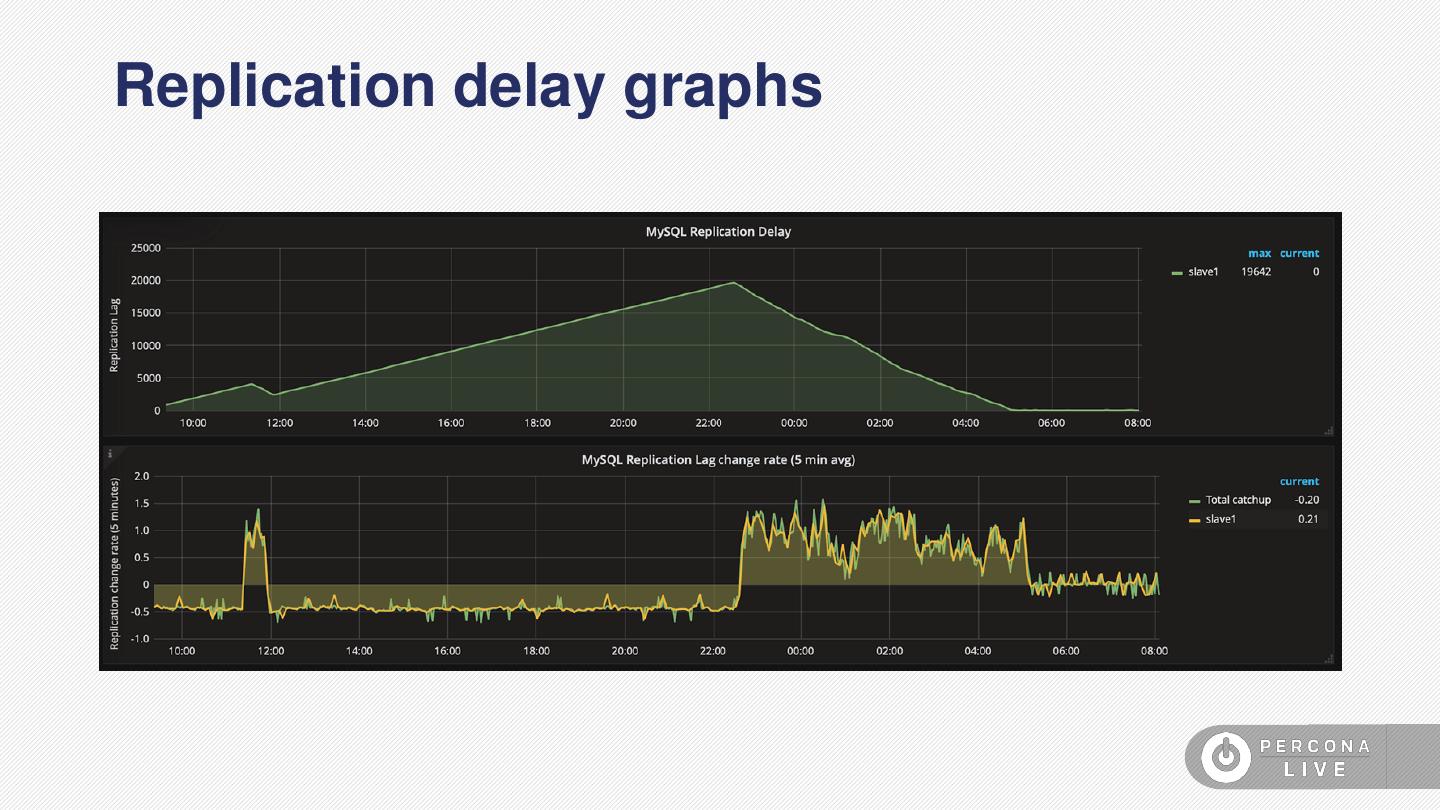
19 .Replication delay graphs
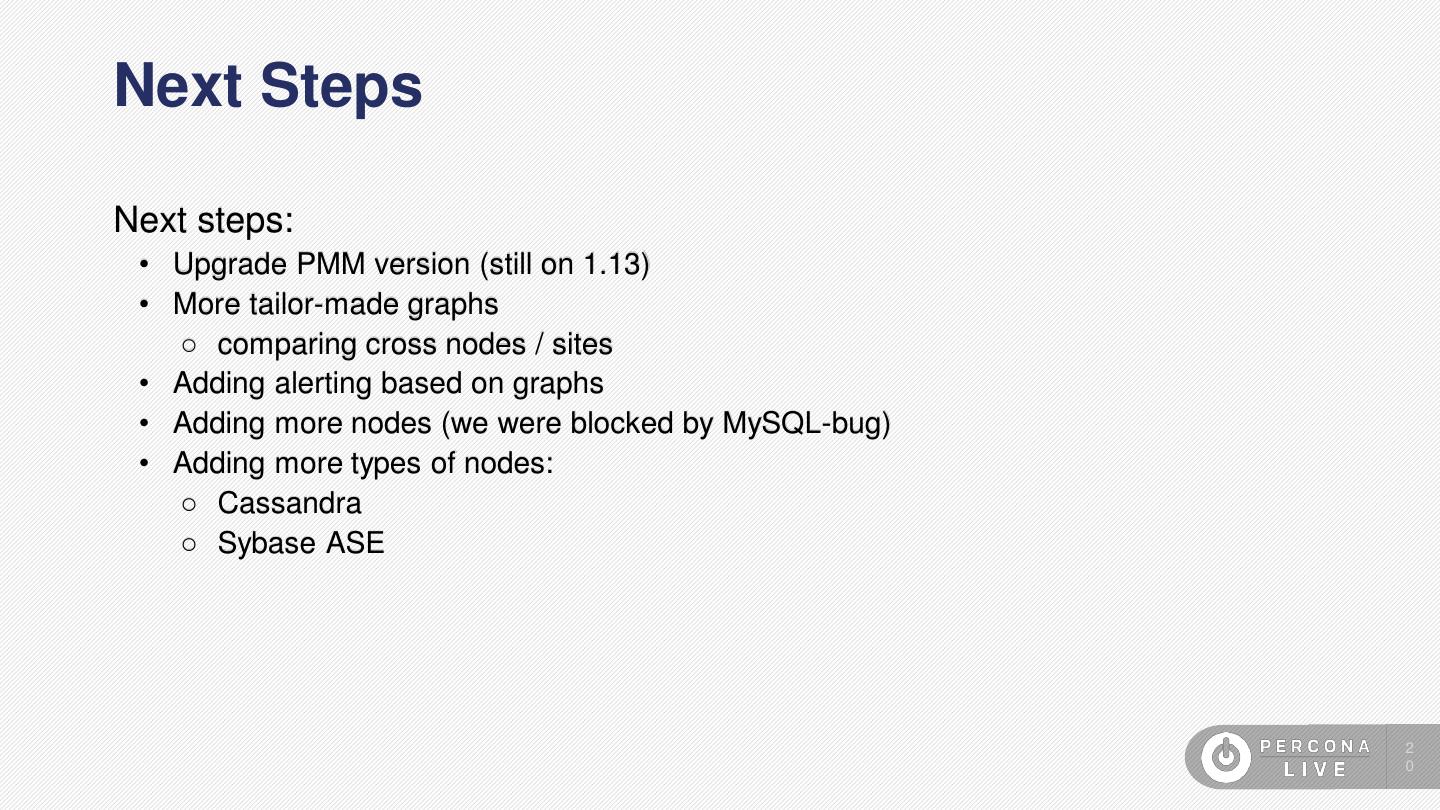
20 .Next Steps Next steps: • Upgrade PMM version (still on 1.13) • More tailor-made graphs ○ comparing cross nodes / sites • Adding alerting based on graphs • Adding more nodes (we were blocked by MySQL-bug) • Adding more types of nodes: ○ Cassandra ○ Sybase ASE 2 0
21 .Semi-sync Graph Example ● PMM was already collecting semi- sync replication data, but it wasn't getting displayed ● … so let’s do that!
22 .Prepared Statements Versus Executions ● Ever wondered how often you executed a statement versus how many times you issued a prepare? ● … We did, so we made a graph!
23 .PMM 2
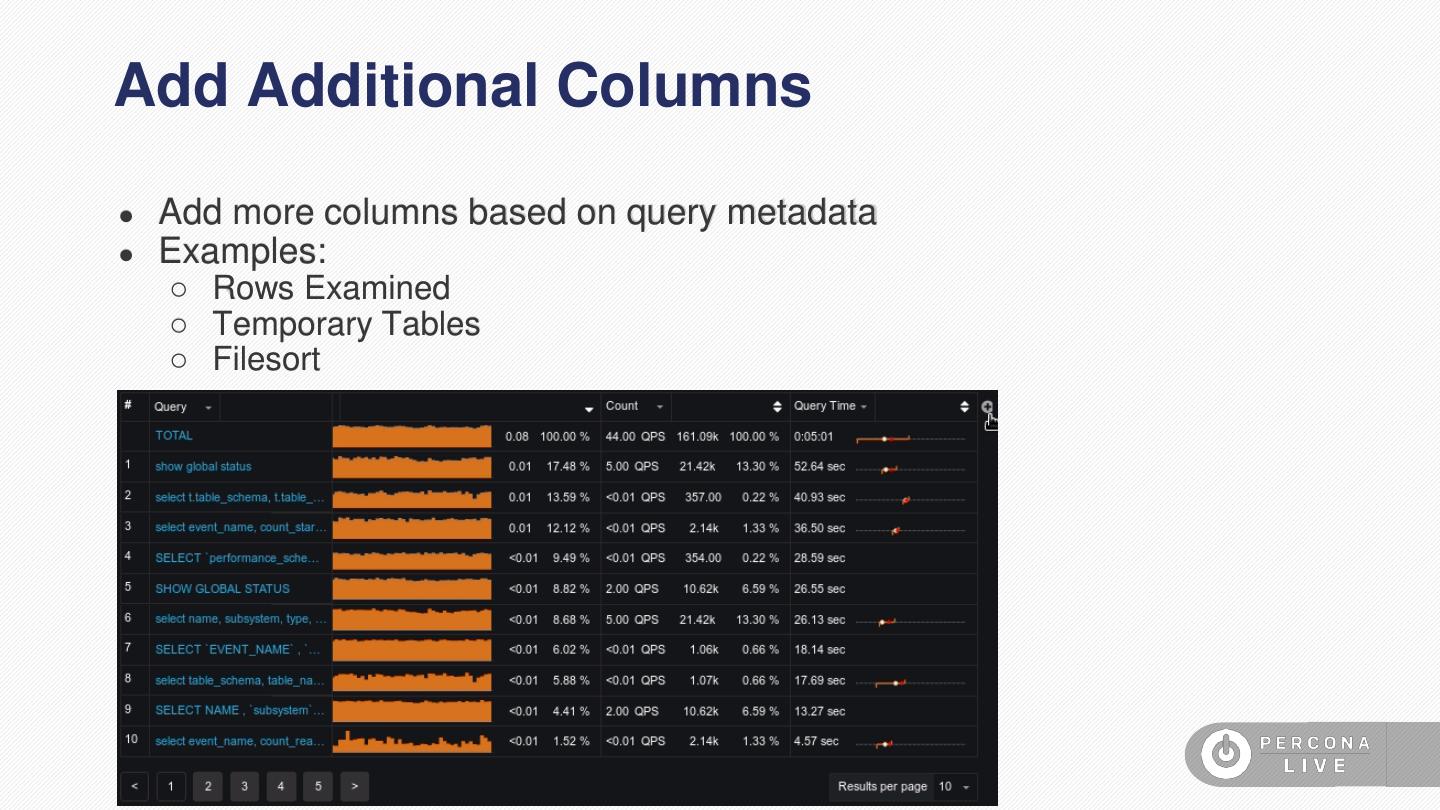
24 .What's New and Exciting? ● Query Analytics ○ Support for large environments ○ Filtering using query metadata and labels ○ Sorting and additional columns ○ Support for PostgreSQL ● pmm-agent ● Standard and Custom labels ● Inventory Overview ● Inventory API ● Multiple scraping intervals
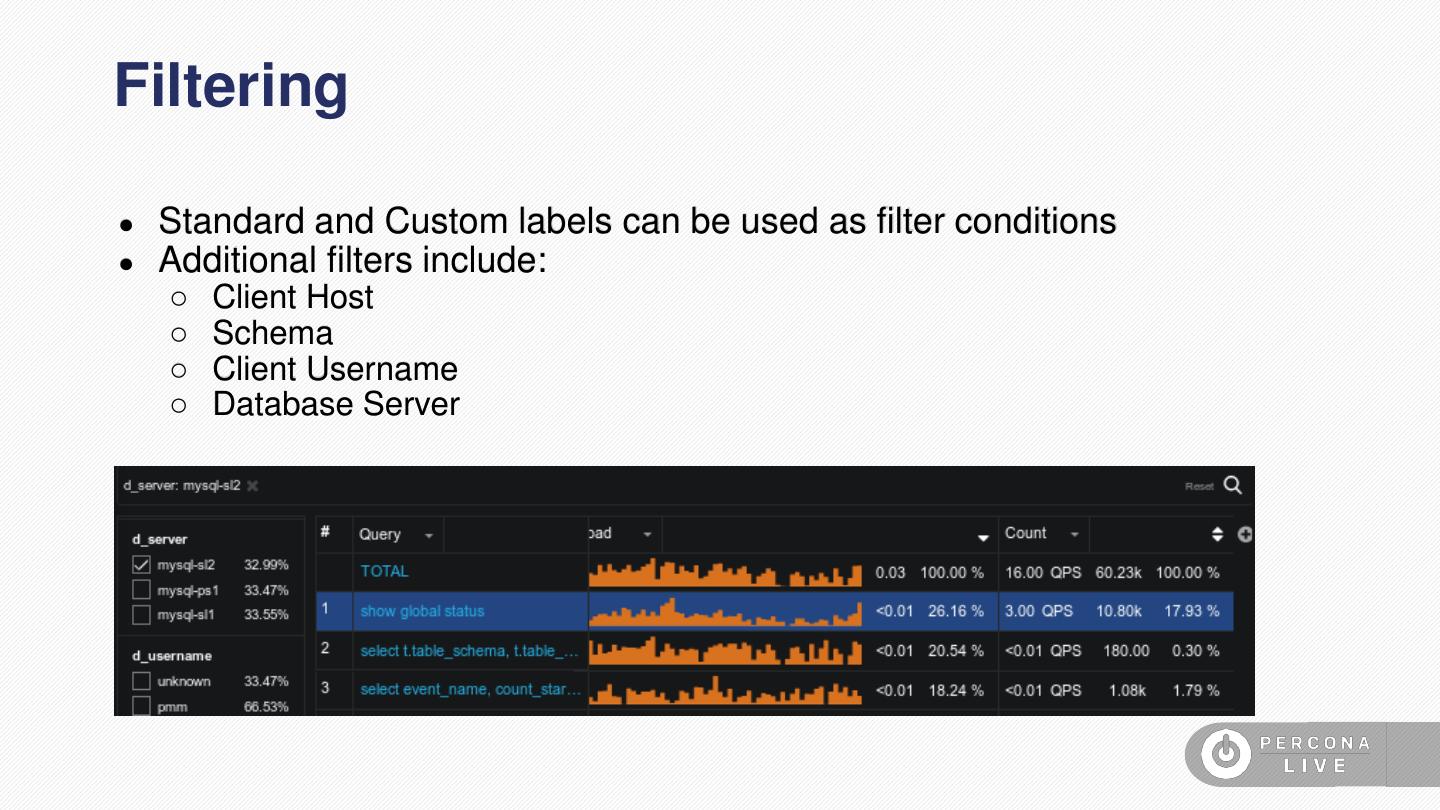
25 .Filtering ● Standard and Custom labels can be used as filter conditions ● Additional filters include: ○ Client Host ○ Schema ○ Client Username ○ Database Server
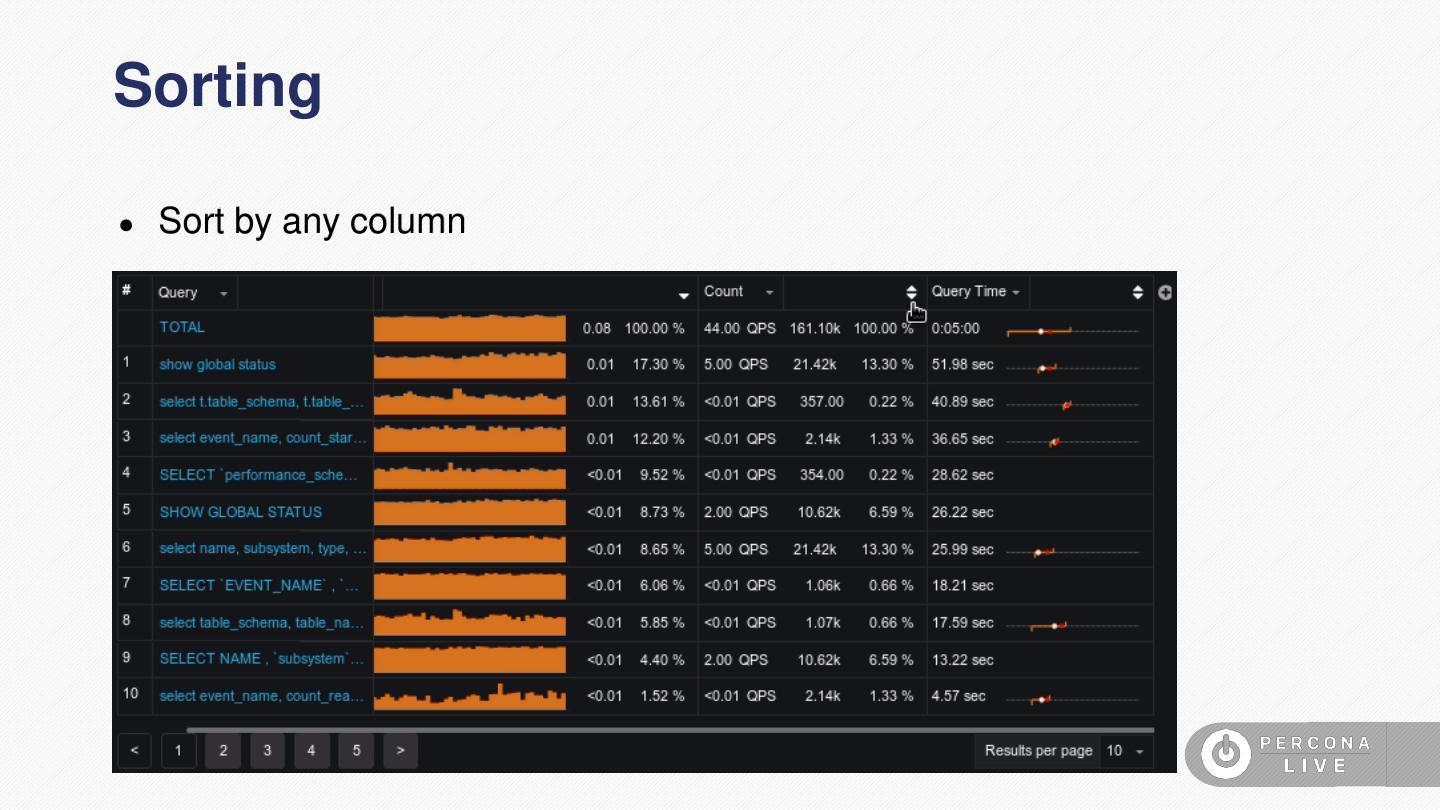
26 .Sorting ● Sort by any column
27 .Add Additional Columns ● Add more columns based on query metadata ● Examples: ○ Rows Examined ○ Temporary Tables ○ Filesort
28 .Thank You to Our Sponsors
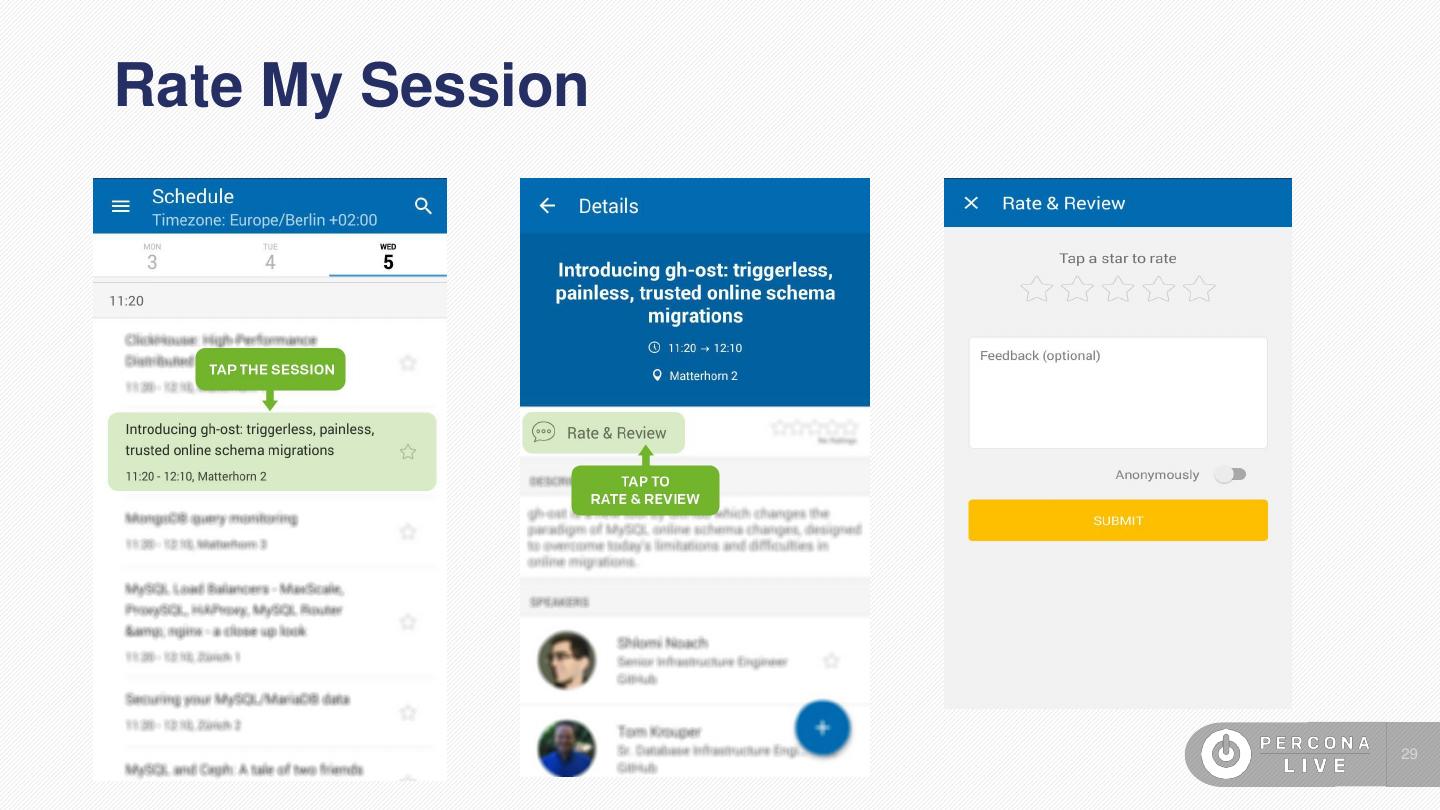
29 .Rate My Session 29


