- 快召唤伙伴们来围观吧
- 微博 QQ QQ空间 贴吧
- 文档嵌入链接
- 复制
- 微信扫一扫分享
- 已成功复制到剪贴板
MongoDB Monitoring and Performance for The Savvy DBA
你是不是想在事情变得难看之前保持数据库的顶层?在吞吐量、数据库性能、资源利用率、资源饱和、错误(断言)和许多其他指标之间,您如何知道现在需要查看哪个(哪些可以等待)?
DBA和系统管理员都需要保持在他们所管理的系统之上。但是,在需要立即关注的指标和应长期关注的指标之间进行筛选是一项挑战。在本次网络研讨会中,Bimal缩小了指标列表,这些指标可以帮助您决定当值DBA是获得建议的8小时闭眼时间,还是在没有睡眠的情况下服用咖啡因。Bimal还通过Percona的监视和管理(PMM)工具中的示例讨论了哪些图形相互关联,以帮助您了解MongoDB中的事物如何影响其他区域。
展开查看详情
1 . MongoDB Monitoring and Performance for The Savvy DBA Key metrics to focus on for day-to-day MongoDB operations Bimal Kharel Senior Technical Services Engineer Percona Webinar 2017-05-23 1 © 2017 Percona
2 .What I’ll cover • Key commands to get the metrics • Key metrics to graph and alert on • Distinguish between MMAPv1 and WiredTiger storage engine metrics wherever appropriate • Show examples from our own PMM (free, open-source monitoring tool from Percona) 2 © 2017 Percona
3 .Starting with key commands In order of usefulness in day-to-day management ▪ db.serverStatus() ▪ rs.status() ▪ db.printReplicationInfo() ▪ sh.status() ▪ db.stats() 3 © 2017 Percona
4 .Operating system monitoring OS level metrics you should set up alerts on and graph for easy trend identification ▪ disk utilization ▪ load average and CPU queue ▪ memory and possibly swapping ▪ I/O utilization or a combination of load and latency 4 © 2017 Percona
5 .Data and operations growth - 1 sum up the collection sizes db.getMongo().getDBNames().forEach(function(d) { var curr_db = db.getSiblingDB(d); var total_size = 0; curr_db.getCollectionNames().forEach(function(coll) { var coll_size = curr_db.getCollection(coll).stats().storageSize; total_size = total_size + coll_size; }); print(d + ": " + total_size/(1024*1024)); });; ▪ Run the above against the admin database 5 © 2017 Percona
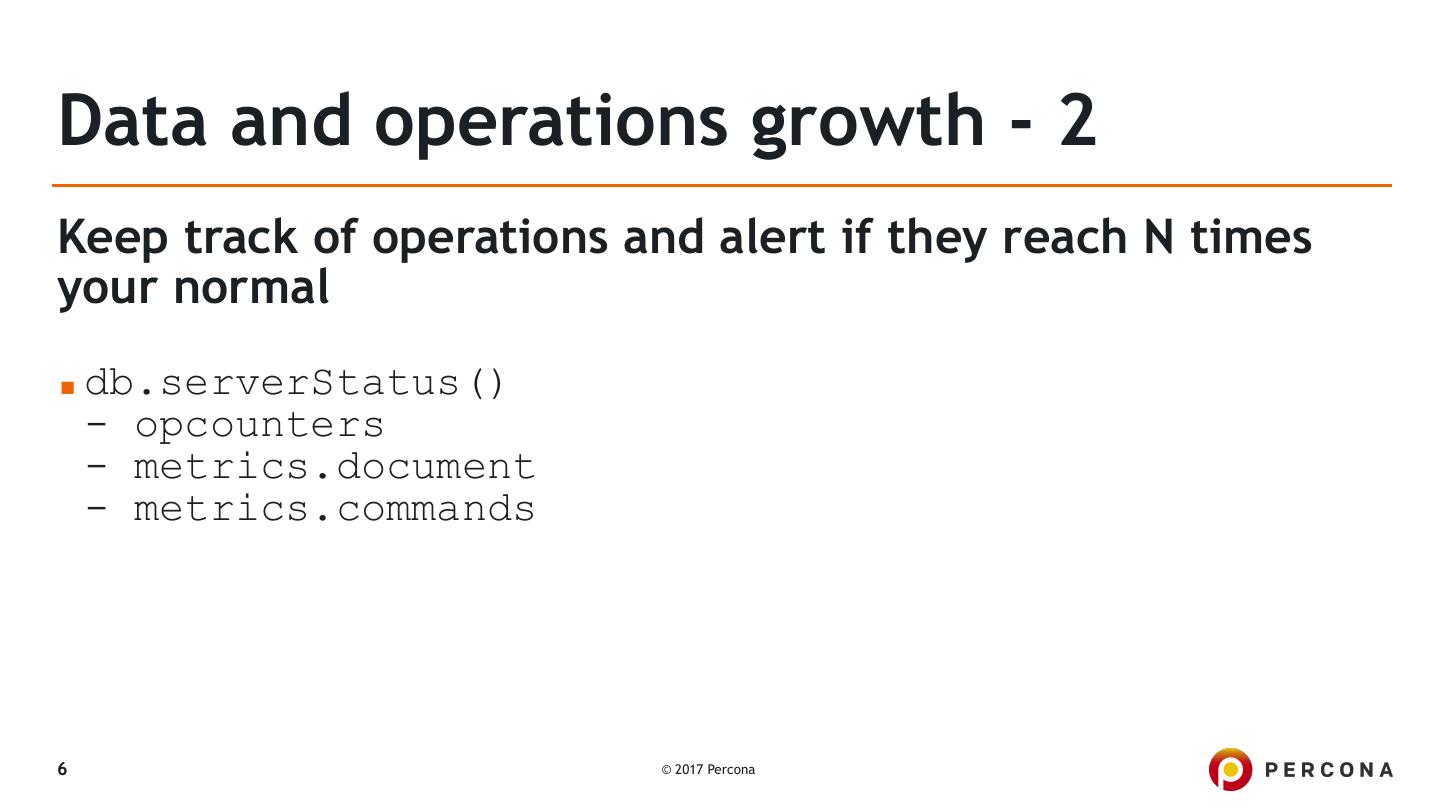
6 .Data and operations growth - 2 Keep track of operations and alert if they reach N times your normal ▪ db.serverStatus() - opcounters - metrics.document - metrics.commands 6 © 2017 Percona
7 .example (some output trimmed) replset:PRIMARY> replset:PRIMARY> db.serverStatus().opcounters db.serverStatus().metrics.commands { { "insert" : 99992, ... "query" : 10, "insert" : { ... "failed" : NumberLong(0), } "total" : NumberLong(50046) ... replset:PRIMARY> "serverStatus" : { db.serverStatus().metrics.document "failed" : NumberLong(0), { "deleted" : NumberLong(0), "total" : NumberLong(5) "inserted" : NumberLong(99992), }, "returned" : NumberLong(362720), ... "updated" : NumberLong(0) } } 7 © 2017 Percona
8 .Journaling Journaling is on by default and should be left on. It is a write-ahead log that persists writes to disk faster than committing to the database ▪ For MMAP it will let the node recover data lost within 60s of a crash ▪ In WiredTiger it occurs every 50ms (100ms prior to 3.2) so it narrows the window of data loss even further as checkpoints are taken every 60s. 8 © 2017 Percona
9 .flushing from memory to disk For MMAP ▪ db.serverStatus() - backgroundFlushing For WiredTiger ▪ db.serverStatus() - wiredTiger.transaction 9 © 2017 Percona
10 .Memory to disk operations For MMAP ▪ db.serverStatus() - extra_info.page_faults For WiredTiger ▪ db.serverStatus() - wiredtiger.cache 10 © 2017 Percona
11 .locking and tickets - 1 For MMAP ▪ db.serverStatus() - globalLock - locks ▪ locks timeAcquiringMicros and acquireWaitCount can help you spot trends in average lock times 11 © 2017 Percona
12 .locking and tickets - 2 For WiredTiger ▪ db.serverStatus() - wiredTiger.concurrentTransactions 12 © 2017 Percona
13 .connections, cursors and sessions - 1 ▪ Badly designed apps will create a new connection for every query ▪ Each connection has a 1MB overhead so this can add up quickly ▪ All major drivers provide connection pooling ▪ db.serverStatus() - globalLock.activeClients - connections - metrics.cursor 13 © 2017 Percona
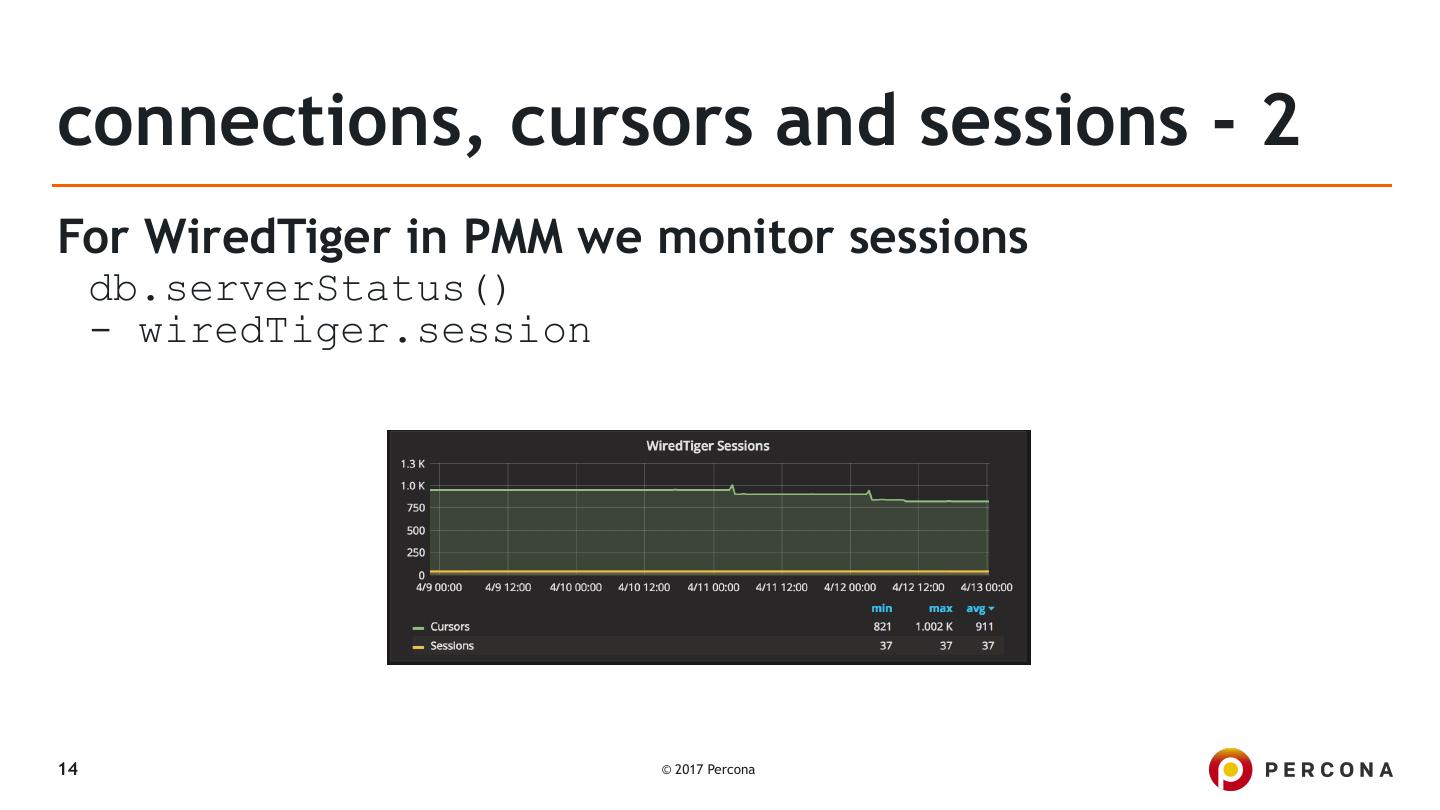
14 .connections, cursors and sessions - 2 For WiredTiger in PMM we monitor sessions db.serverStatus() - wiredTiger.session 14 © 2017 Percona
15 .Replication metrics Get information about the operations log (oplog) ▪ db.getReplicationInfo() - logSizeMB - usedMB - timeDiffHours 15 © 2017 Percona
16 .replication lag and headroom -1 Lag is a derived value ▪ rs.status() replication lag - members[].optimeDate ▪ it is the difference of between the Primary and the Secondary nodes replication headroom SECONDARY OPLOG Headroom is also a derived value ▪ db.getReplicationInfo() PRIMARY OPLOG - (timeDiffHours - lag time (converted to hours)) 16 © 2017 Percona
17 .replication lag and headroom -2 Replication lag and headroom graphs taken from PMM 17 © 2017 Percona
18 .sharding metrics - 1 Run against a mongos instance ▪ sh.status() This returns a report rather than JSON so you may have to do additional parsing or opt for >use config and run queries against the chunks, collections and shards collections to access the metrics you want Balancer commands ▪ - sh.getBalancerState() - sh.isBalancerRunning() 18 © 2017 Percona
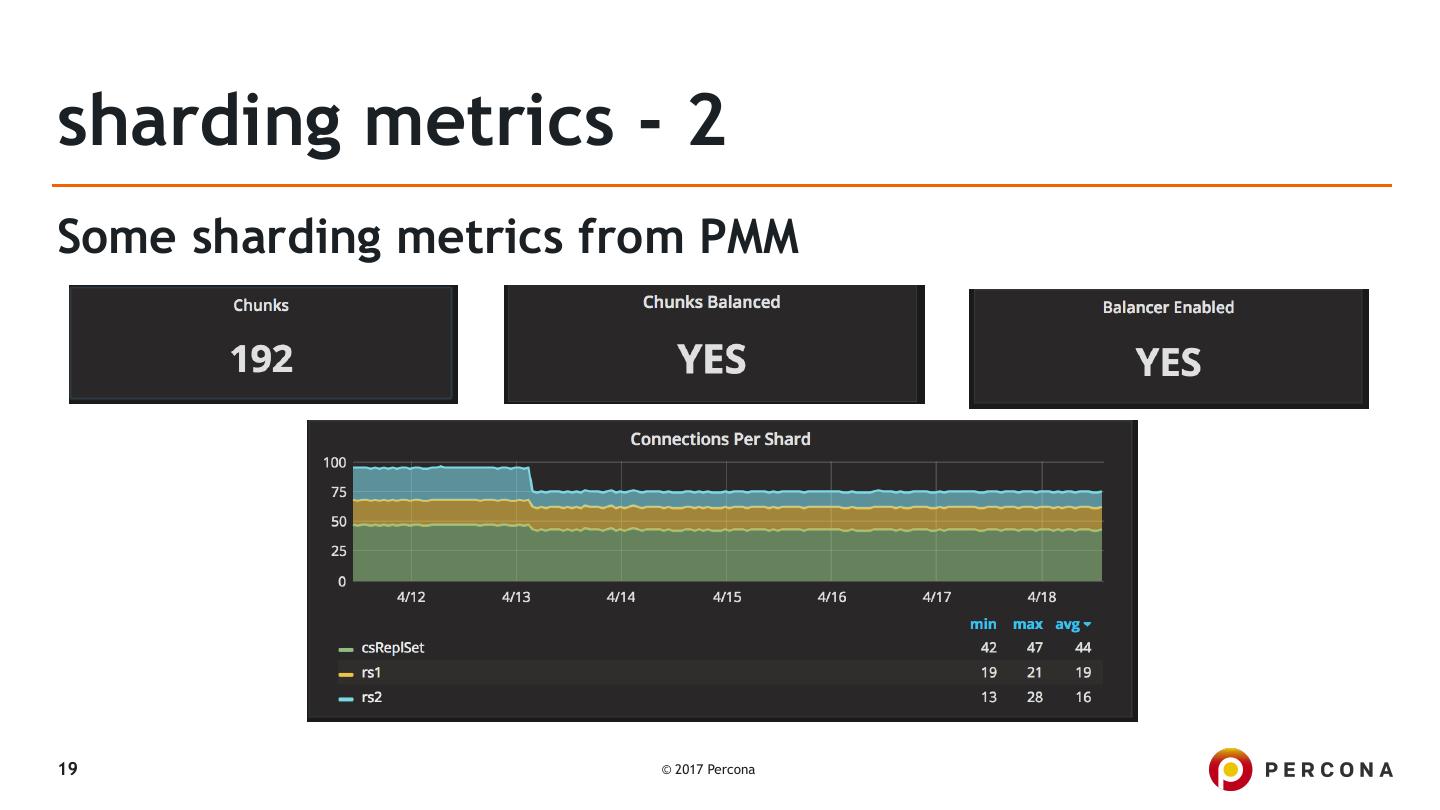
19 .sharding metrics - 2 Some sharding metrics from PMM 19 © 2017 Percona
20 .Time for questions and links PMM - Percona Monitoring and Management ▪ https://www.percona.com/software/database-tools/percona- monitoring-and-management About me: ▪ Bimal Kharel ▪ bimal.kharel@percona.com ▪ 1-737-346-2418 20 © 2017 Percona
21 .About Percona Solutions for your success with MySQL and MongoDB Support, Managed Services, Software Our Software is 100% Open Source Support Broad Ecosystem – MySQL, MariaDB, Amazon RDS In Business for 10 years More than 3000 customers, including top Internet companies and enterprises 21 © 2017 Percona
22 . DATABASE Database Performance Matters PERFORMANCE MATTERS


