- 快召唤伙伴们来围观吧
- 微博 QQ QQ空间 贴吧
- 文档嵌入链接
- 复制
- 微信扫一扫分享
- 已成功复制到剪贴板
A Proactive Approach to Monitoring Slow Queries
慢查询是任何数据库的严酷现实。无论您如何构建系统、设计数据、教育开发人员和控制访问,都很难防止缓慢的查询。它们会对数据库的性能以及任何使用它的应用程序的性能产生负面影响。监控它们是至关重要的。否则,您将在排除生产数据库性能问题时找到它们。
在Thousandeyes,我们采取了一种主动和自动化的方法来监控MySQL中缓慢的查询。我们使用各种开源技术Percona工具包、风速计和内部工具(Slow Query Notifier)构建了一个完全自动化的管道,以捕捉这些缓慢的查询并通知我们。Slow Query Notifier可识别顶级罪犯和设计不当的查询,重点关注最具影响力的罪犯。它通过我们的JIRA票务系统通知各个查询的作者,并且能够管理一个复杂的JIRA工作流-创建、重新打开问题和更新优先级。
在本演示中,我们将介绍主动监控慢速查询的重要性,并分享我们的设计和学习成果。我们的目标是开放源码慢速查询通知程序,与PMM查询分析集成,并添加对MongoDB慢速查询的支持。
展开查看详情
1 .A Proactive approach to Monitoring Slow Queries Shashank Sahni ThousandEyes
2 . Shashank Sahni Principal SRE @ThousandEyes Reach out to shashank@thousandeyes.com Twitter @shredder12 @shredder12 @ThousandEyes 2
3 . MySQL @ThousandEyes Percona Xtradb Clusters Low Latency Transactional store 7k tx/sec @shredder12 @ThousandEyes 3
4 .What is a Slow Query?
5 .If exec_time > threshold Victims of Poorly Dealing with Designed a lot of data Database Congestion @shredder12 @ThousandEyes 5
6 .Performance Impact
7 . Database Performance Impact BAD WORSE WORST • Slow by Design • Steal resources from • Thrashing System Resources other queries • High latency for • Leaving DB unresponsive. applications issuing them • DB congestion due to Outage!! extended locks. @shredder12 @ThousandEyes 7
8 . Slow Queries Always Sneak in Human Mistake Schema Changes Performance Degrades Over Time Bad Design Deleted Index Increasing table size @shredder12 @ThousandEyes 8
9 .Proactively dealing with Slow Queries
10 . Catch Early and Minimize Impact Continuous Automation Notification Process New changes are Faster analysis Notify application pushed everyday owner for faster resolution @shredder12 @ThousandEyes 10
11 .Slow Query Pipeline @ThousandEyes
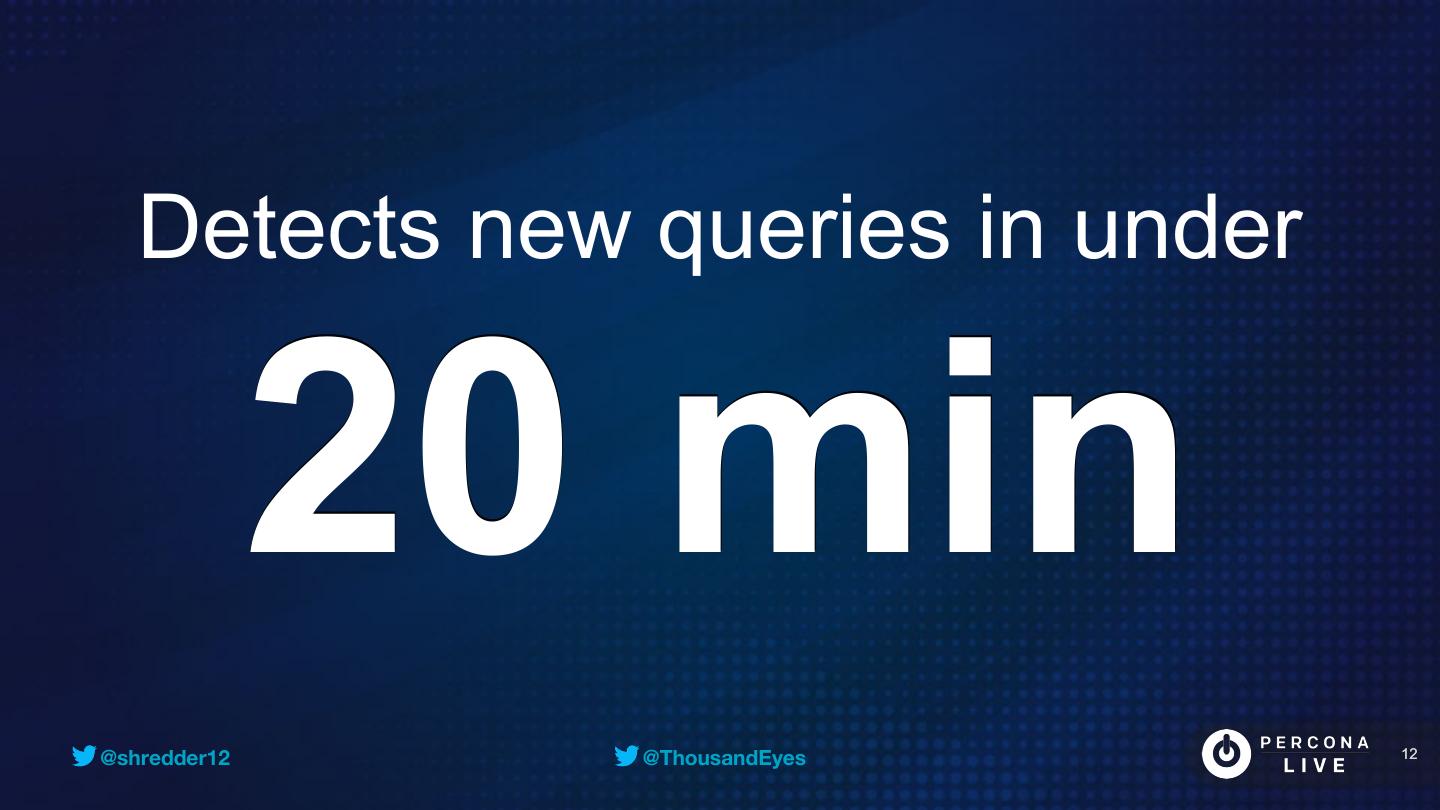
12 . Detects new queries in under 20 min @shredder12 @ThousandEyes 12
13 .Notifications • Notifies the application owner – MySQL user associated to app • JIRA Issues – Creates Issue for new queries – Raises priority if performance worsens – Reopens Issue if query shows up again @shredder12 @ThousandEyes 13
14 . Select Top Offenders count > C && (time_sum > S || time_avg > A) Occurrence Total Exec Time Avg Exec Time • Avoids one off queries • Queries with high total exec_time • Queries with high avg exec_time • Captures Recurring queries • Filters queries which have small • Filters queries which have high avg but high count avg but small coun @shredder12 @ThousandEyes 14
15 .Select Poorly Designed Queries full_scan_sum > 0 && Innodb_queue_wait_max < T Full Table Scan Queued or Executing • Not using Indexes • Filters query whose exec_time wasn’t spend in Storage • Poor Joins engine’s queue. Their Execution was indeed slow. • Rarely genuine • Set T to just under your slow query threshold long_query_time. @shredder12 @ThousandEyes 15
16 .Architecture Anemometer pt-query-digest pushing analyzed logs from databases Slow Query Database SQN Slow Query Notifier Jira @shredder12 @ThousandEyes 16
17 .pt-query-digest MySQL Query Analyzer from Percona • Great tool for ad hoc or batch analysis • Invaluable Insights Our Setup • Runs periodically on all DB nodes • Analyzes slow query logs and stores the data in a central slow query database. @shredder12 @ThousandEyes 17
18 .Anemometer Slow Query Monitor from Box • Web utility to visualize and search through analyzed slow query data • Good Search and Deepdive features • Not under active development. • Github - box/anemometer @shredder12 @ThousandEyes 18
19 .Slow Query Notifier SQN From ThousandEyes • In-house tool to monitor slow query events. • Configurable query properties to catch top offenders – JIRA workflow for notifications • create/reopen/prioritize • To be open-sourced @shredder12 @ThousandEyes 19
20 .Lessons Learned
21 . Target Top Offenders Happy Less Noise More Impact Developers! @shredder12 @ThousandEyes 21
22 . Share Every Win Result of resolving Top 4 queries @shredder12 @ThousandEyes 22
23 .Future Works
24 .Future Works Open source Slow-Query-Notifier Support for notification backends – email etc. Support for Mongodb Evaluate PMM for Slow Query visualization 24 @shredder12 @ThousandEyes
25 . 25 @shredder12 @ThousandEyes
26 .Thank You


