


- 快召唤伙伴们来围观吧
- 微博 QQ QQ空间 贴吧
- 文档嵌入链接
- 复制
- 微信扫一扫分享
- 已成功复制到剪贴板
Matplotlib使用教程
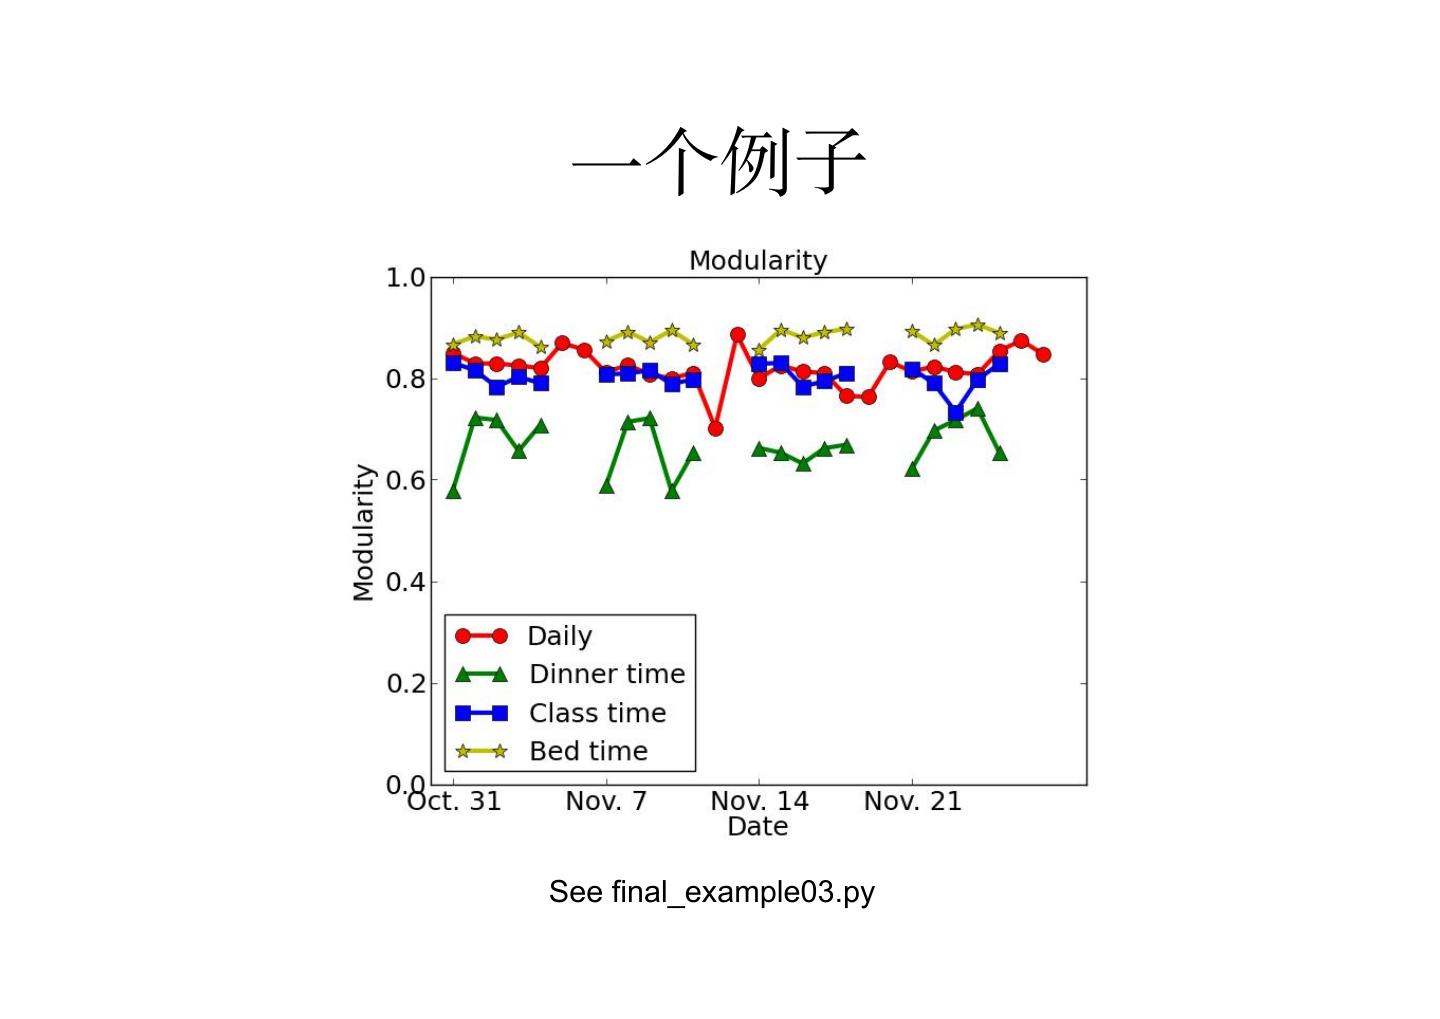
从实际应用举例,说明出发,详细讲解Matplotlib使用教程。
展开查看详情
1 .Matplotlib使用教程 黄春林
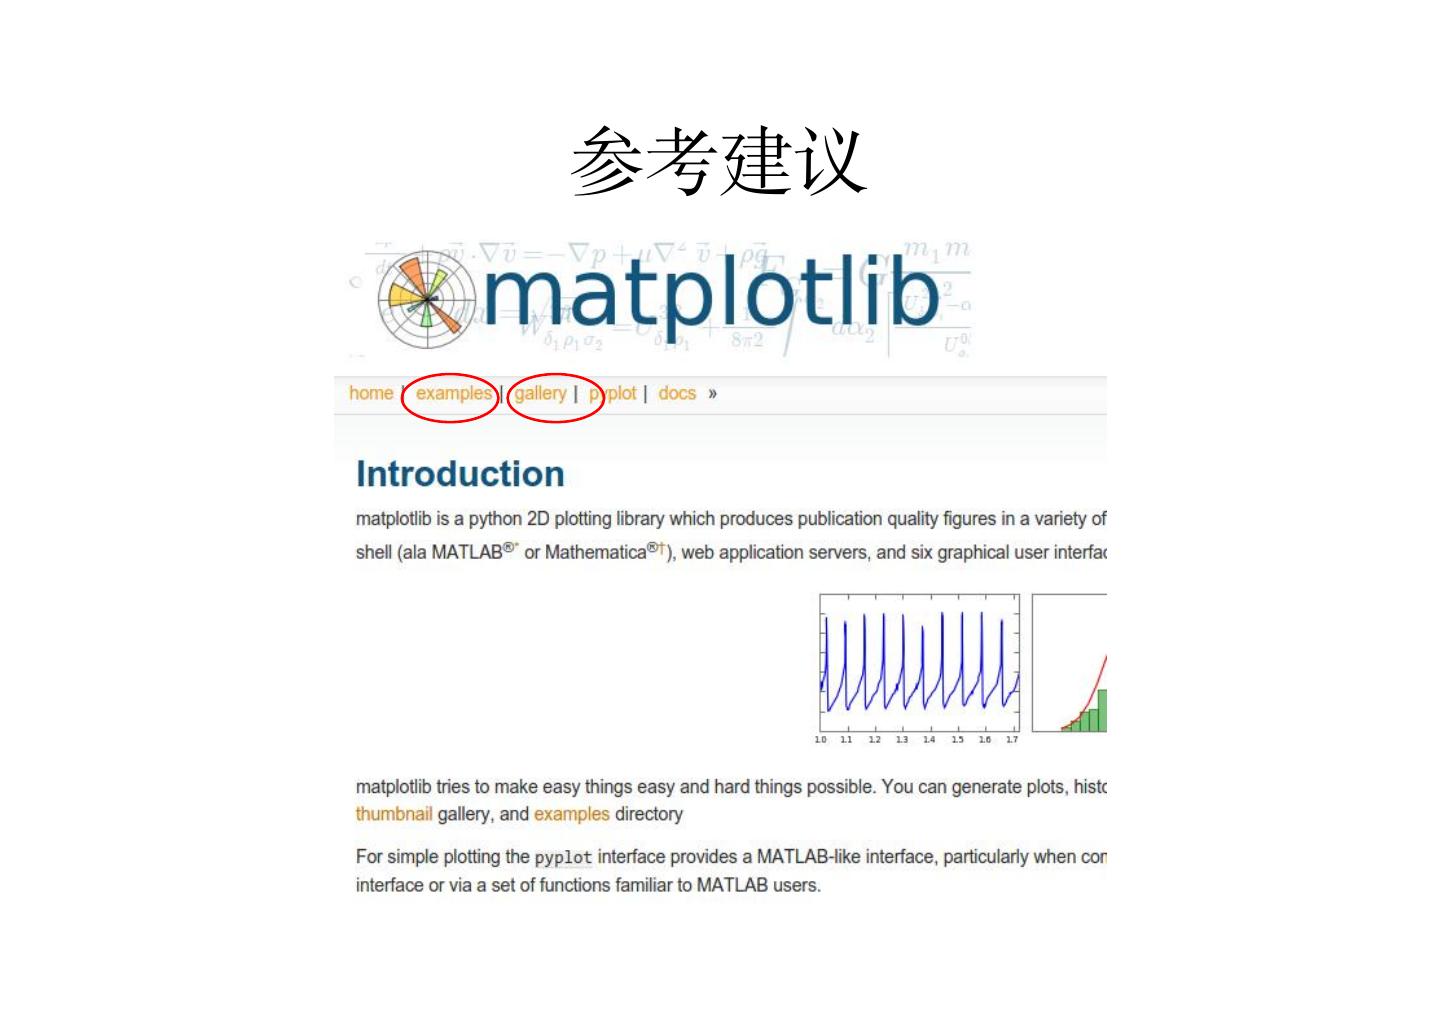
2 . 简单介绍 • Most popular plotting library for python • Created by John Hunter (1968-2012) • Has a lot in common with MatLab's plotting library, both functionally and syntactically. • http://matplotlib.org/ 中的 Example 和 Gallery
3 .美观
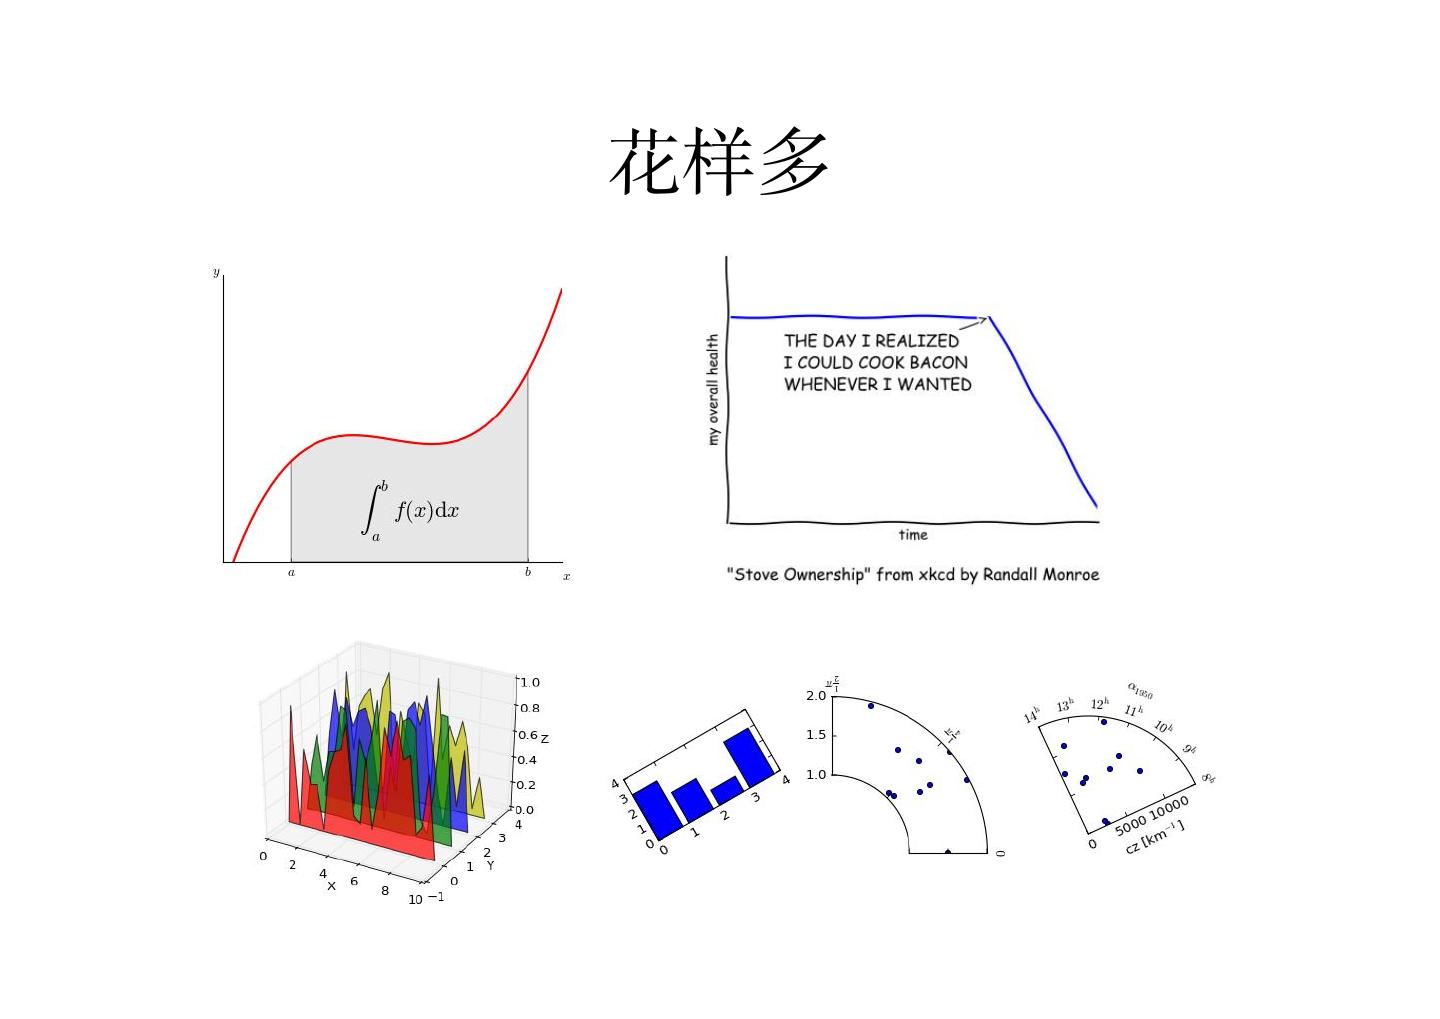
4 .花样多
5 .花样多
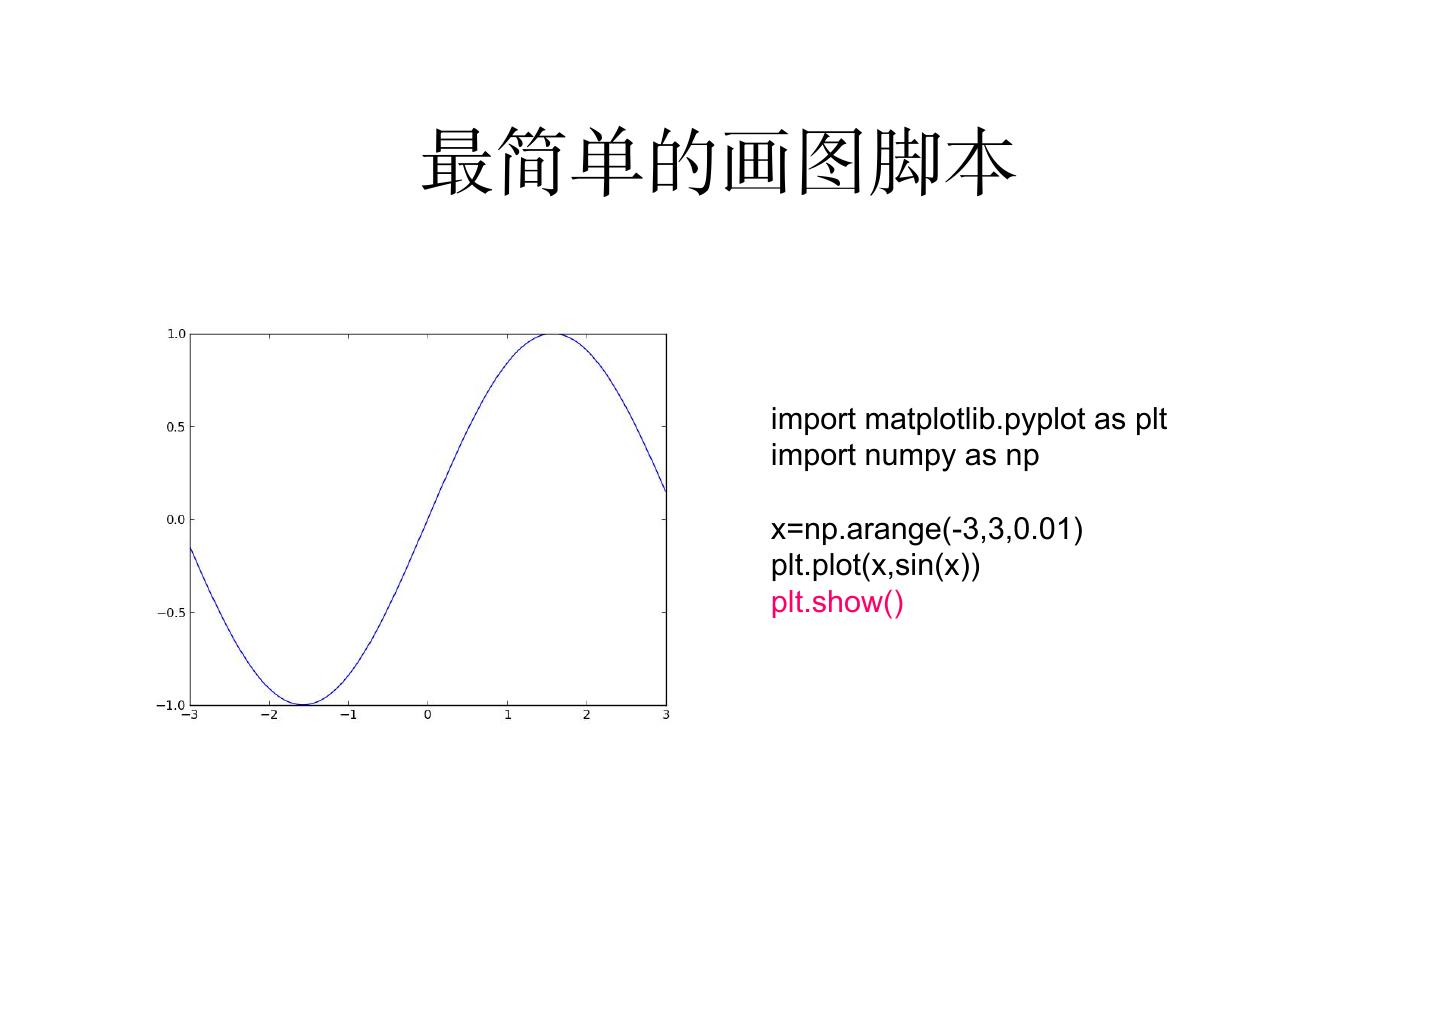
6 .最简单的画图脚本 import matplotlib.pyplot as plt import numpy as np x=np.arange(-3,3,0.01) plt.plot(x,sin(x)) plt.show()
7 .从一个例子学起 #!/usr/bin/python import numpy as np import matplotlib.pyplot as plt fs = 18 ms = 10 all_files = [ 'nets' + str(i) + '.txt' for i in np.arange(1,5) ] plot_file = "dots.ex1.png" data = [ np.loadtxt(all_files[i]) for i in range(0, len(all_files))] subdata = data[0] plt.plot(subdata[:,6], subdata[:,9], 'r+', markersize = ms, label = 'Nets 1') subdata = data[1] plt.plot(subdata[:,6], subdata[:,9], 'mx', markersize = ms, label = 'Nets 2') subdata = data[2] plt.plot(subdata[:,6], subdata[:,9], 'bs', markersize = ms, label = 'Nets 3') subdata = data[3] plt.plot(subdata[:,6], subdata[:,9], 'gv', markersize = ms, label = 'Nets 4') plt.title('This is title', fontsize=fs) plt.xlabel('Clustering Coefficient', fontsize=fs) plt.ylabel('Efficiency', fontsize=fs) plt.xlim((0,1)) plt.ylim((0,1)) for label in plt.gca().xaxis.get_ticklabels(): label.set_fontsize(fs) for label in plt.gca().yaxis.get_ticklabels(): label.set_fontsize(fs) plt.legend(loc=0, fontsize=fs) plt.savefig(plot_file, bbox_inches='tight')
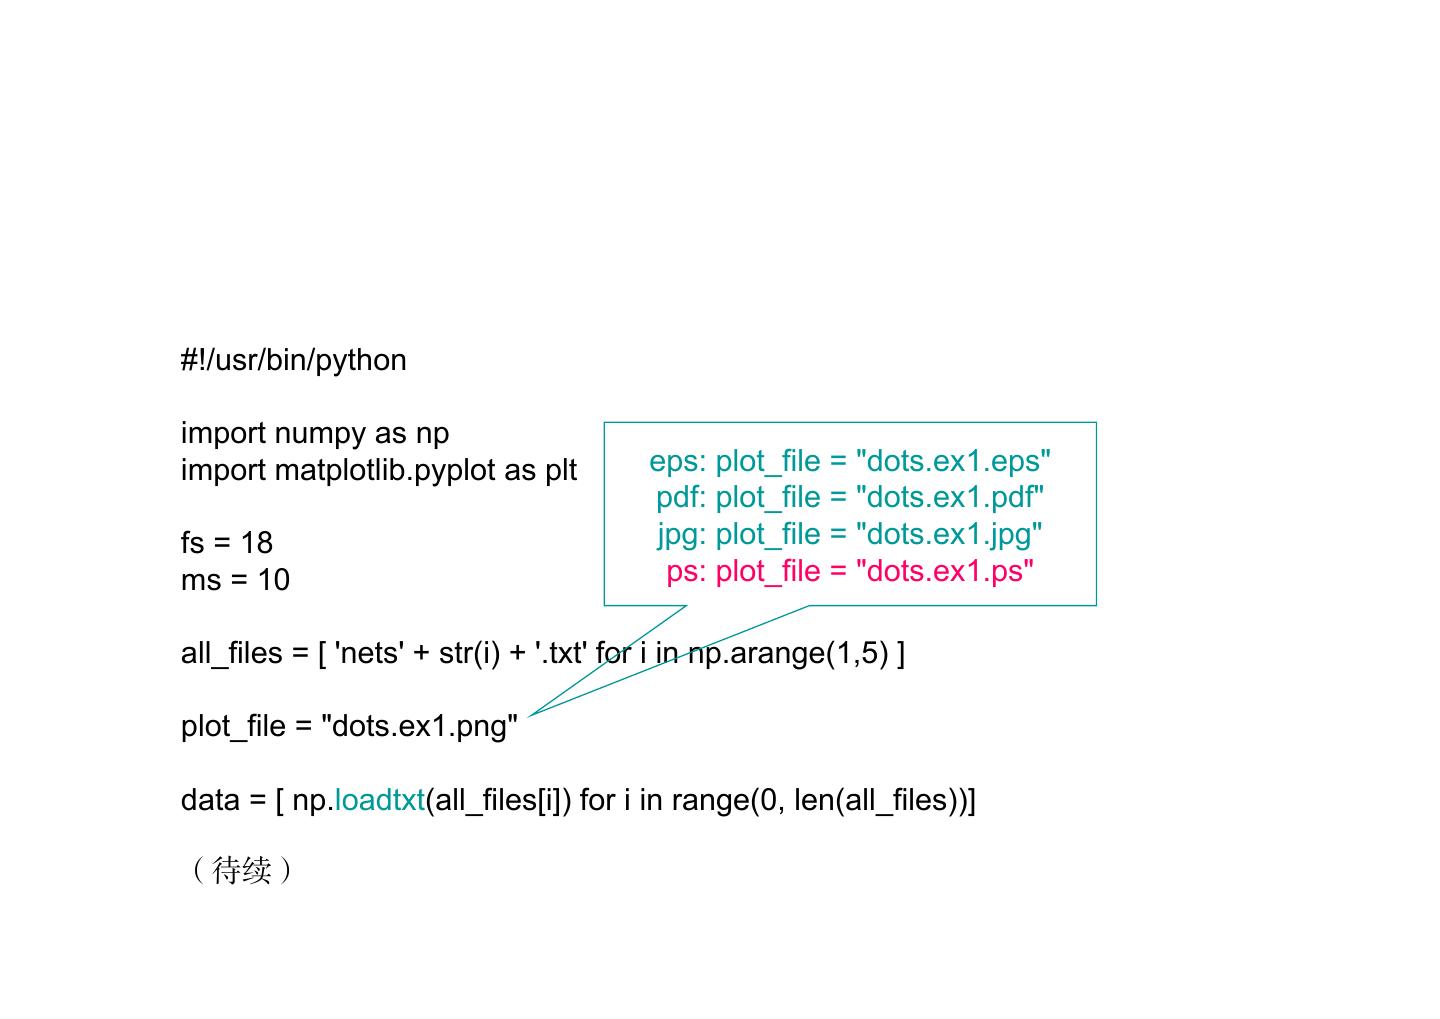
8 .#!/usr/bin/python import numpy as np import matplotlib.pyplot as plt eps: plot_file = "dots.ex1.eps" pdf: plot_file = "dots.ex1.pdf" fs = 18 jpg: plot_file = "dots.ex1.jpg" ms = 10 ps: plot_file = "dots.ex1.ps" all_files = [ 'nets' + str(i) + '.txt' for i in np.arange(1,5) ] plot_file = "dots.ex1.png" data = [ np.loadtxt(all_files[i]) for i in range(0, len(all_files))] (待续)
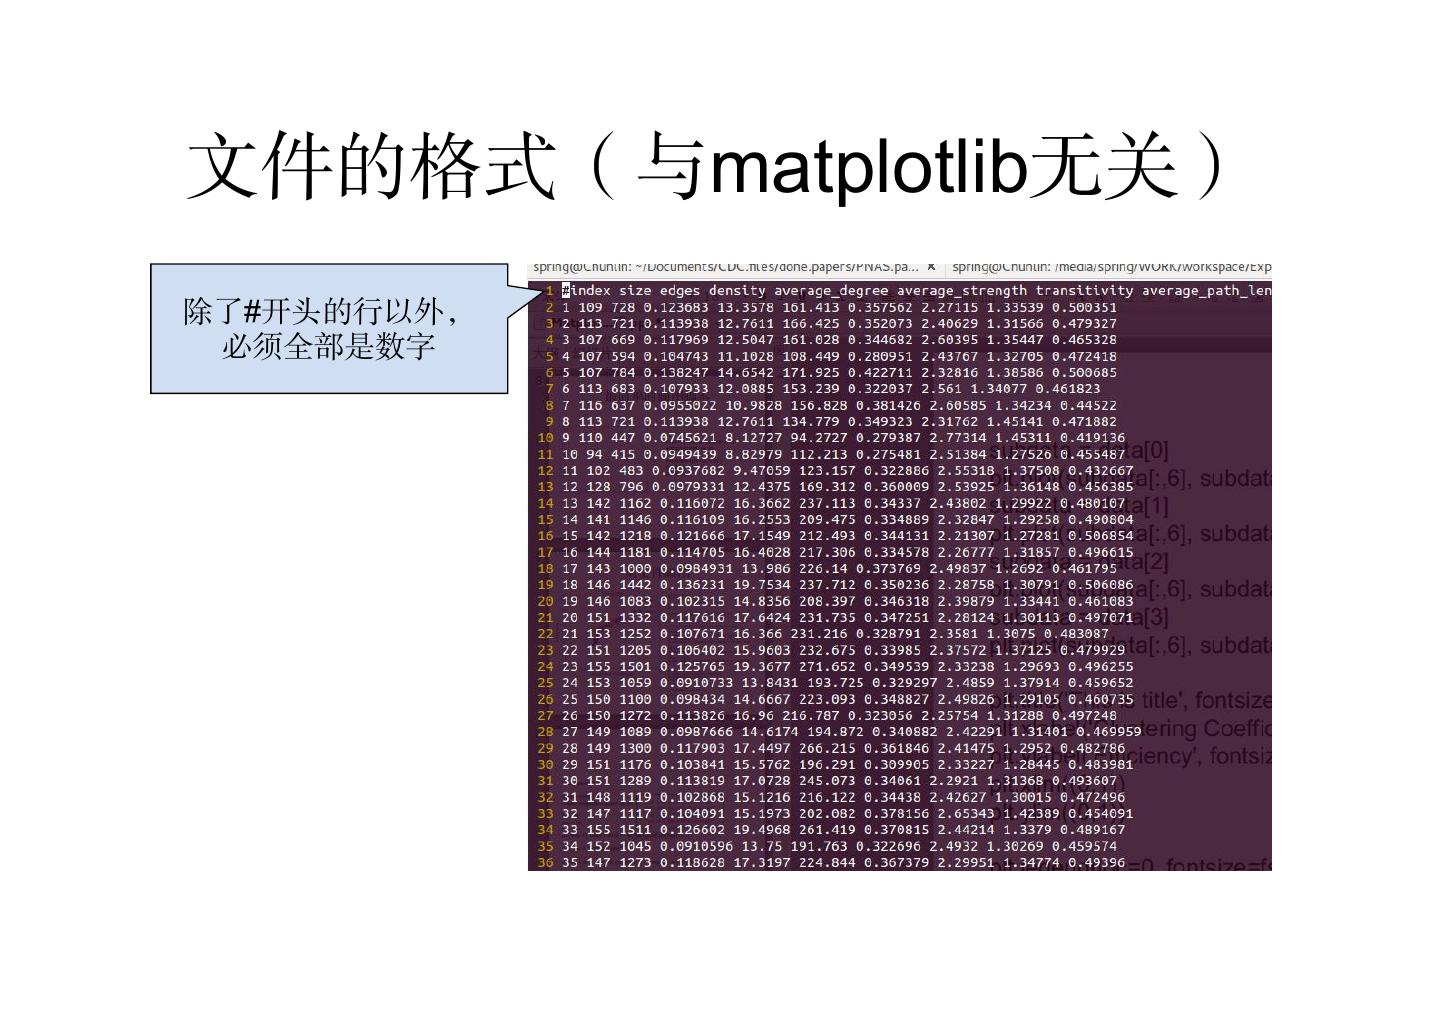
9 .文件的格式(与matplotlib无关) 除了#开头的行以外, 必须全部是数字
10 . 实际上是第7列 subdata = data[0] plt.plot(subdata[:,6], subdata[:,9], 'r+', markersize = ms, label = 'Nets 1') subdata = data[1] plt.plot(subdata[:,6], subdata[:,9], 'mx', markersize = ms, label = 'Nets 2') subdata = data[2] plt.plot(subdata[:,6], subdata[:,9], 'bs', markersize = ms, label = 'Nets 3') subdata = data[3] plt.plot(subdata[:,6], subdata[:,9], 'gv', markersize = ms, label = 'Nets 4') plt.title('This is title', fontsize=fs) plt.xlabel('Clustering Coefficient', fontsize=fs) plt.ylabel('Efficiency', fontsize=fs) plt.xlim((0,1)) plt.ylim((0,1)) for label in plt.gca().xaxis.get_ticklabels(): label.set_fontsize(fs) for label in plt.gca().yaxis.get_ticklabels(): label.set_fontsize(fs) plt.legend(loc=0, fontsize=fs) plt.savefig(plot_file, bbox_inches='tight')
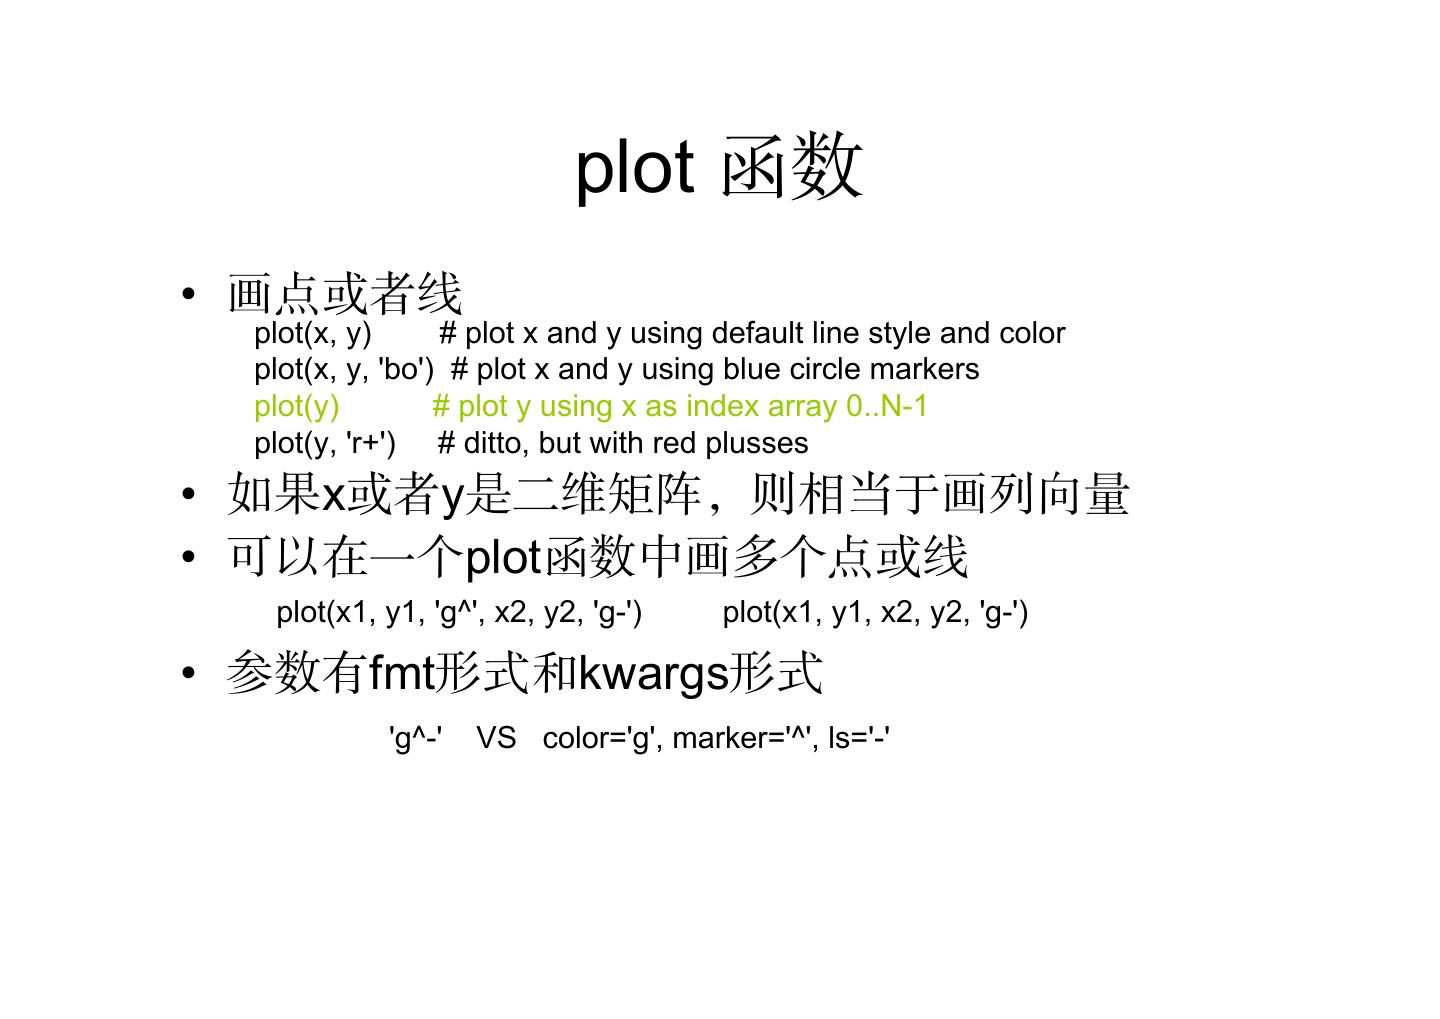
11 . plot 函数 • 画点或者线 plot(x, y) # plot x and y using default line style and color plot(x, y, 'bo') # plot x and y using blue circle markers plot(y) # plot y using x as index array 0..N-1 plot(y, 'r+') # ditto, but with red plusses • 如果x或者y是二维矩阵,则相当于画列向量 • 可以在一个plot函数中画多个点或线 plot(x1, y1, 'g^', x2, y2, 'g-') plot(x1, y1, x2, y2, 'g-') • 参数有fmt形式和kwargs形式 'g^-' VS color='g', marker='^', ls='-'
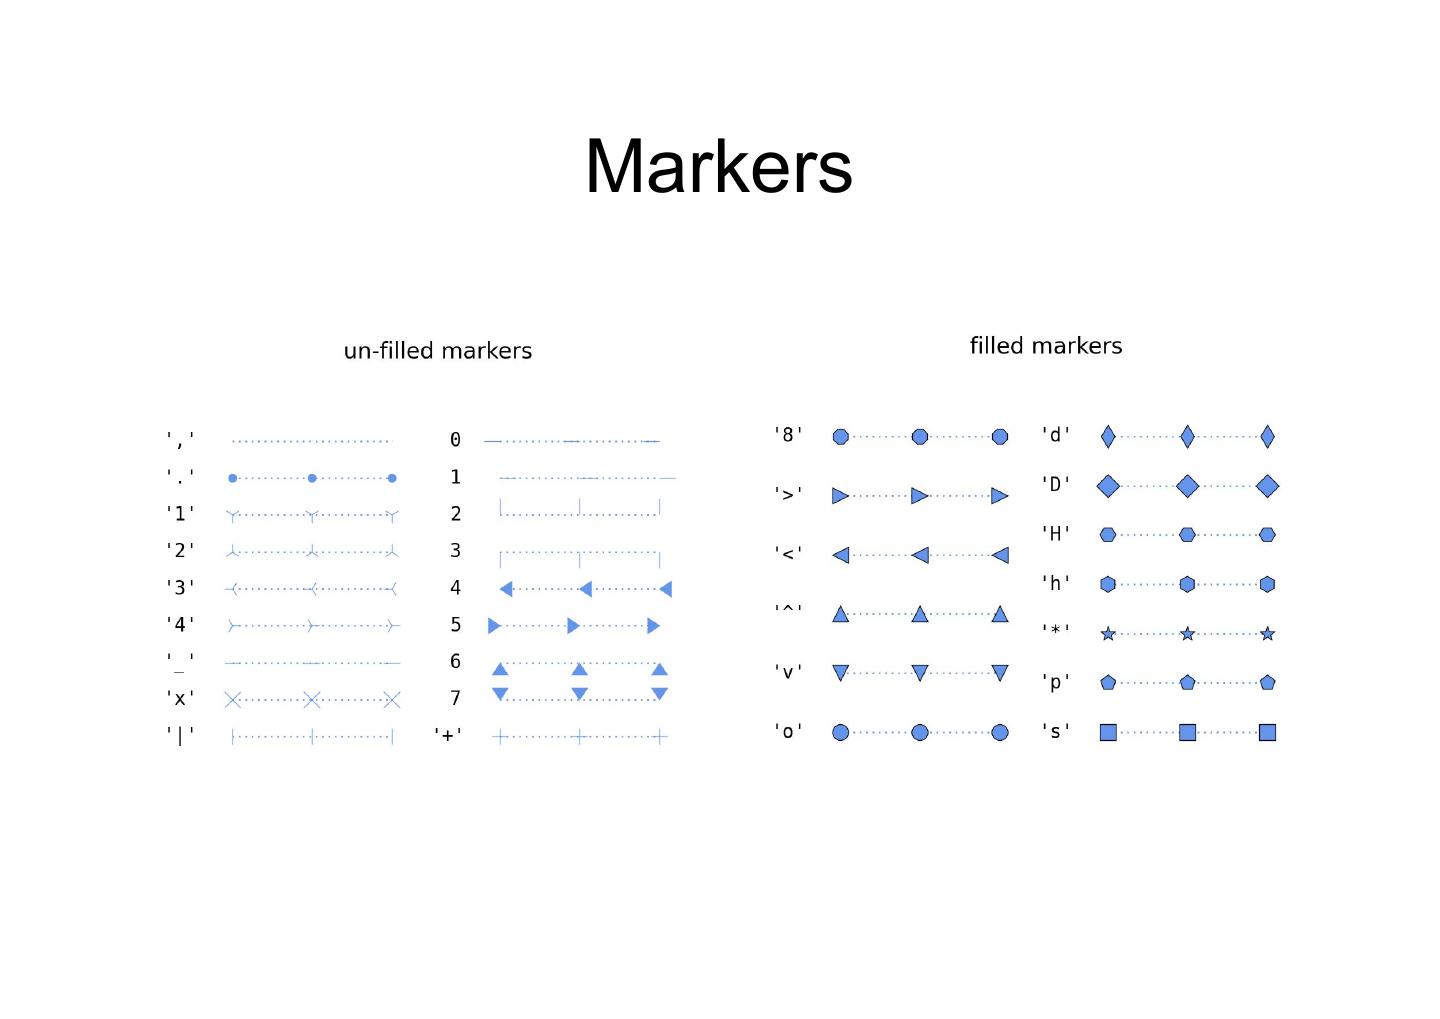
12 .Markers
13 .Line styles
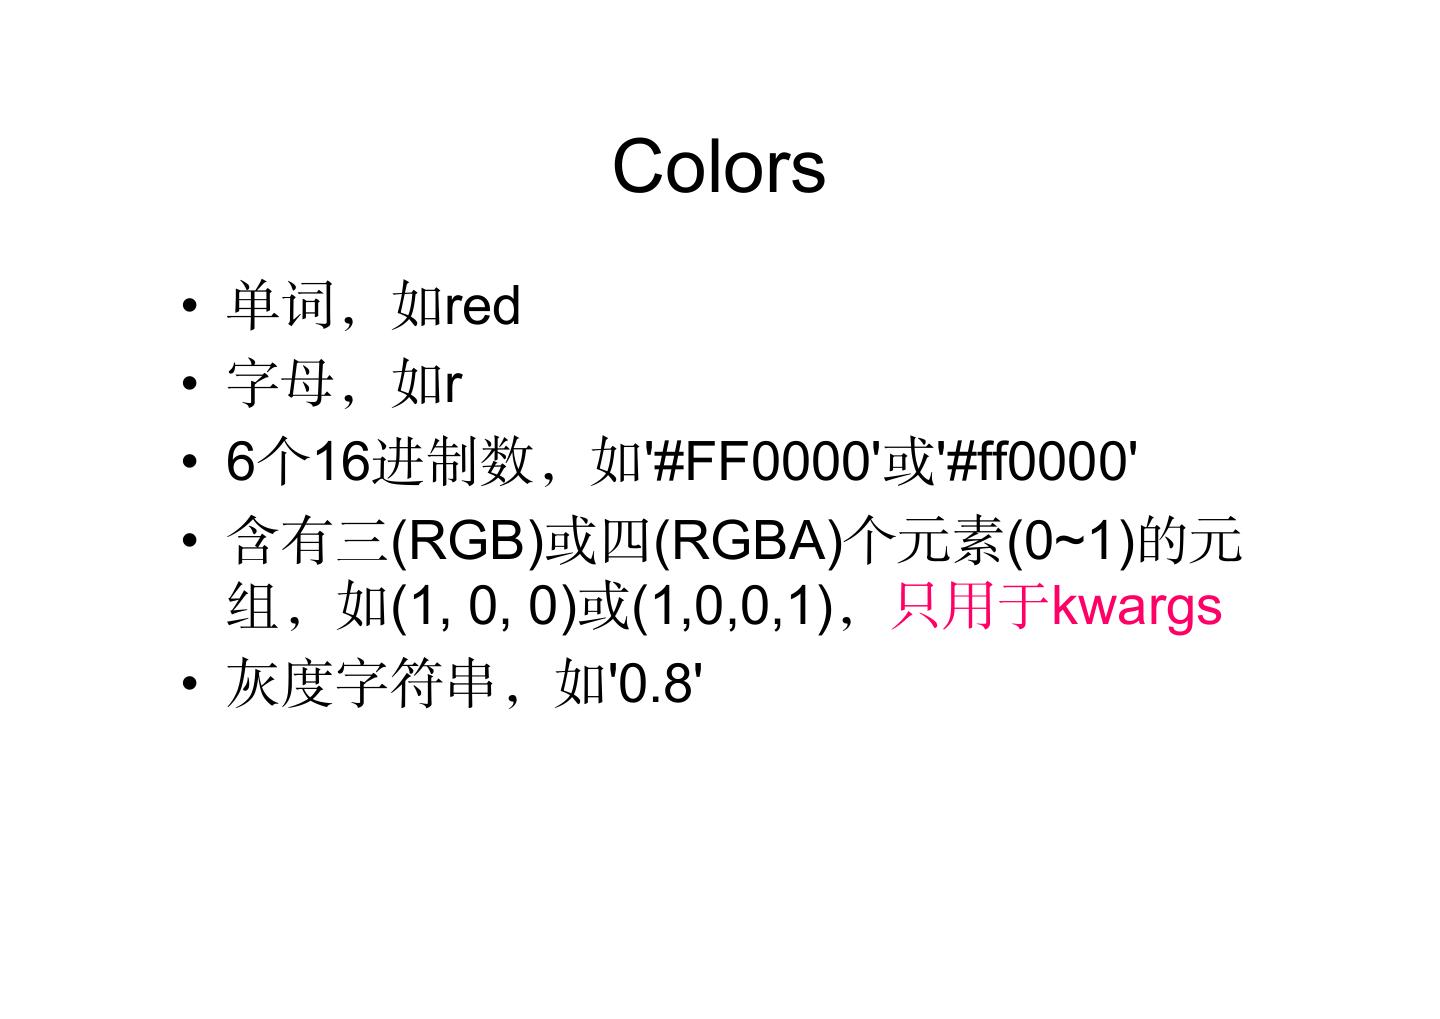
14 . Colors • 单词,如red • 字母,如r • 6个16进制数,如'#FF0000'或'#ff0000' • 含有三(RGB)或四(RGBA)个元素(0~1)的元 组,如(1, 0, 0)或(1,0,0,1),只用于kwargs • 灰度字符串,如'0.8'
15 .Colors
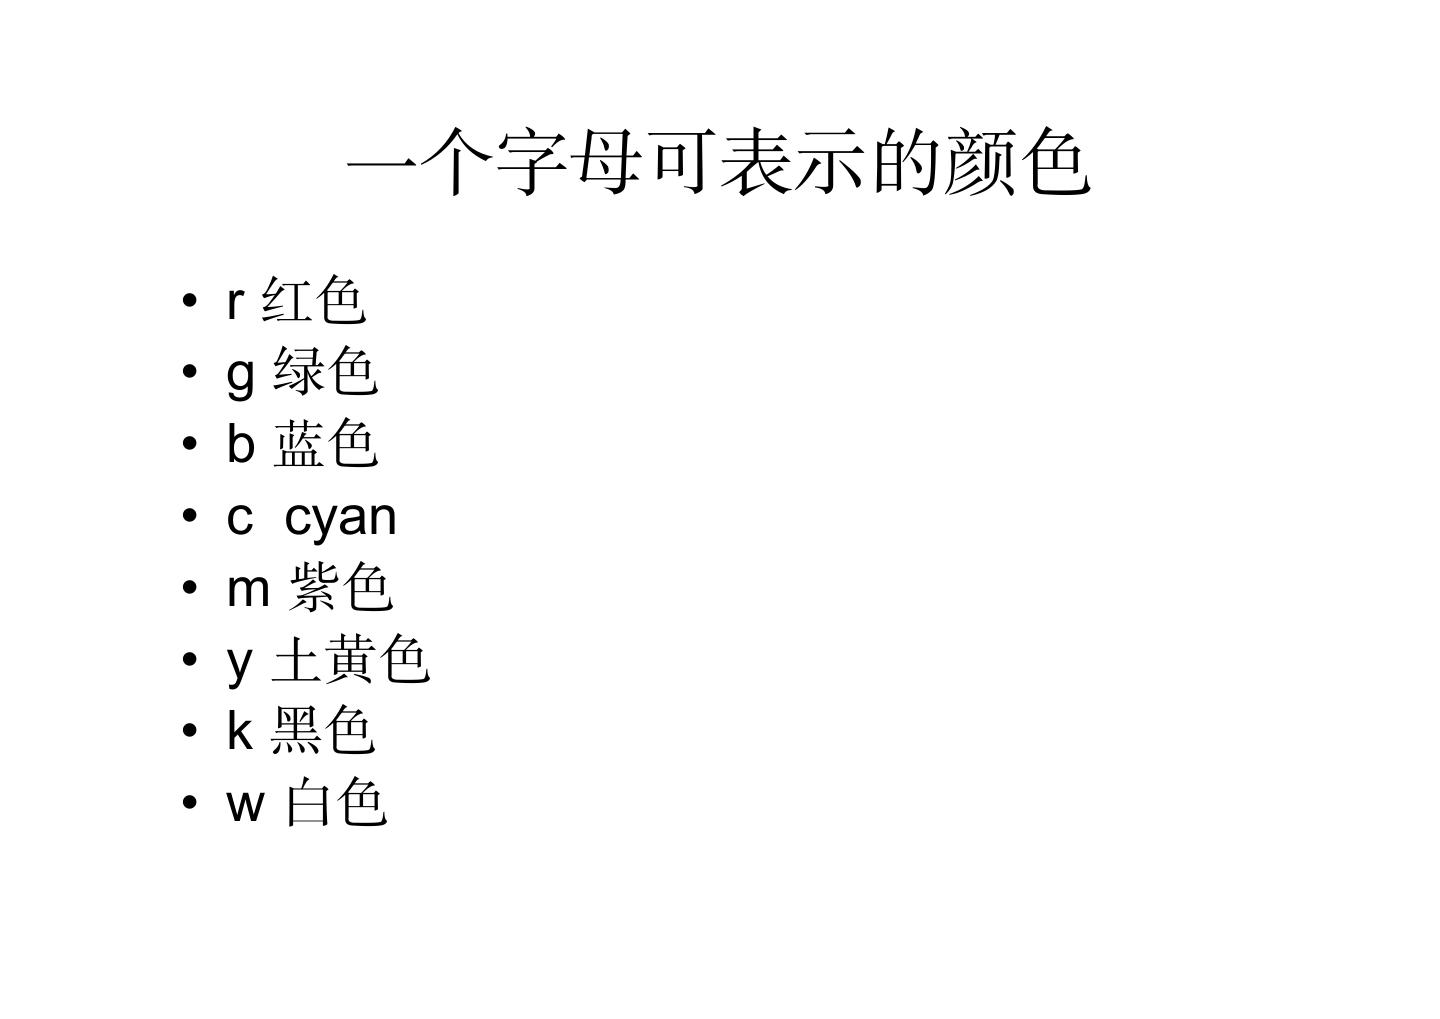
16 . 一个字母可表示的颜色 • r 红色 • g 绿色 • b 蓝色 • c cyan • m 紫色 • y 土黄色 • k 黑色 • w 白色
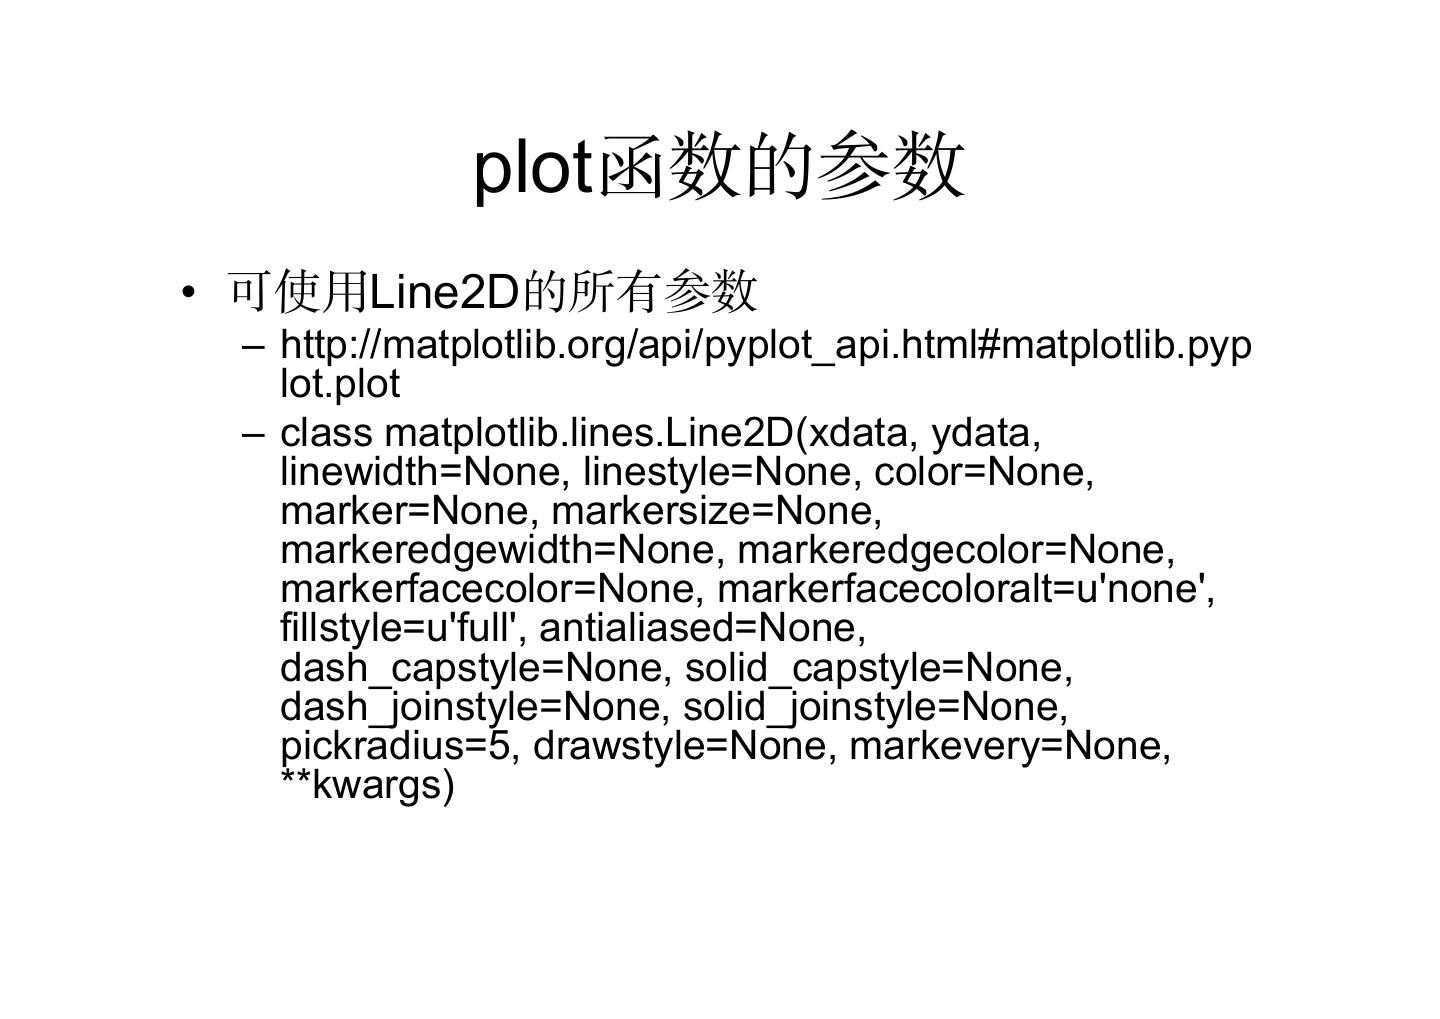
17 . plot函数的参数 • 可使用Line2D的所有参数 – http://matplotlib.org/api/pyplot_api.html#matplotlib.pyp lot.plot – class matplotlib.lines.Line2D(xdata, ydata, linewidth=None, linestyle=None, color=None, marker=None, markersize=None, markeredgewidth=None, markeredgecolor=None, markerfacecolor=None, markerfacecoloralt=u'none', fillstyle=u'full', antialiased=None, dash_capstyle=None, solid_capstyle=None, dash_joinstyle=None, solid_joinstyle=None, pickradius=5, drawstyle=None, markevery=None, **kwargs)
18 . Line2D可以指定的参数 Property Description alpha float (0.0 transparent through 1.0 opaque) antialiased or aa [True | False] axes an Axes instance color or c any matplotlib color drawstyle [‘default’ | ‘steps’ | ‘steps-pre’ | ‘steps-mid’ | ‘steps-post’] fillstyle [‘full’ | ‘left’ | ‘right’ | ‘bottom’ | ‘top’ | ‘none’] label string or anything printable with ‘%s’ conversion linestyle or ls ['-' | '--' | '-.' | ':' | 'None' | ' ' | ''] linewidth or lw float value in points
19 . Line2D可以指定的参数 Property Description marker A valid marker style markeredgecolor or mec any matplotlib color markeredgewidth or mew float value in points markerfacecolor or mfc any matplotlib color markerfacecoloralt or mfcalt any matplotlib color markersize or ms float markevery [None | int | length-2 tuple of int | slice | list/array of int | float | length-2 tuple of float] xdata 1D array ydata 1D array visible [True | False]
20 . fill style markeredgecolor (mec) markeredgewidth (mew) markerfacecolor (mfc) markerfacecoloralt (mfcalt) 1. 默认替代颜色为无色,不是灰色 2. 只设置color,相当于同时设置了mec和mfc
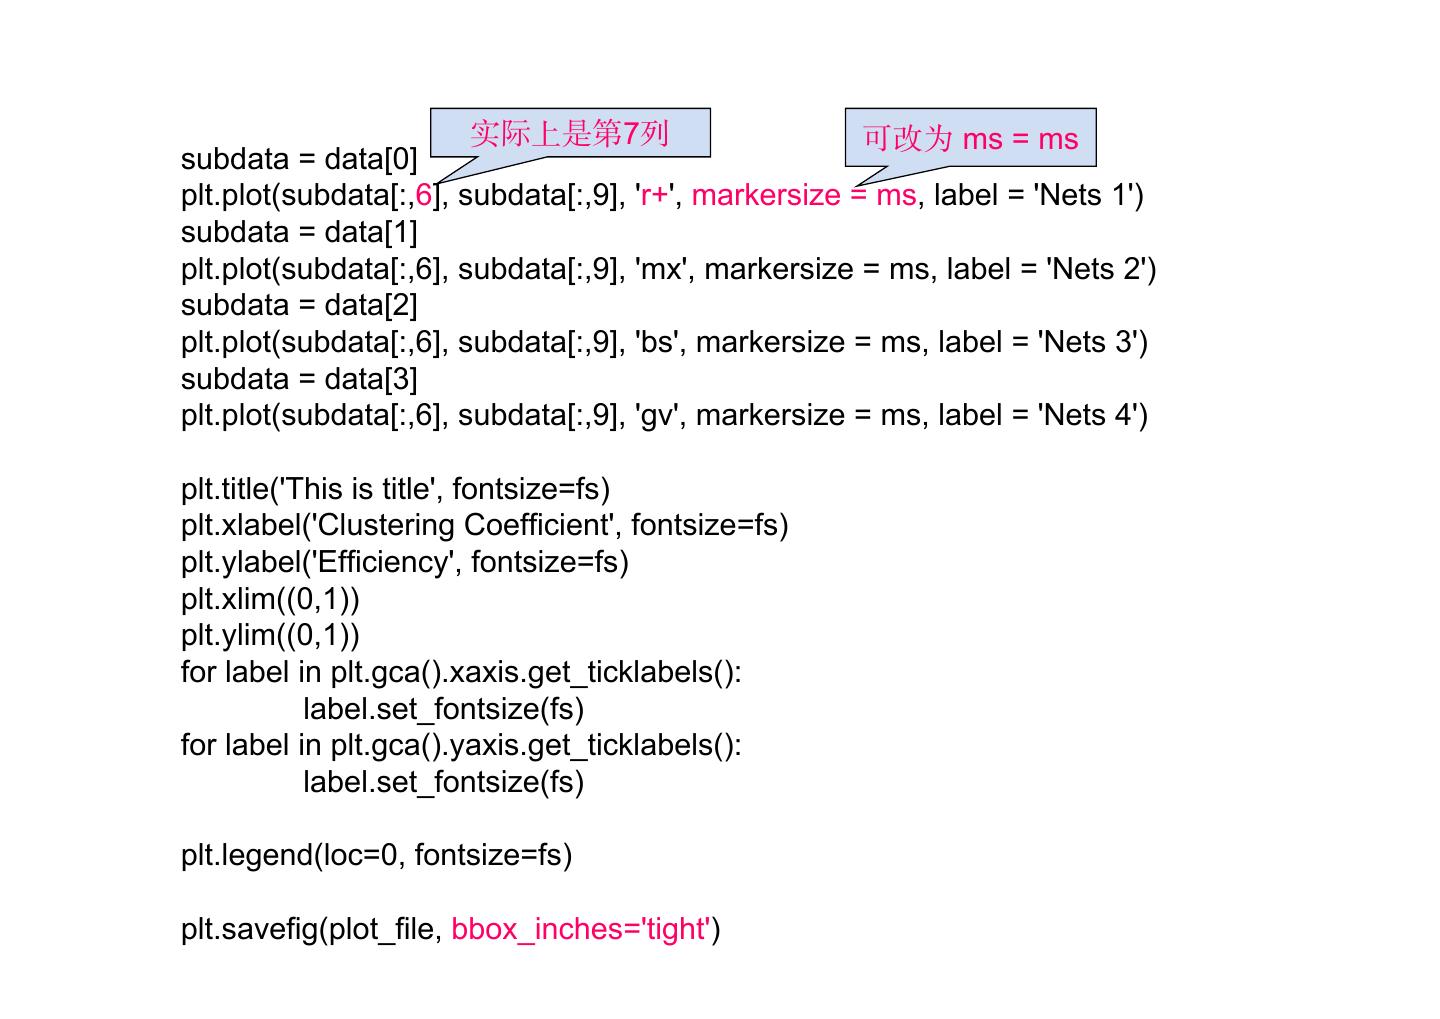
21 . 实际上是第7列 可改为 ms = ms subdata = data[0] plt.plot(subdata[:,6], subdata[:,9], 'r+', markersize = ms, label = 'Nets 1') subdata = data[1] plt.plot(subdata[:,6], subdata[:,9], 'mx', markersize = ms, label = 'Nets 2') subdata = data[2] plt.plot(subdata[:,6], subdata[:,9], 'bs', markersize = ms, label = 'Nets 3') subdata = data[3] plt.plot(subdata[:,6], subdata[:,9], 'gv', markersize = ms, label = 'Nets 4') plt.title('This is title', fontsize=fs) plt.xlabel('Clustering Coefficient', fontsize=fs) plt.ylabel('Efficiency', fontsize=fs) plt.xlim((0,1)) plt.ylim((0,1)) for label in plt.gca().xaxis.get_ticklabels(): label.set_fontsize(fs) for label in plt.gca().yaxis.get_ticklabels(): label.set_fontsize(fs) plt.legend(loc=0, fontsize=fs) plt.savefig(plot_file, bbox_inches='tight')
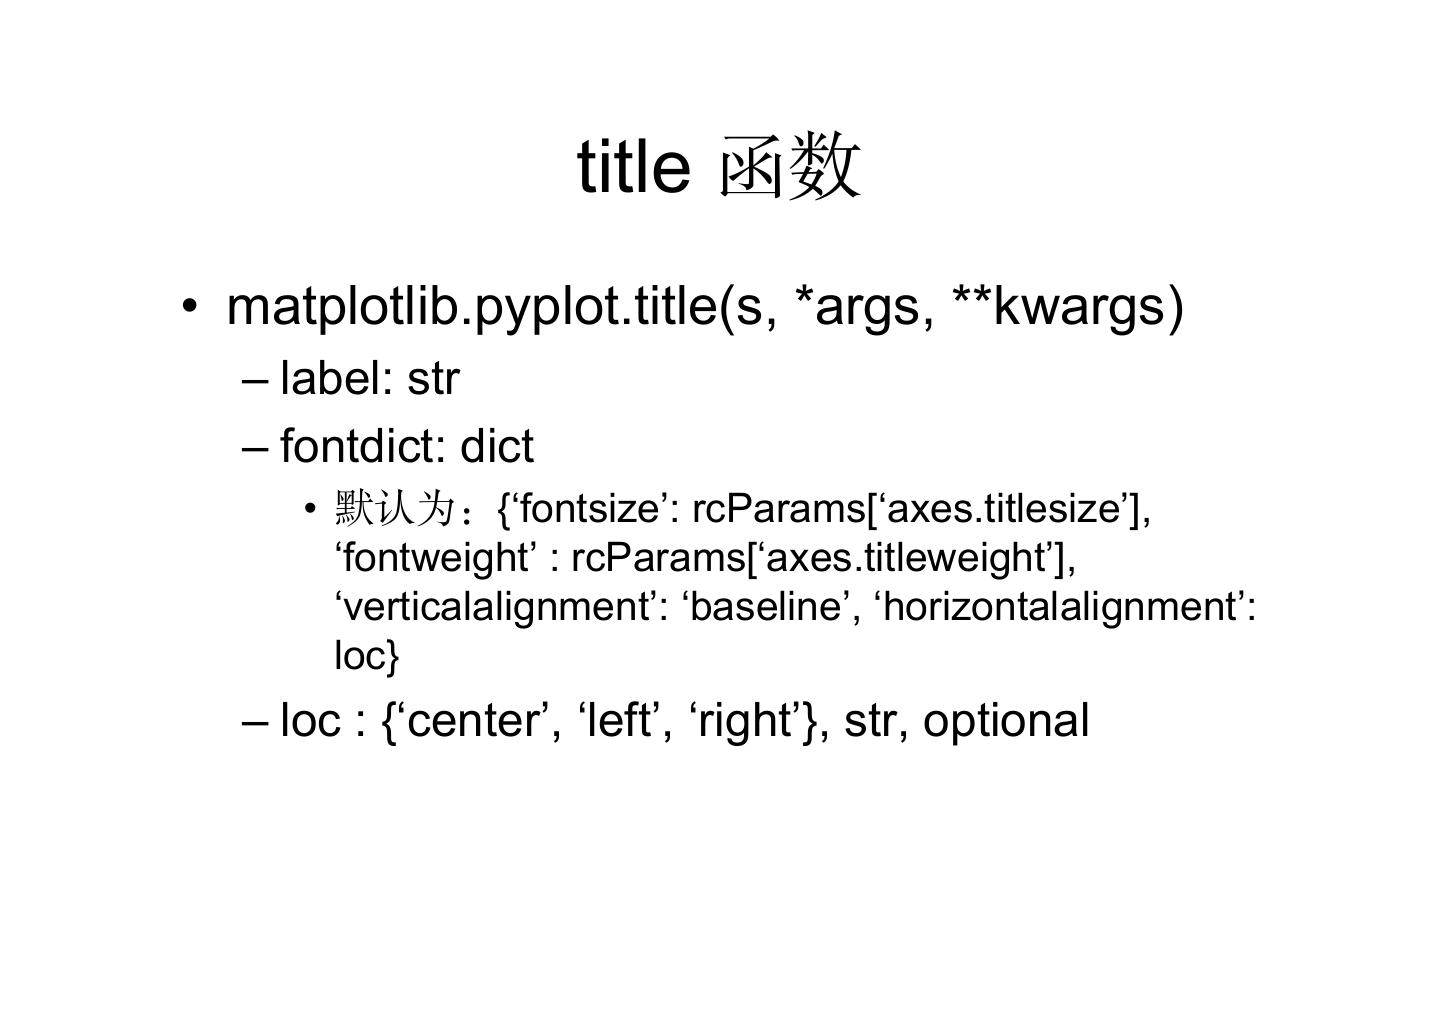
22 . title 函数 • matplotlib.pyplot.title(s, *args, **kwargs) – label: str – fontdict: dict • 默认为:{‘fontsize’: rcParams[‘axes.titlesize’], ‘fontweight’ : rcParams[‘axes.titleweight’], ‘verticalalignment’: ‘baseline’, ‘horizontalalignment’: loc} – loc : {‘center’, ‘left’, ‘right’}, str, optional
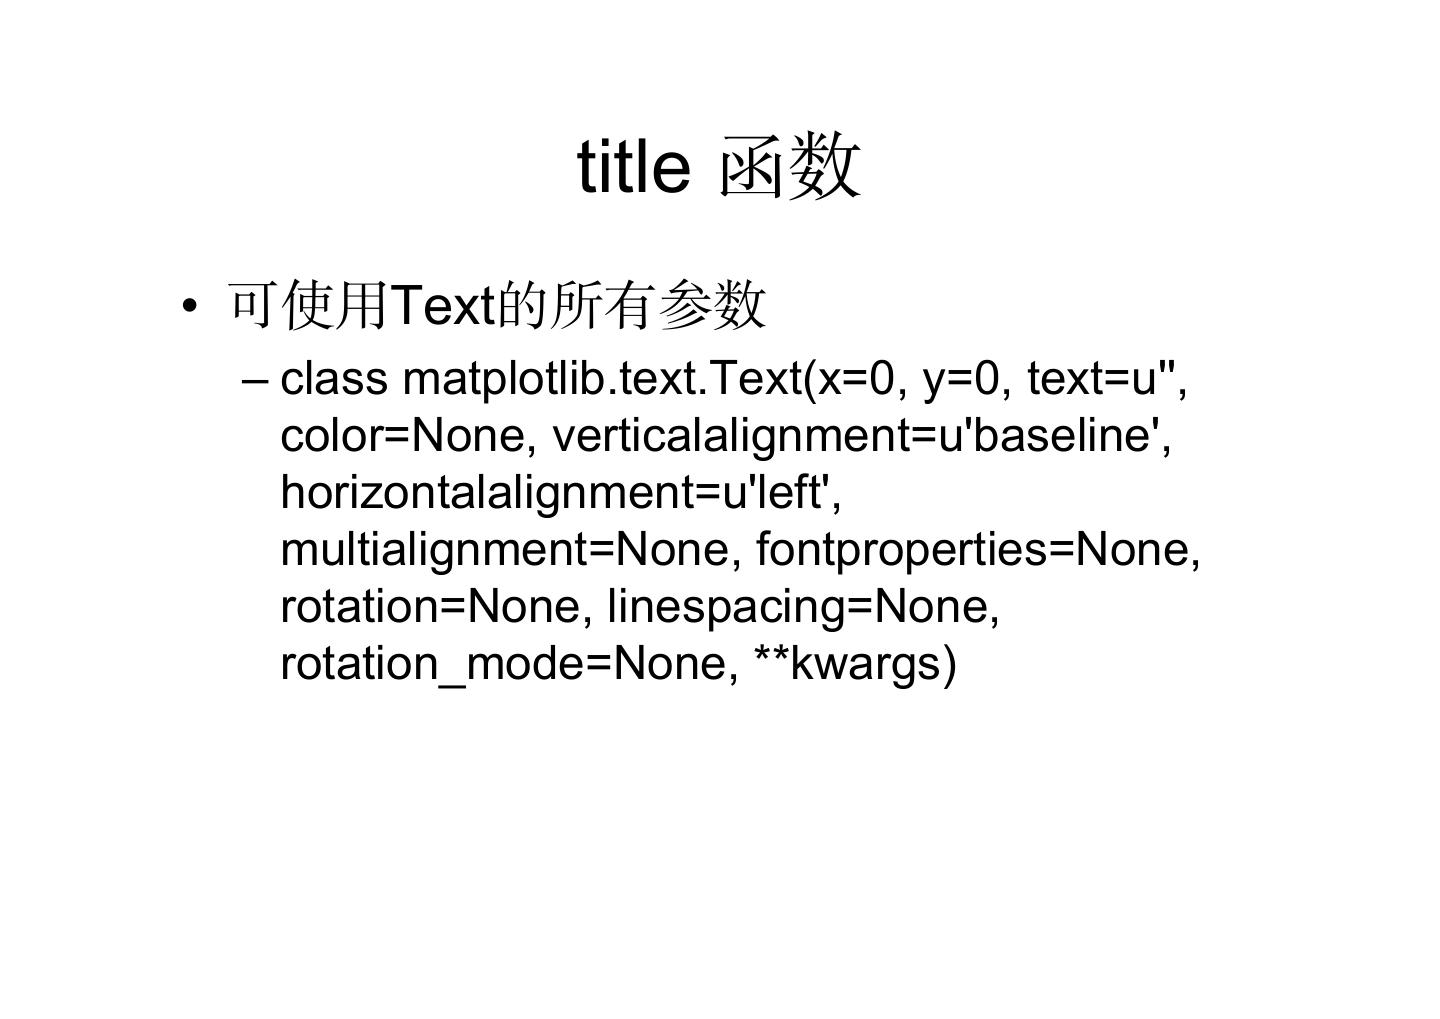
23 . title 函数 • 可使用Text的所有参数 – class matplotlib.text.Text(x=0, y=0, text=u'', color=None, verticalalignment=u'baseline', horizontalalignment=u'left', multialignment=None, fontproperties=None, rotation=None, linespacing=None, rotation_mode=None, **kwargs)
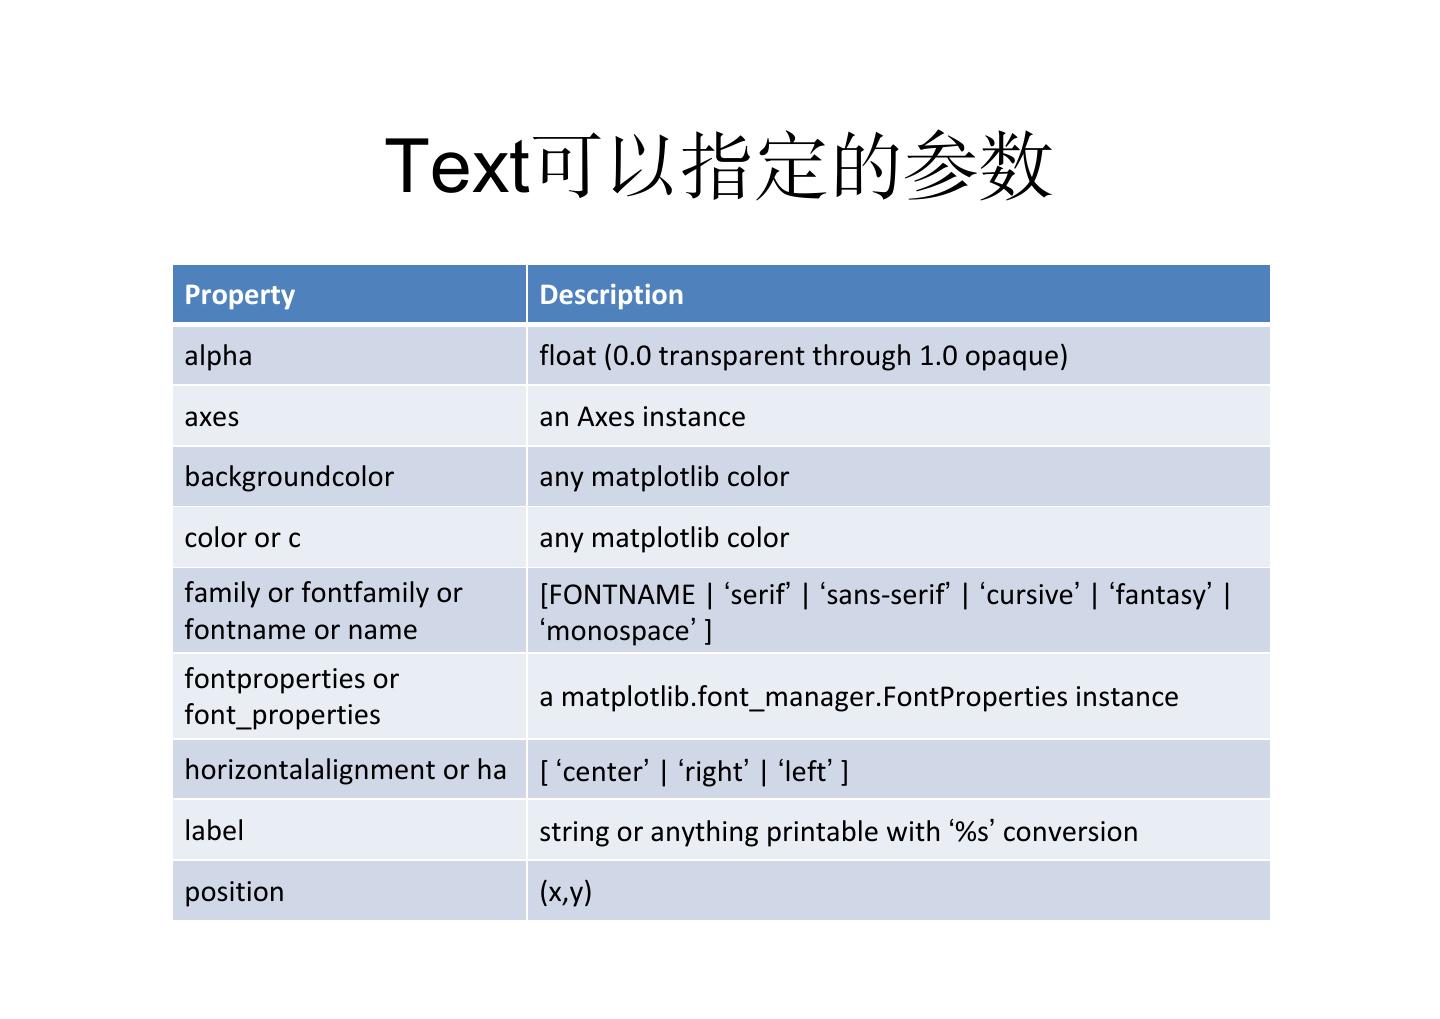
24 . Text可以指定的参数 Property Description alpha float (0.0 transparent through 1.0 opaque) axes an Axes instance backgroundcolor any matplotlib color color or c any matplotlib color family or fontfamily or [FONTNAME | ‘serif’ | ‘sans-serif’ | ‘cursive’ | ‘fantasy’ | fontname or name ‘monospace’ ] fontproperties or a matplotlib.font_manager.FontProperties instance font_properties horizontalalignment or ha [ ‘center’ | ‘right’ | ‘left’ ] label string or anything printable with ‘%s’ conversion position (x,y)
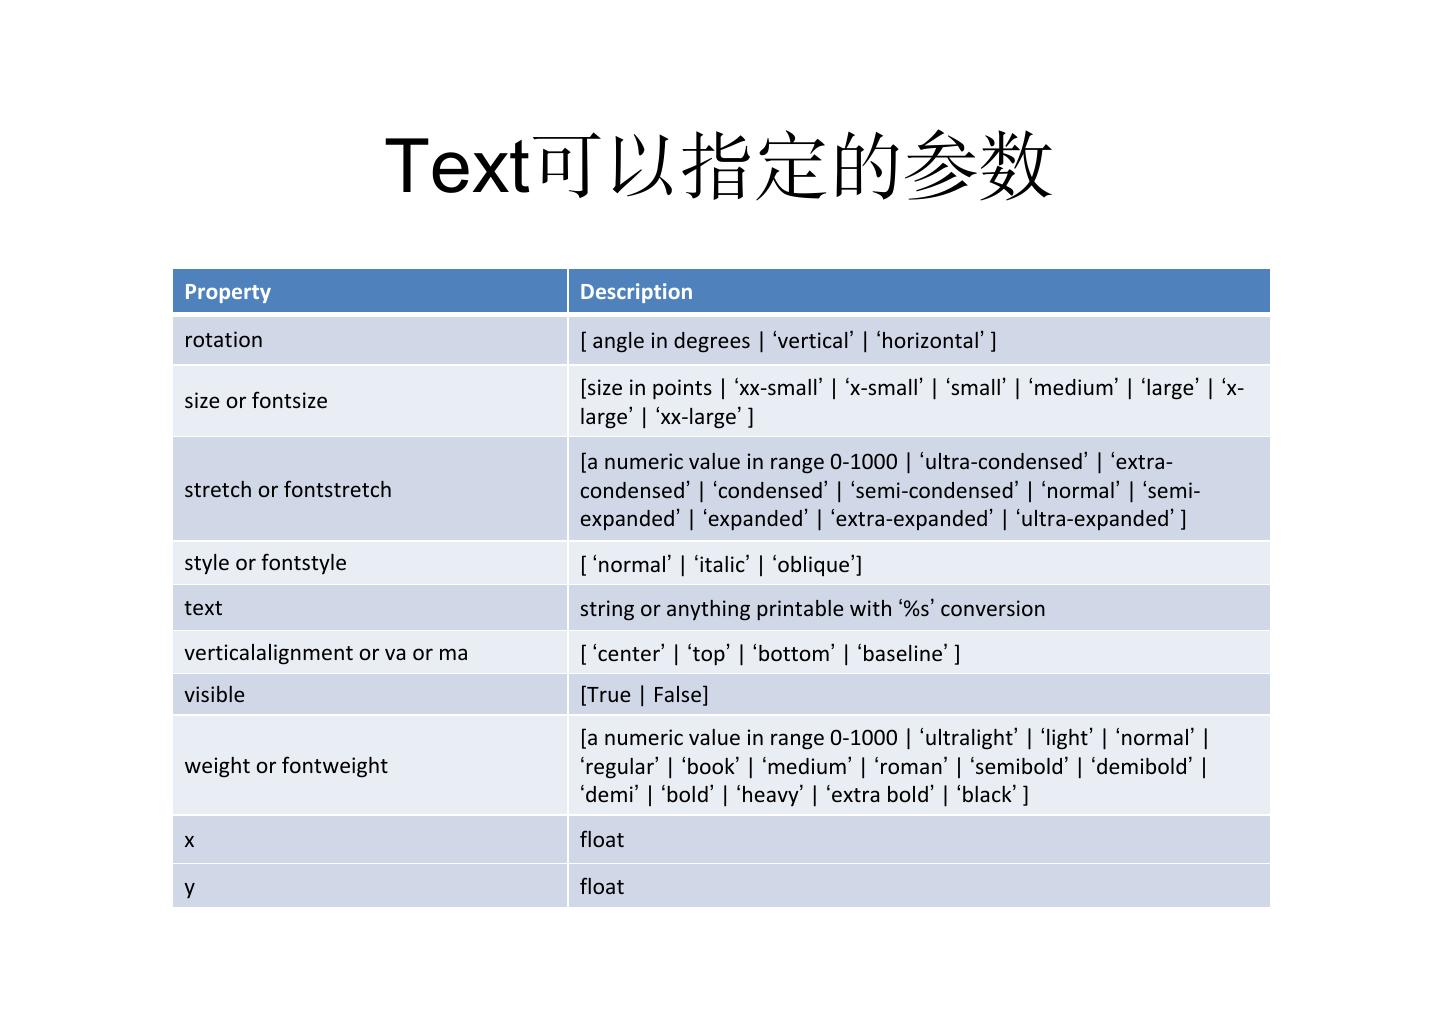
25 . Text可以指定的参数 Property Description rotation [ angle in degrees | ‘vertical’ | ‘horizontal’ ] [size in points | ‘xx-small’ | ‘x-small’ | ‘small’ | ‘medium’ | ‘large’ | ‘x- size or fontsize large’ | ‘xx-large’ ] [a numeric value in range 0-1000 | ‘ultra-condensed’ | ‘extra- stretch or fontstretch condensed’ | ‘condensed’ | ‘semi-condensed’ | ‘normal’ | ‘semi- expanded’ | ‘expanded’ | ‘extra-expanded’ | ‘ultra-expanded’ ] style or fontstyle [ ‘normal’ | ‘italic’ | ‘oblique’] text string or anything printable with ‘%s’ conversion verticalalignment or va or ma [ ‘center’ | ‘top’ | ‘bottom’ | ‘baseline’ ] visible [True | False] [a numeric value in range 0-1000 | ‘ultralight’ | ‘light’ | ‘normal’ | weight or fontweight ‘regular’ | ‘book’ | ‘medium’ | ‘roman’ | ‘semibold’ | ‘demibold’ | ‘demi’ | ‘bold’ | ‘heavy’ | ‘extra bold’ | ‘black’ ] x float y float
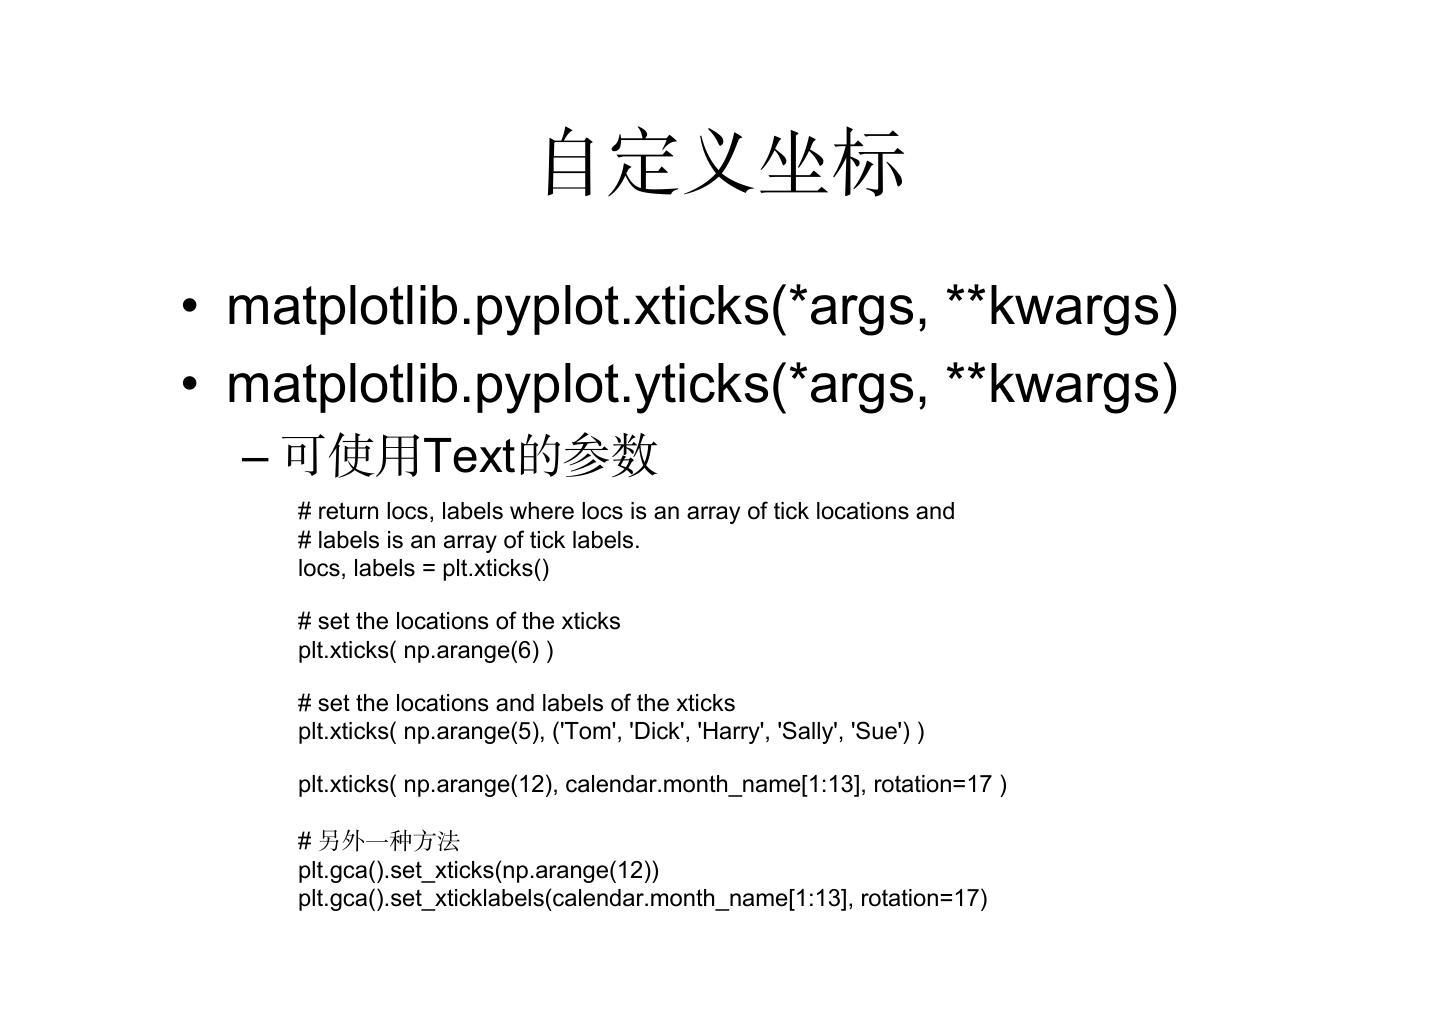
26 . xlabel, ylabel • 设置横坐标和纵坐标的名字 • 用法与 title一样
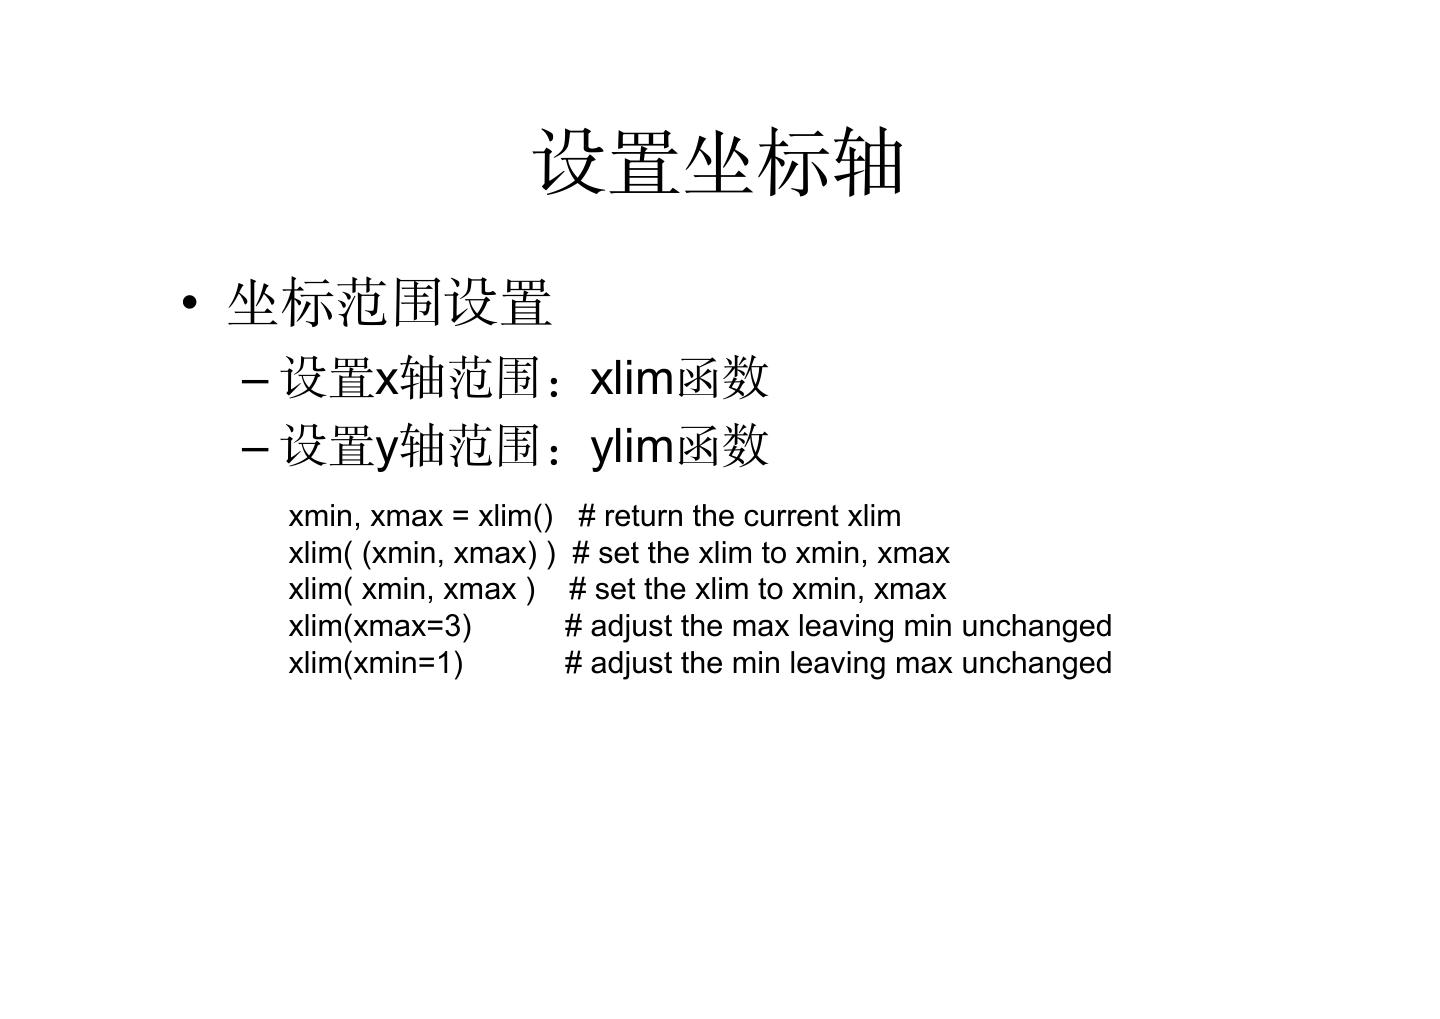
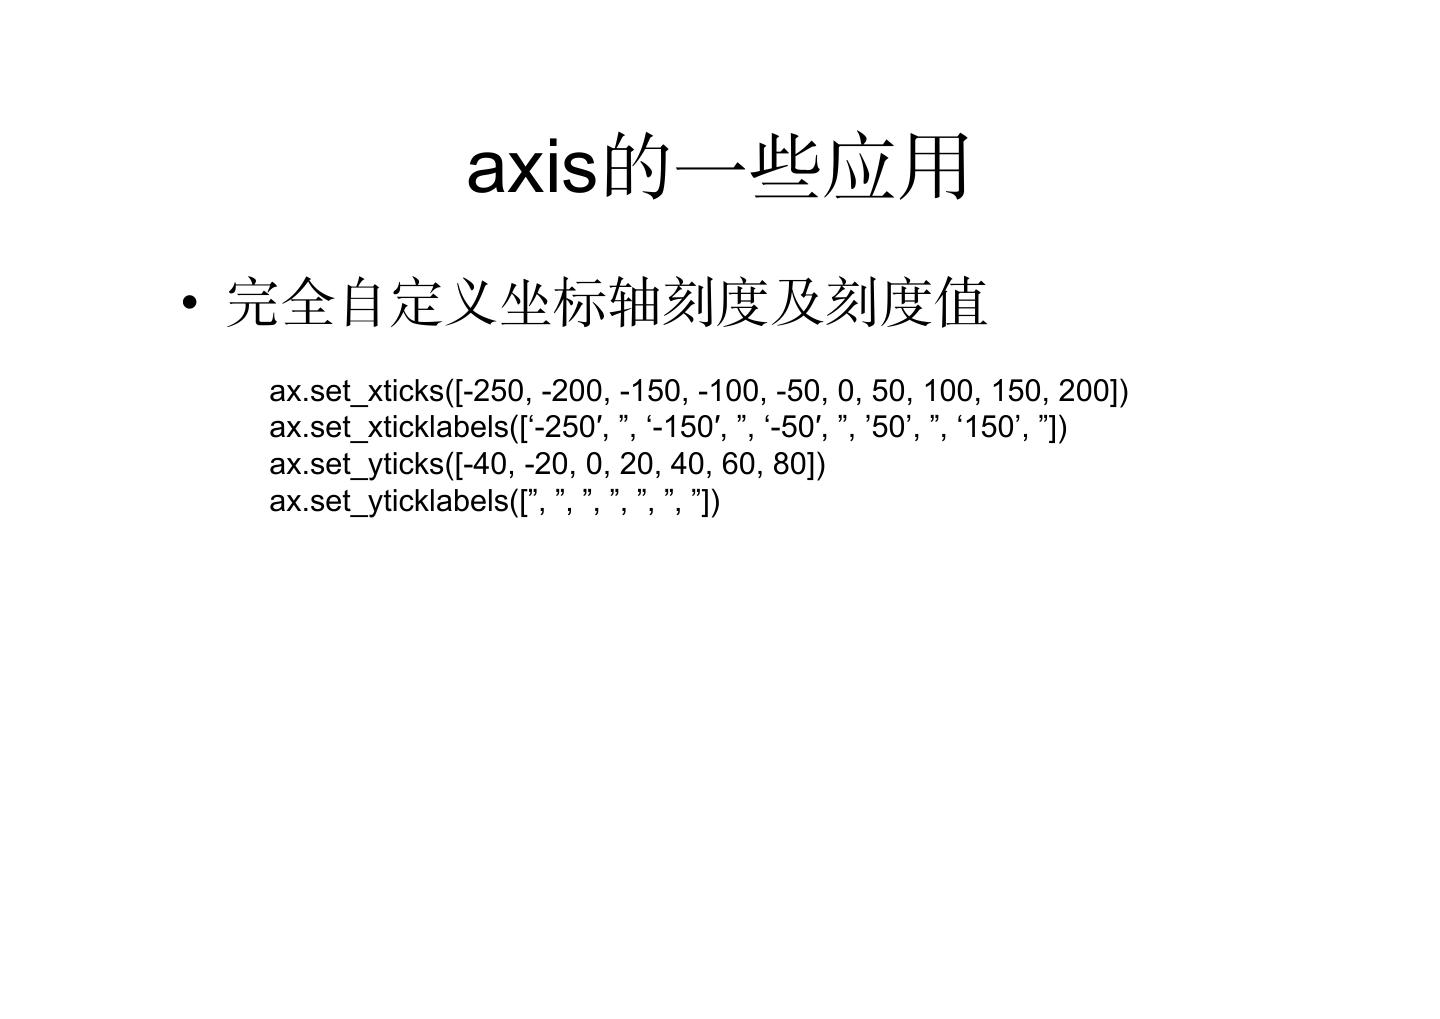
27 . 设置坐标轴 • 坐标范围设置 – 设置x轴范围:xlim函数 – 设置y轴范围:ylim函数 xmin, xmax = xlim() # return the current xlim xlim( (xmin, xmax) ) # set the xlim to xmin, xmax xlim( xmin, xmax ) # set the xlim to xmin, xmax xlim(xmax=3) # adjust the max leaving min unchanged xlim(xmin=1) # adjust the min leaving max unchanged
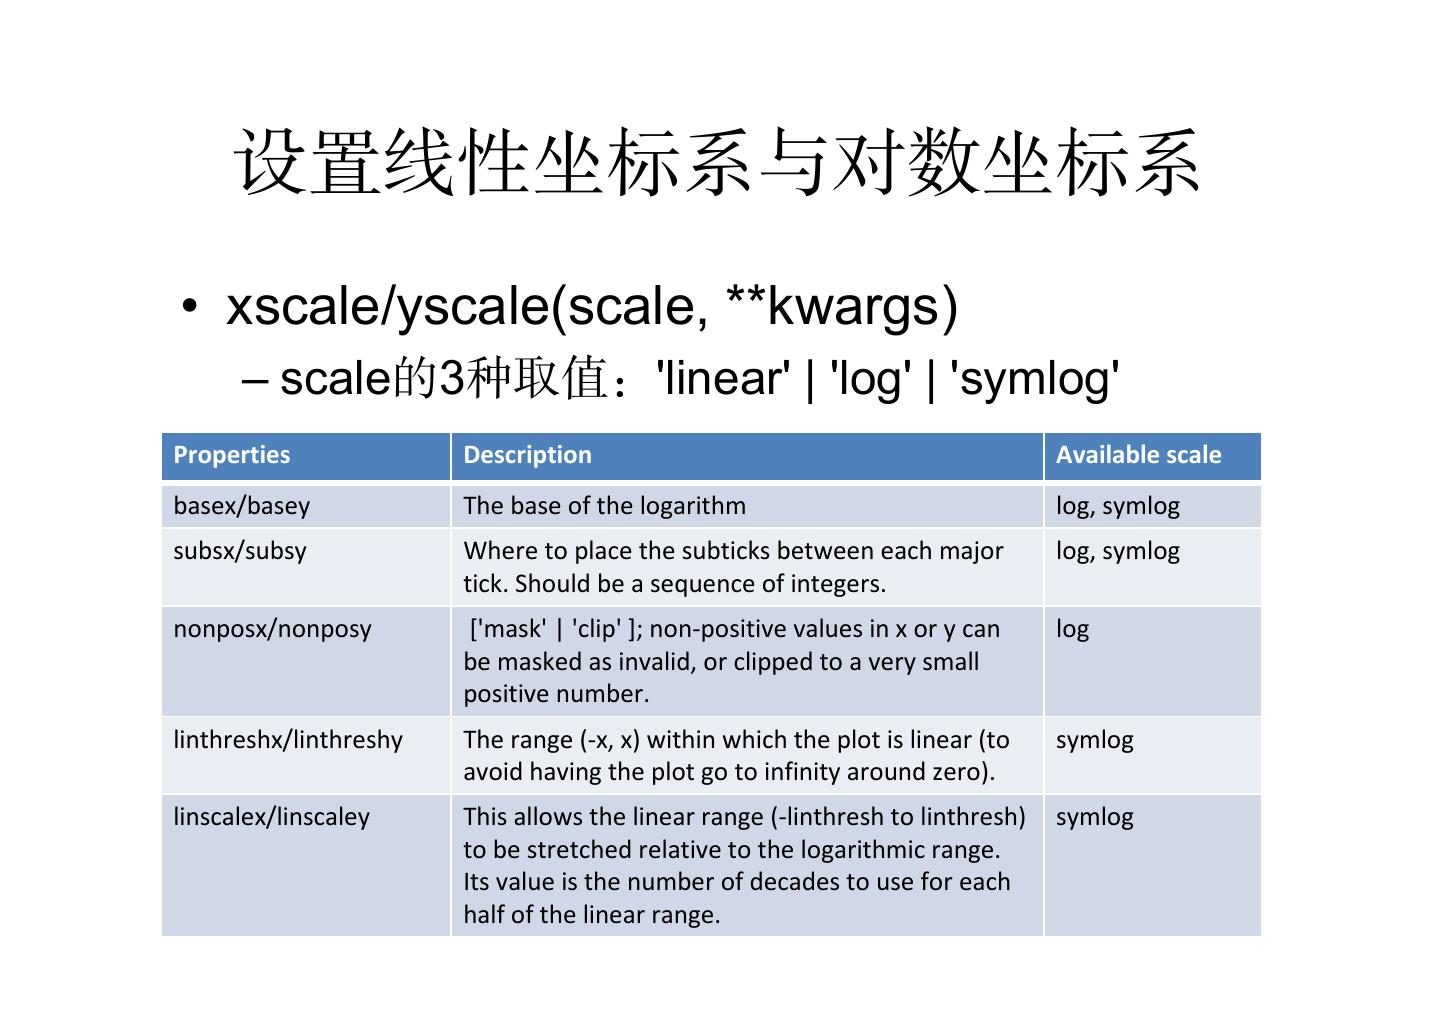
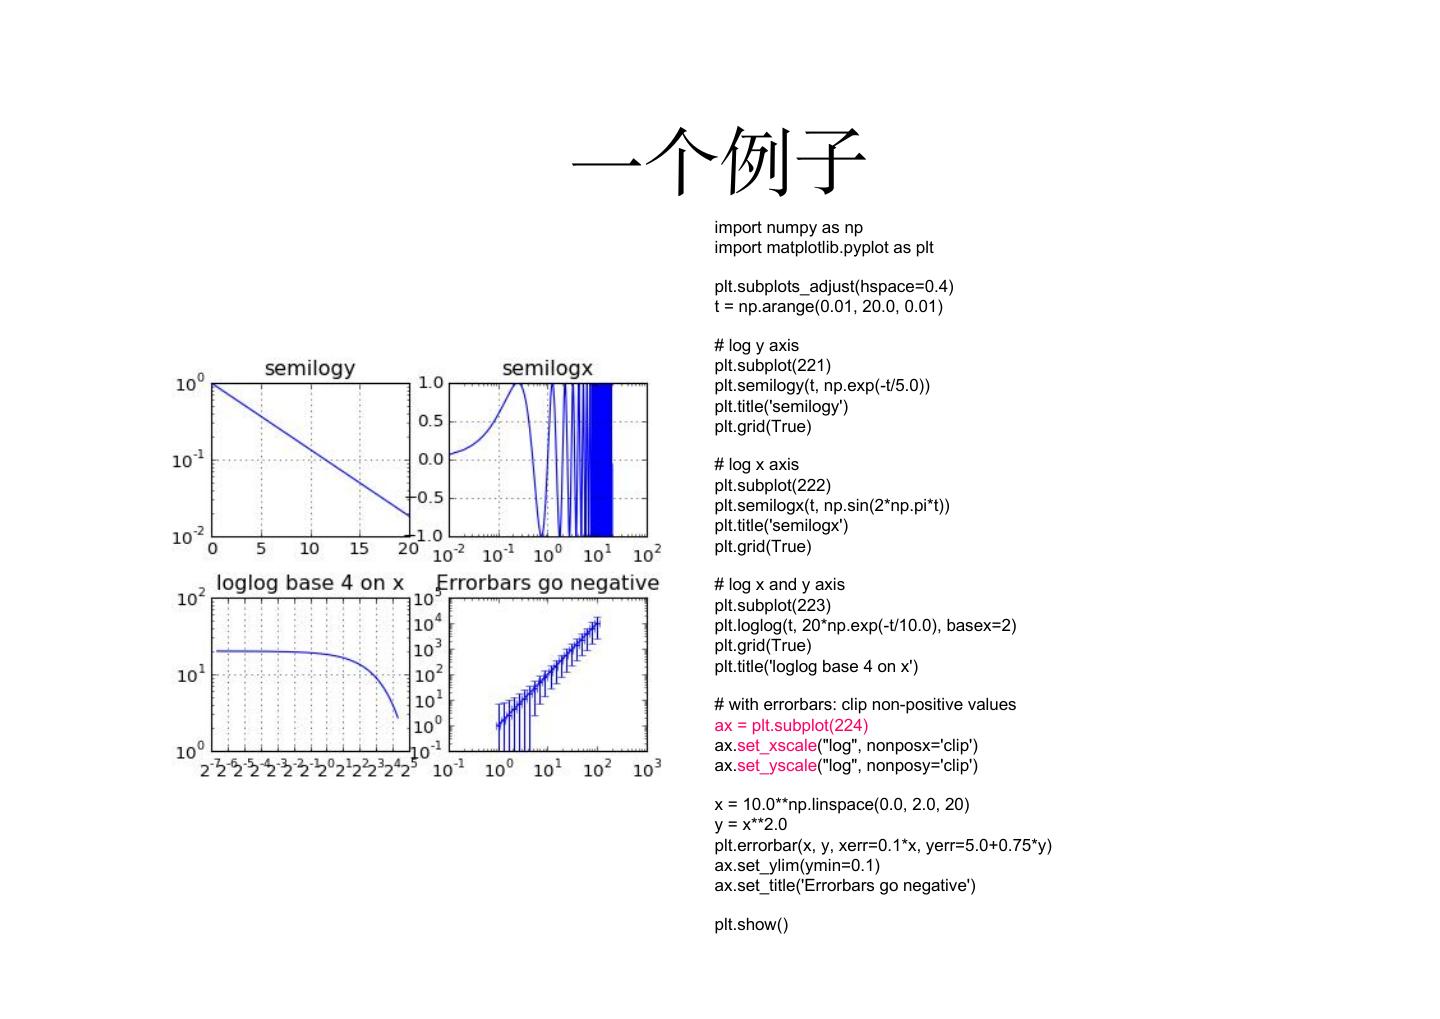
28 . 设置线性坐标系与对数坐标系 • xscale/yscale(scale, **kwargs) – scale的3种取值:'linear' | 'log' | 'symlog' Properties Description Available scale basex/basey The base of the logarithm log, symlog subsx/subsy Where to place the subticks between each major log, symlog tick. Should be a sequence of integers. nonposx/nonposy ['mask' | 'clip' ]; non-positive values in x or y can log be masked as invalid, or clipped to a very small positive number. linthreshx/linthreshy The range (-x, x) within which the plot is linear (to symlog avoid having the plot go to infinity around zero). linscalex/linscaley This allows the linear range (-linthresh to linthresh) symlog to be stretched relative to the logarithmic range. Its value is the number of decades to use for each half of the linear range.
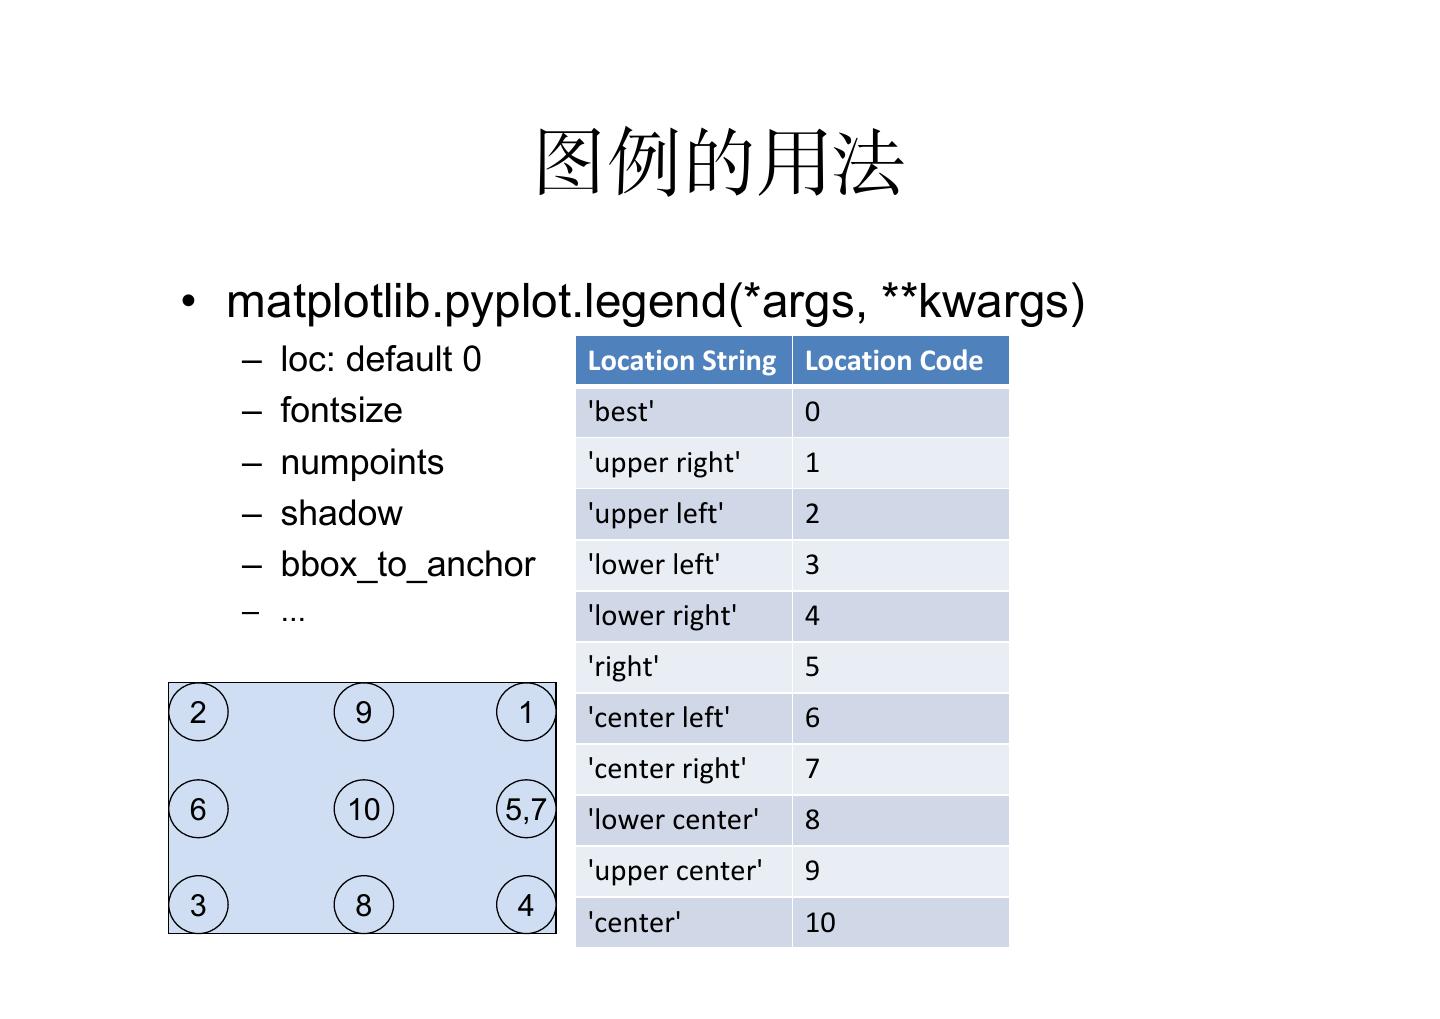
29 . 在对数坐标系下画图 • matplotlib.pyplot.semilogx(*args, **kwargs) • matplotlib.pyplot.semilogy(*args, **kwargs) • matplotlib.pyplot.loglog(*args, **kwargs) • 参数同plot (Line2D) • 注意与前面xscale/yscale函数的区别 – xscale/yscale 只设置坐标系,没有画图功能
3秒后跳转登录页面
去登陆

