- 快召唤伙伴们来围观吧
- 微博 QQ QQ空间 贴吧
- 文档嵌入链接
- 复制
- 微信扫一扫分享
- 已成功复制到剪贴板
无缝整合——将 Kubernetes 融入您现有的监控堆栈中
展开查看详情
1 . Seamless Integration - Take Kubernetes into your Existing Monitoring Stack
2 .Agenda • About Me • Background • Problem • Solution • Solution scenarios
3 .About Me • Iris Ding ( - dingsj@cn.ibm.com • IBMer • Rich Experience on Middleware production development experience • Rich Experience on Open Source development • Apache CXF committer • Current focus on Service Mesh, Istio
4 .Background
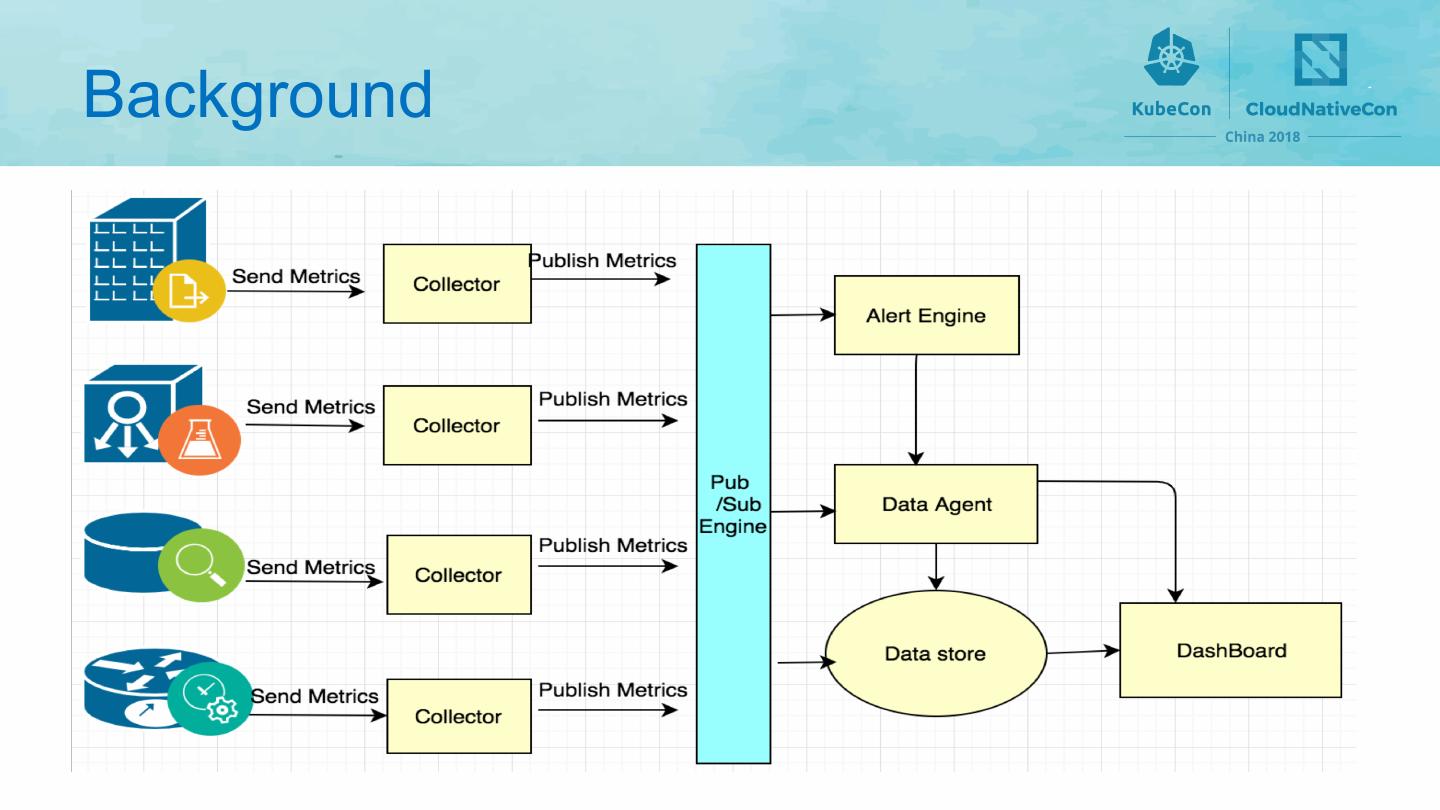
5 .Background
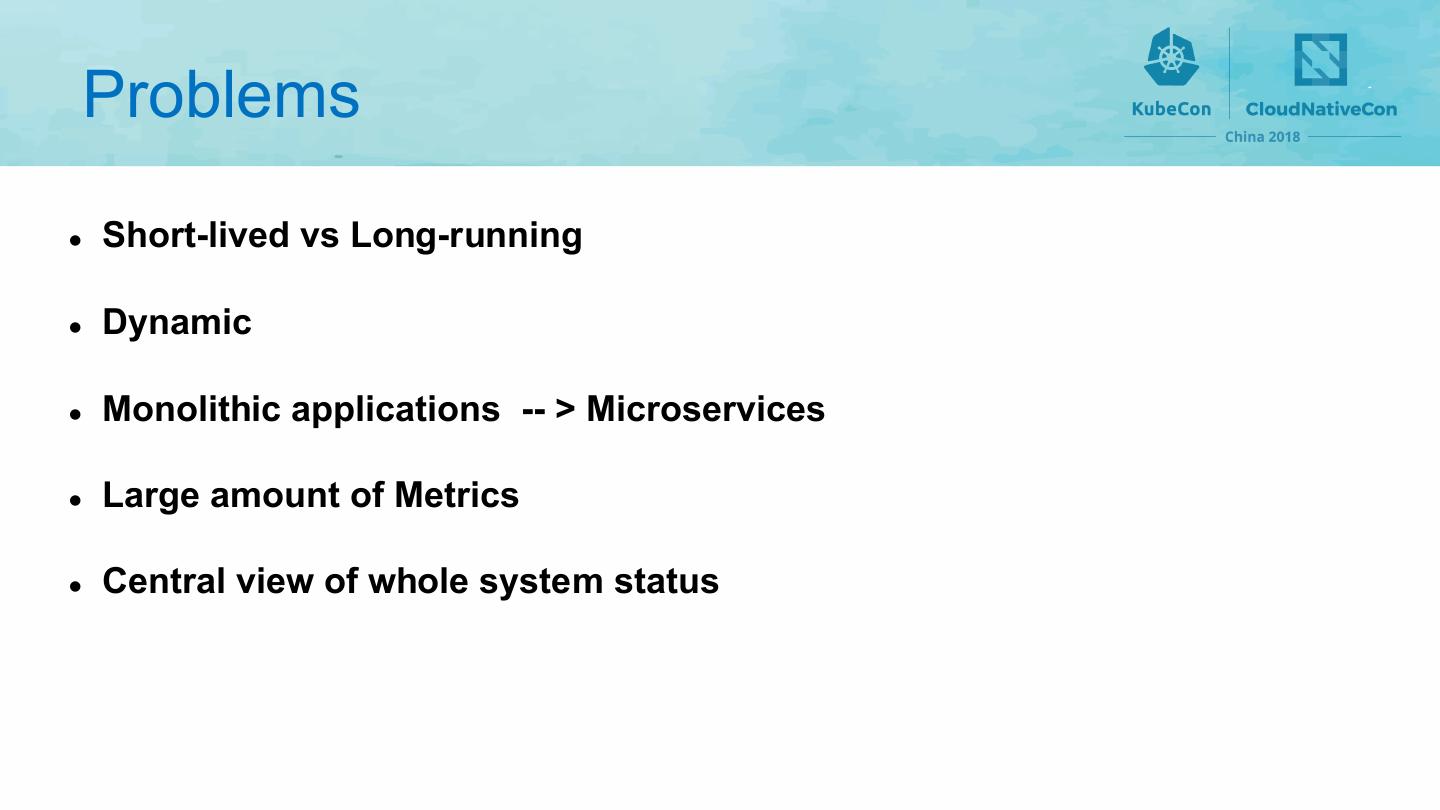
6 . Problems l Short-lived vs Long-running l Dynamic l Monolithic applications -- > Microservices l Large amount of Metrics l Central view of whole system status
7 .Metrics Integration Architecture Internal monitoring tools Internal and Platform Collection of Metrics Native IBM Cloud Monitoring Collectors Prometheus adapter Metrics streaming Cloud Monitoring Service Graphite adapter Web hook Bus metrics collection (Kafka) CollectD adapter metrics st … Metrics Flow (metrics bus) re am in g 3rd party monitoring services
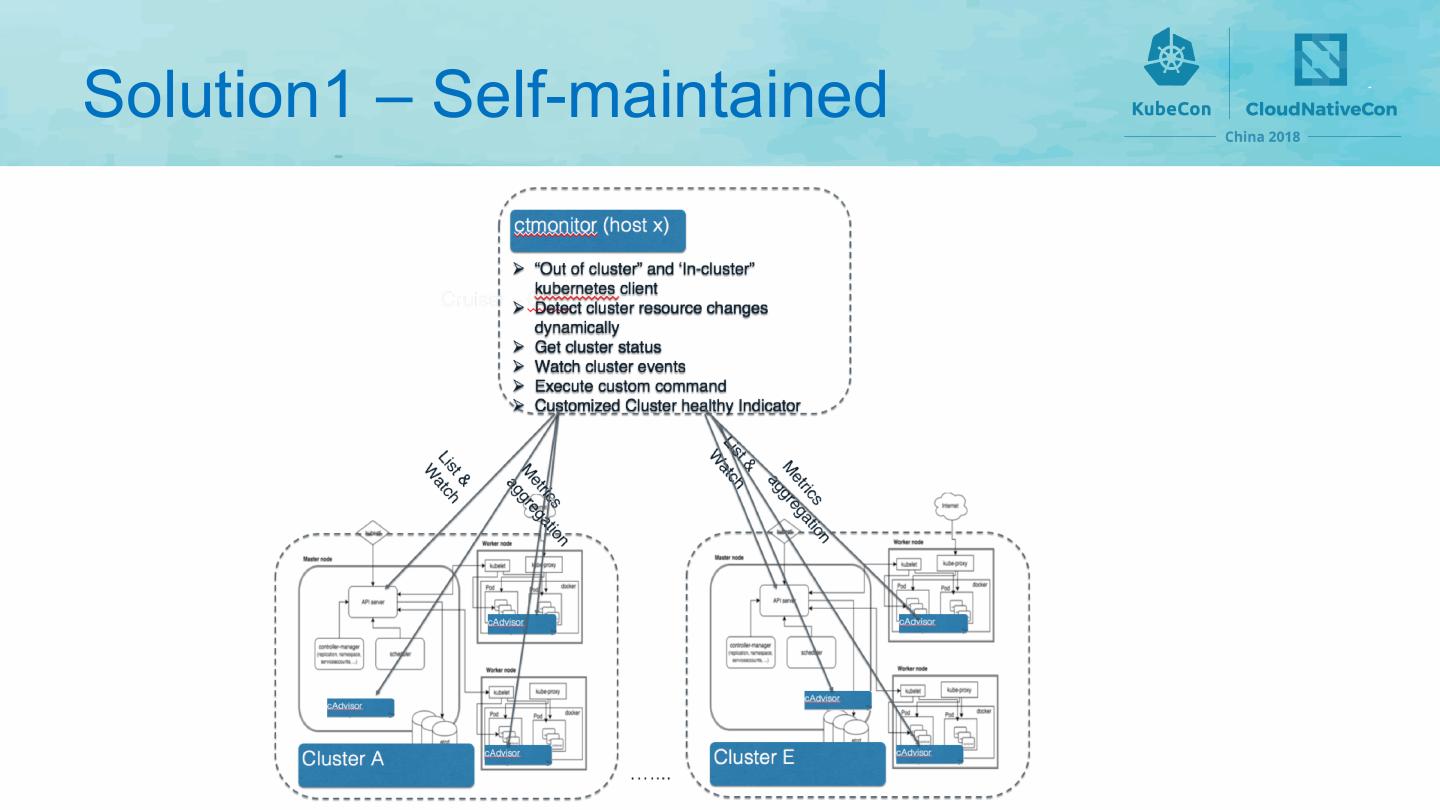
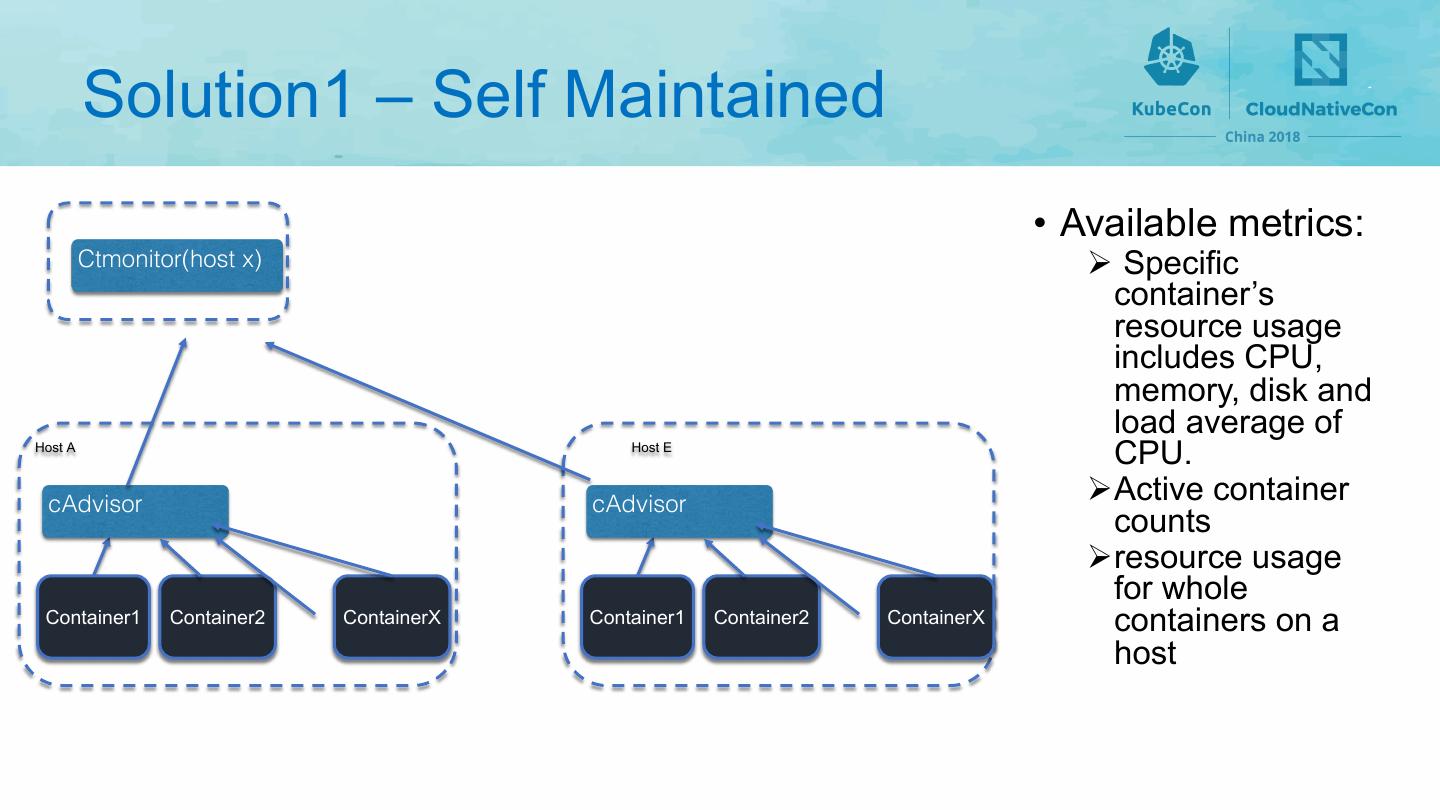
8 .Solution1 – Self-maintained
9 .Solution1 – Self Maintained l Resource usages for whole cluster l Resource usage for pod l Resource usage for every containers in the cluster l Resource usage for nodes l Node status , Pod status, Node Number, Pod Number l Cluster events l Specific metrics via executing command
10 . Solution1 – Self Maintained • Available metrics: Ctmonitor(host x) Ø Specific container’s resource usage includes CPU, memory, disk and load average of Host A Host E CPU. cAdvisor … cAdvisor … ØActive container counts Pods and Pods and Øresource usage services services for whole …....stContainerX …....stContainerX Container1 Container2 A Container1 Container2 A containers on a host …....
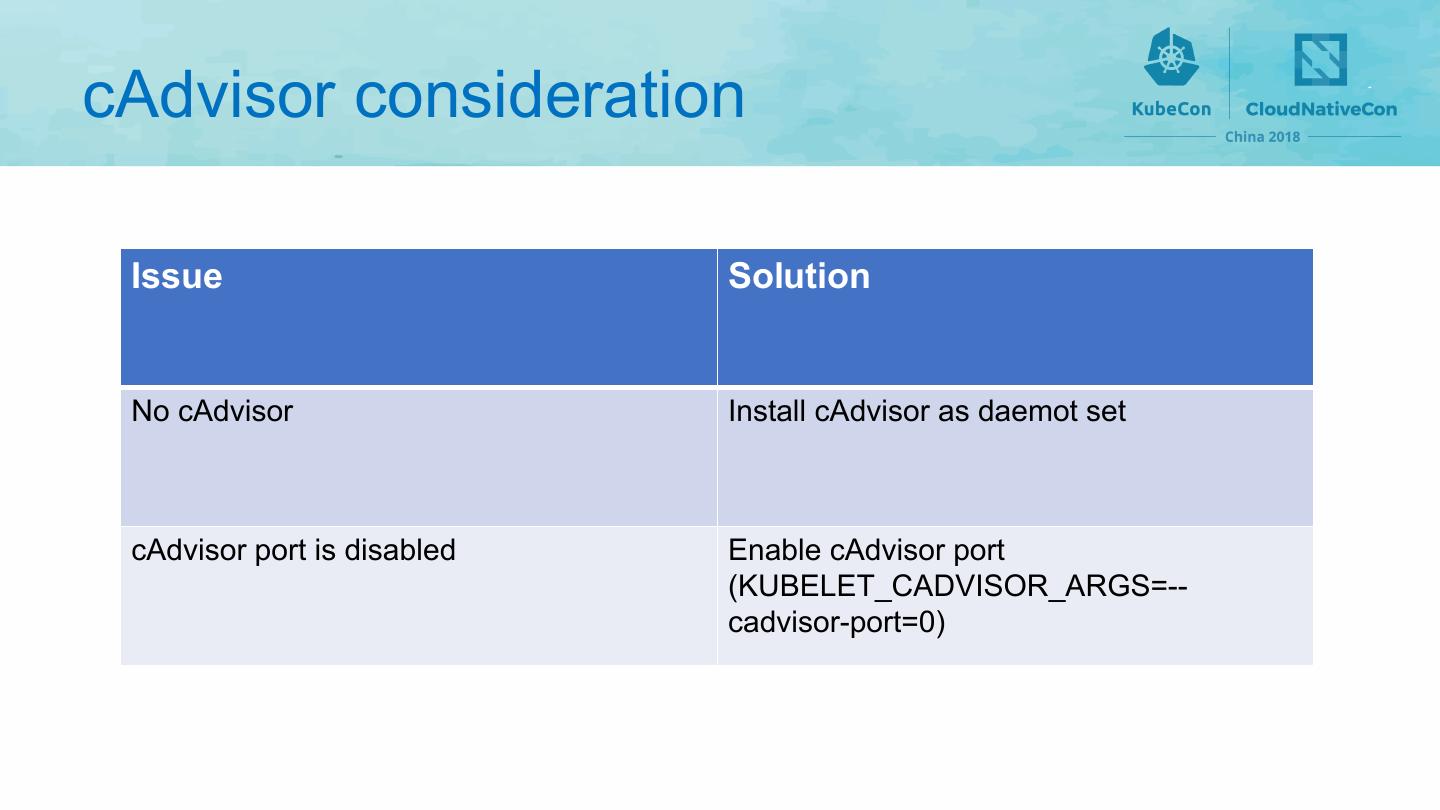
11 .cAdvisor consideration Issue Solution No cAdvisor Install cAdvisor as daemot set cAdvisor port is disabled Enable cAdvisor port (KUBELET_CADVISOR_ARGS=-- cadvisor-port=0)
12 .Solution 1 - Dashboard
13 .Solution 2 - Prometheus Prometheus PromQL PromAdapter Metrics streaming Monitoring Web hook consumer metrics collection Bus Service (Kafka)
14 .Solution 3 - Prometheus Raw Metrics Prometheus PromAdapter Remote_write Metrics streaming Monitoring Web hook consumer metrics collection Bus Service (Kafka)
15 .Solution 4 – Exporter Only API Server Scrape Worker targets Custom Worker Controller Metrics streaming Monitoring Web hook consumer metrics collection Bus Service (Kafka)
16 .Prometheus Dashboard
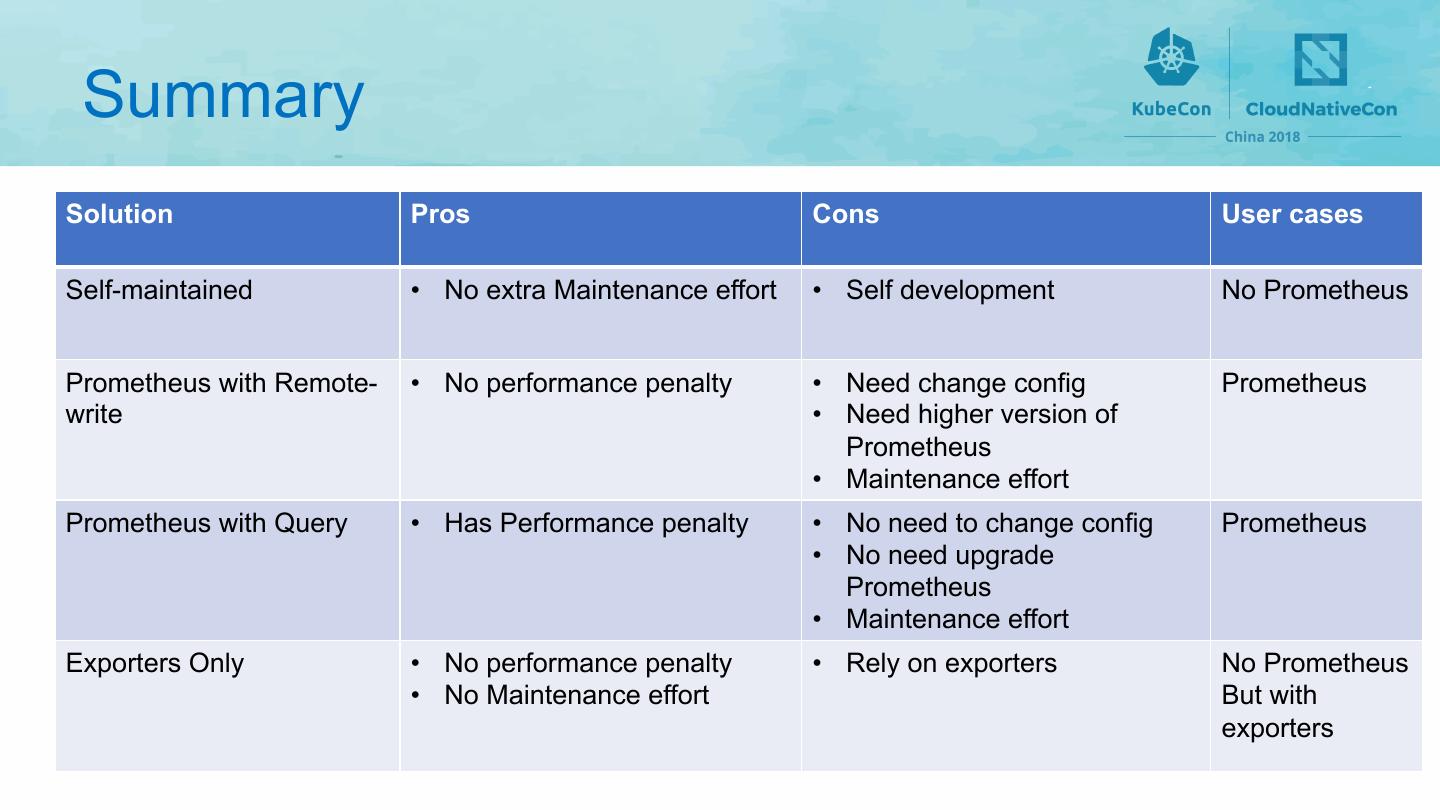
17 . Summary Solution Pros Cons User cases Self-maintained • No extra Maintenance effort • Self development No Prometheus Prometheus with Remote- • No performance penalty • Need change config Prometheus write • Need higher version of Prometheus • Maintenance effort Prometheus with Query • Has Performance penalty • No need to change config Prometheus • No need upgrade Prometheus • Maintenance effort Exporters Only • No performance penalty • Rely on exporters No Prometheus • No Maintenance effort But with exporters
18 .Alert Integration
19 .Demo
20 . THANKS! Iris Ding dingsj@cn.ibm.com irisdingbj@gmail.com
21 .


