


- 快召唤伙伴们来围观吧
- 微博 QQ QQ空间 贴吧
- 文档嵌入链接
- 复制
- 微信扫一扫分享
- 已成功复制到剪贴板
由 OpenTracing 一探分布式系统执行的迷宫——Ashlie Martinez & Ilya Kislenko, Kasten
随着分布式系统变得寻常无奇,来自这些系统中组织有序、易于分析的调试信息已成为必不可少的需要。然而,在分布式系统中增添追踪面临着独一无二的挑战,如在进程间和服务间关联相关的追踪信息、以最小侵入的改变添加追踪基础架构、决定何时已添加足够的追踪。
本次演讲包括 Kasten 的工程师们在其 Kubernetes 系统中添加 OpenTracing 和 Jaeger 的过程中经历的投机活动和留下的遗憾。在本次演讲结束时,听众将会知道将OpenTracing添加到Go项目会有什么结果,了解与追踪相关的一些问题,并了解仅追踪服务网格和使用跟踪库之间的一些差异。
展开查看详情
1 .Navigating the Distributed Systems Execution Maze with OpenTracing Ashlie Martinez Ilya Kislenko (on behalf of Julio López)
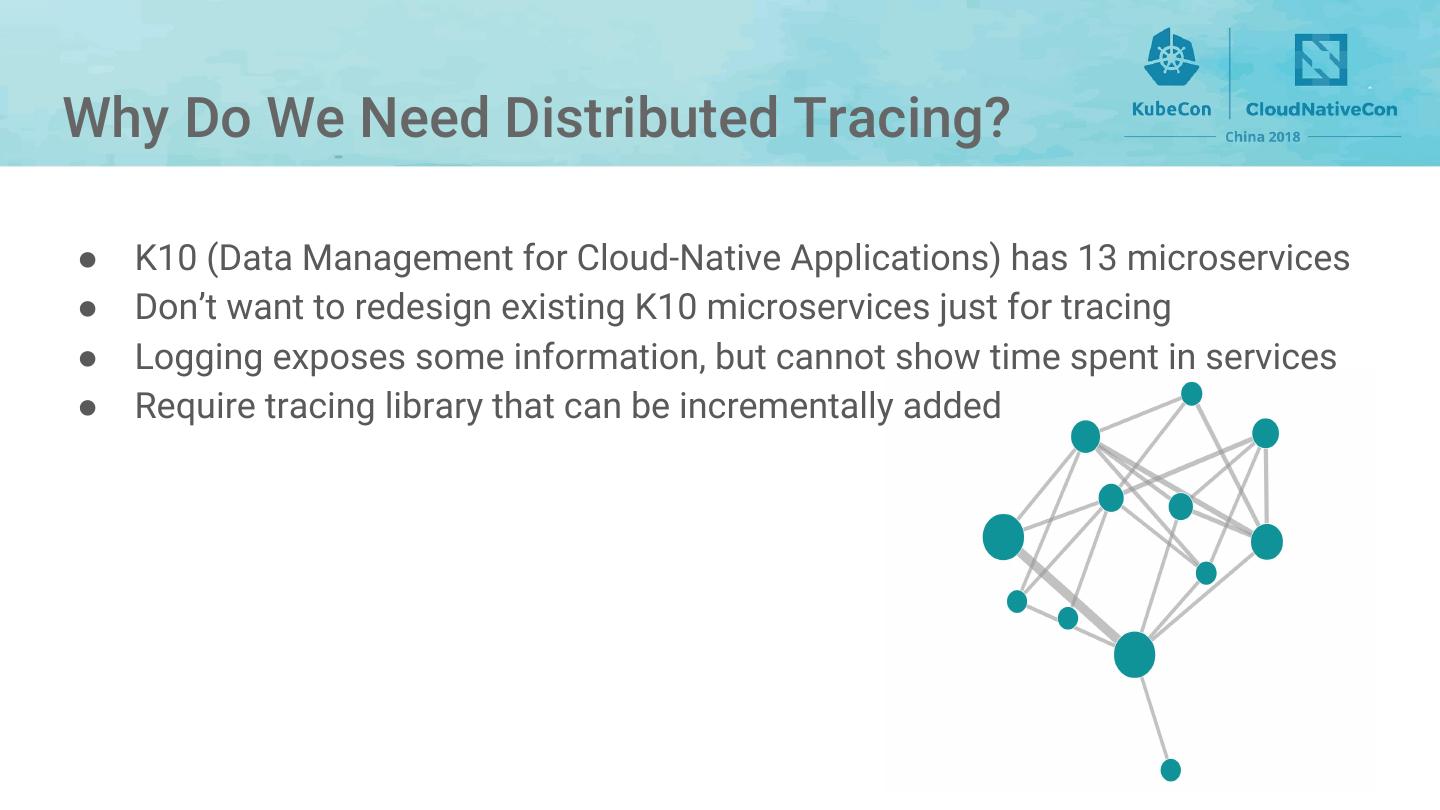
2 .Why Do We Need Distributed Tracing? ● K10 (Data Management for Cloud-Native Applications) has 13 microservices ● Don’t want to redesign existing K10 microservices just for tracing ● Logging exposes some information, but cannot show time spent in services ● Require tracing library that can be incrementally added
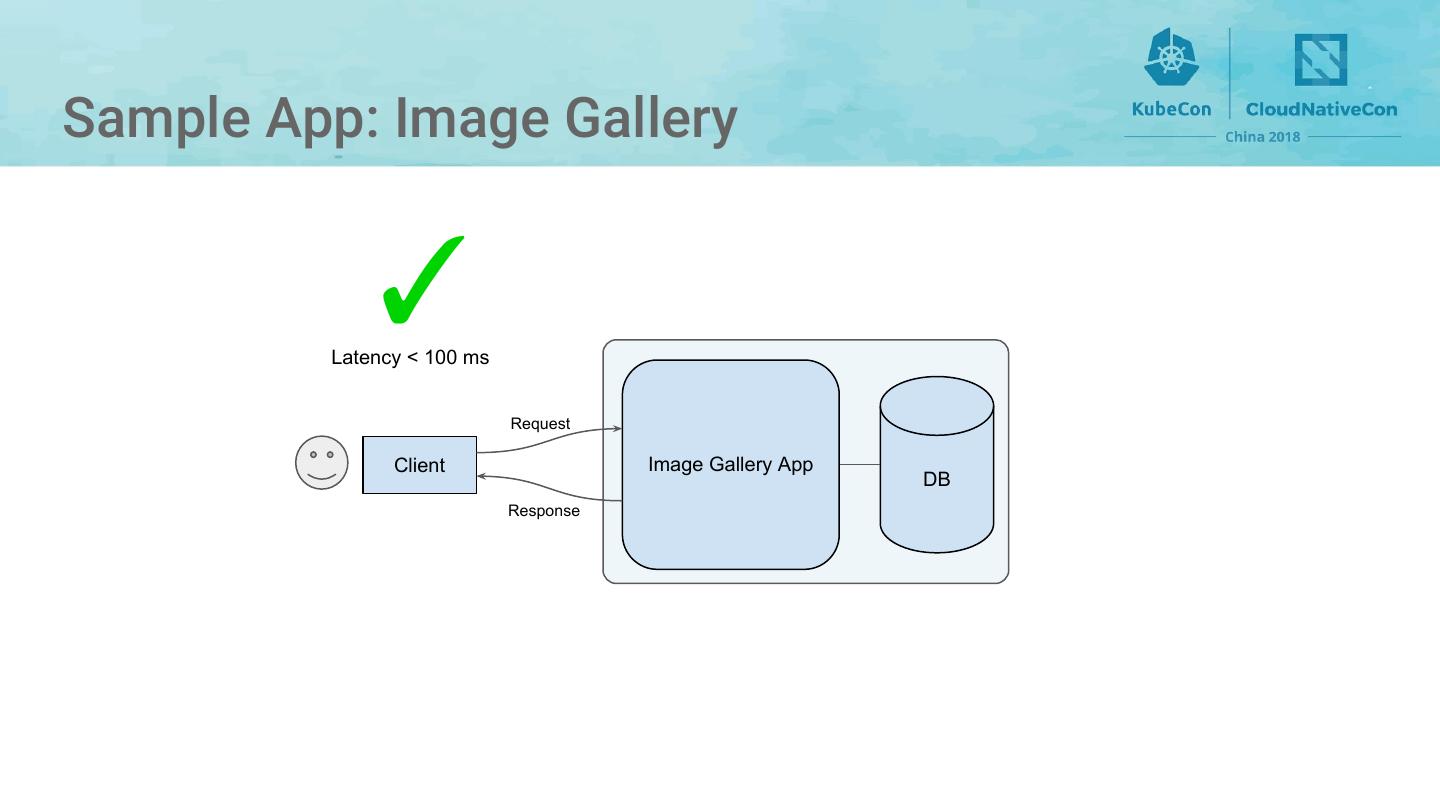
3 .Sample App: Image Gallery ✓ Latency < 100 ms Request Client Image Gallery App DB Response
4 .Sample App: Image Gallery ❌ Latency > 10 s Request Client Image Gallery App DB Response
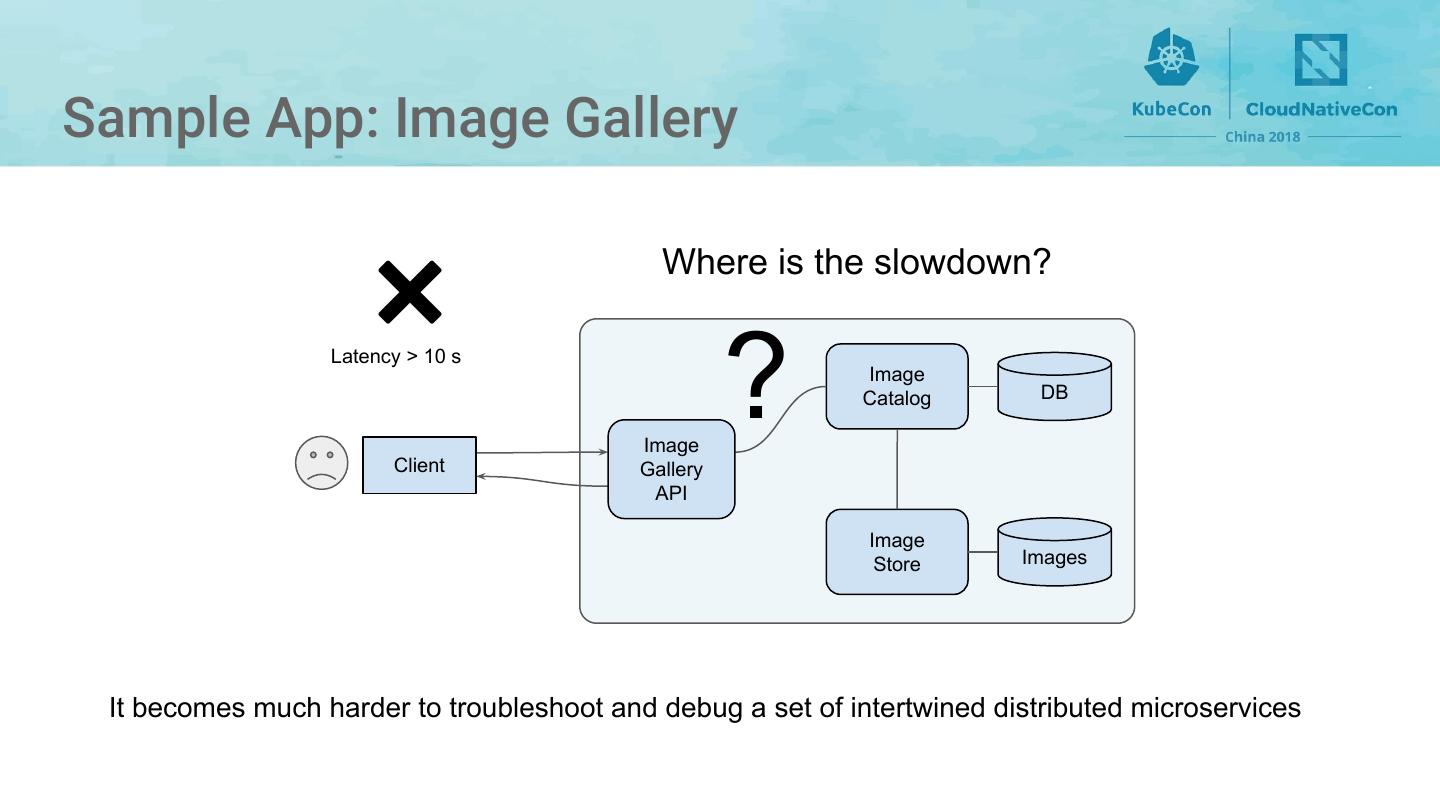
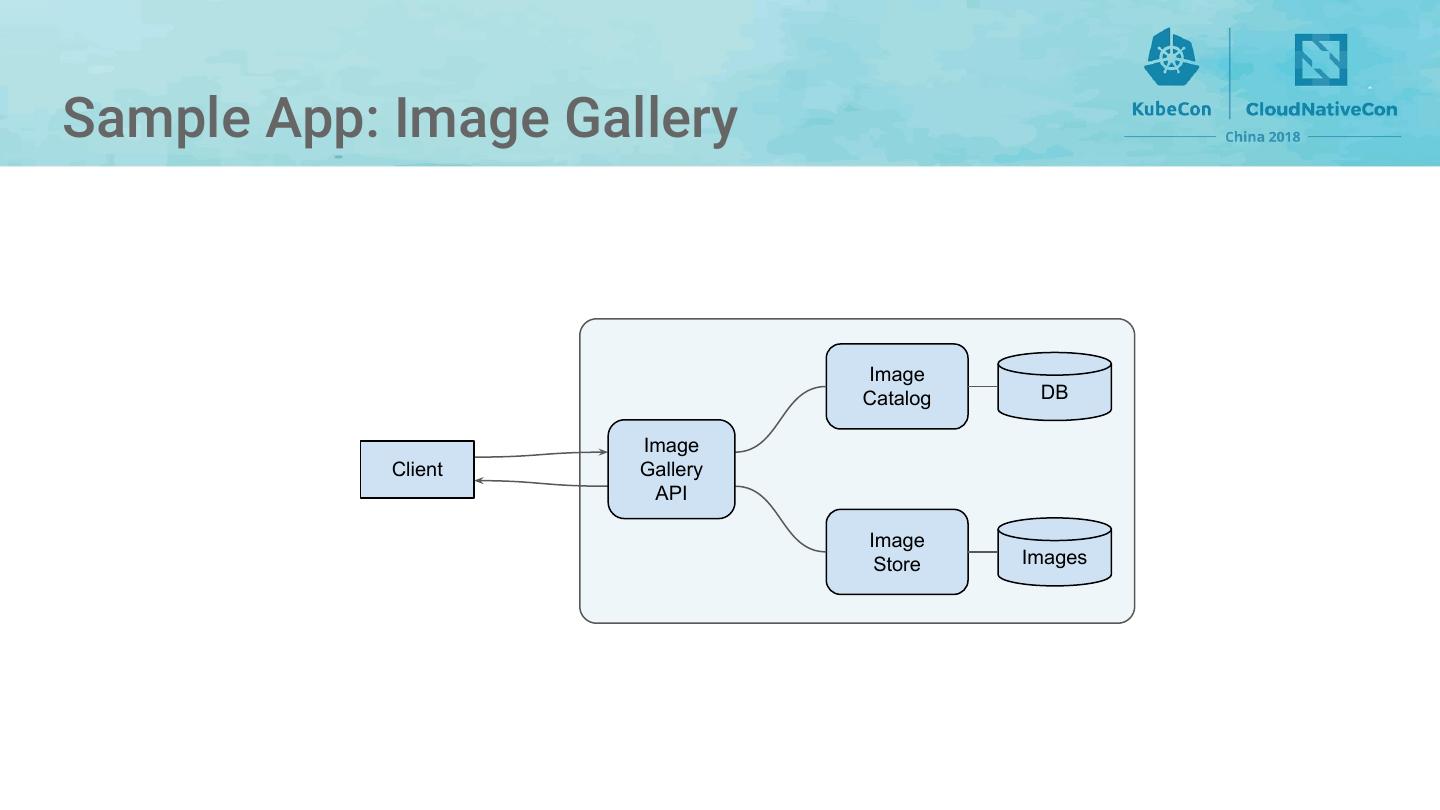
5 .Sample App: Image Gallery ❌ Where is the slowdown? Latency > 10 s Client Image Gallery ? Image Catalog DB API Image Store Images It becomes much harder to troubleshoot and debug a set of intertwined distributed microservices
6 .Distributed Tracing Image DB ● Automatically aggregate traces for a Catalog request from multiple microservices Request Image Gallery ● Highlights the execution path of client API requests in the backend Image ● Can help pinpoint where failures occur and Store Images what causes poor performance ● Most libraries support probabilistic sampling of requests Traces ● Complements distributed log and metrics collection tools Tracing UI Developer
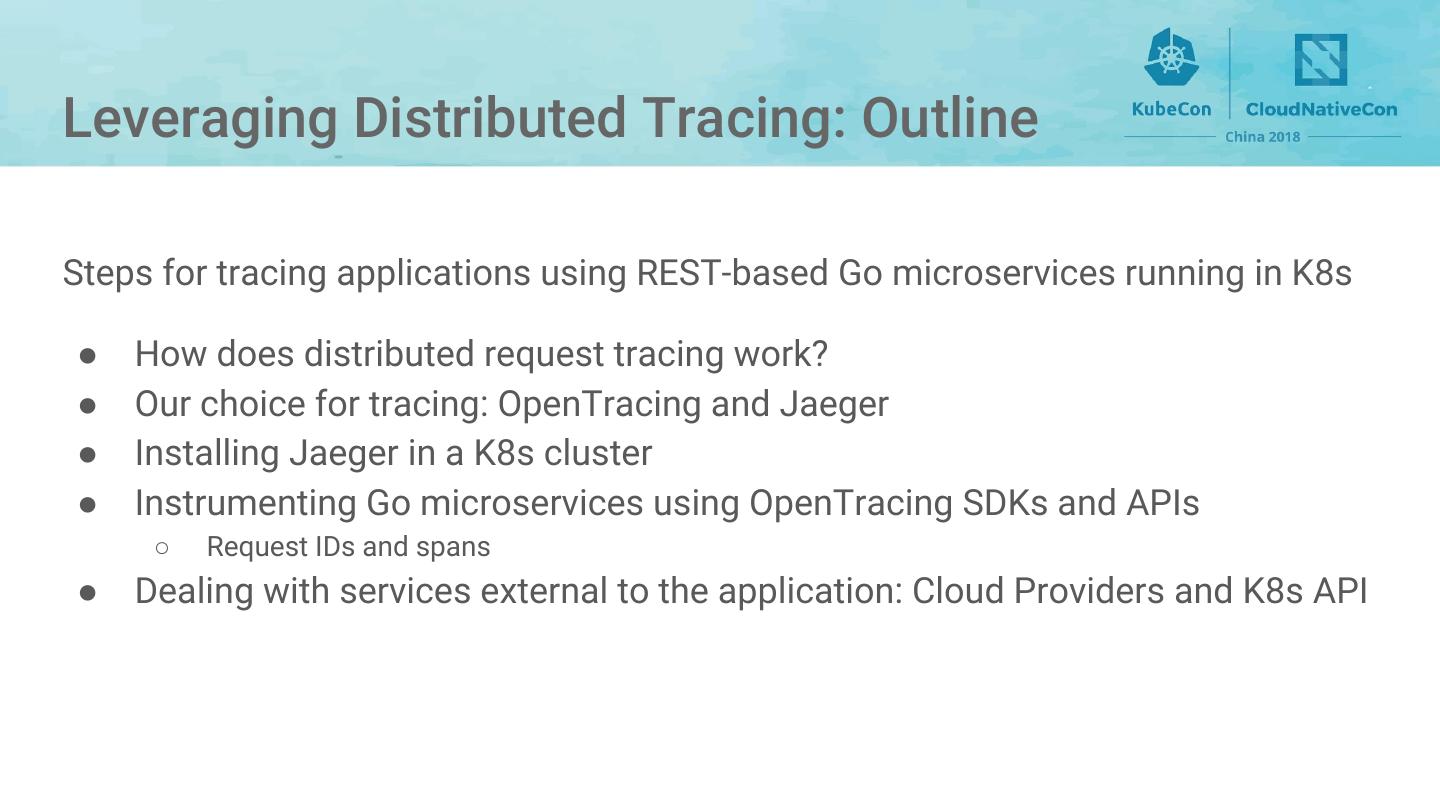
7 .Leveraging Distributed Tracing: Outline Steps for tracing applications using REST-based Go microservices running in K8s ● How does distributed request tracing work? ● Our choice for tracing: OpenTracing and Jaeger ● Installing Jaeger in a K8s cluster ● Instrumenting Go microservices using OpenTracing SDKs and APIs ○ Request IDs and spans ● Dealing with services external to the application: Cloud Providers and K8s API
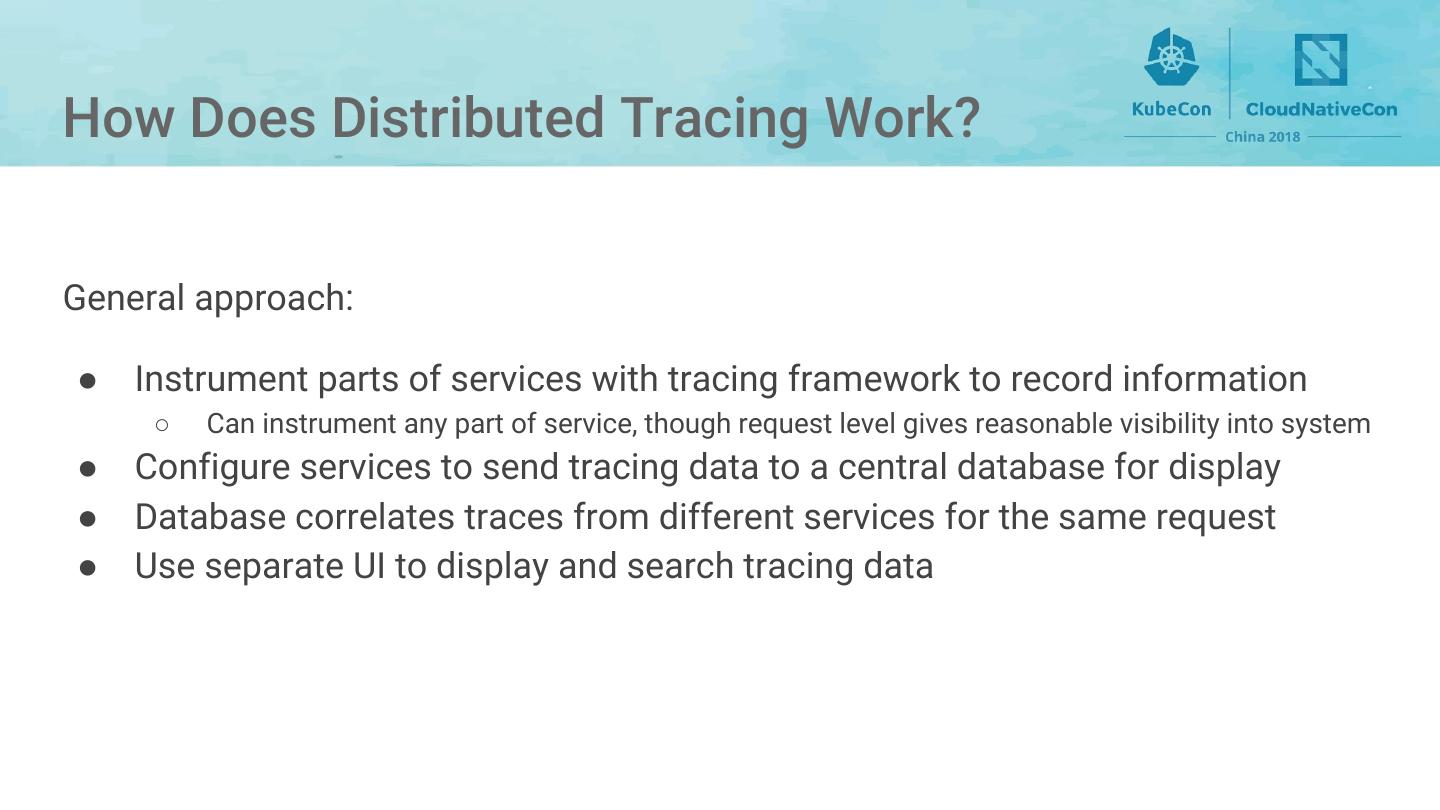
8 .How Does Distributed Tracing Work? General approach: ● Instrument parts of services with tracing framework to record information ○ Can instrument any part of service, though request level gives reasonable visibility into system ● Configure services to send tracing data to a central database for display ● Database correlates traces from different services for the same request ● Use separate UI to display and search tracing data
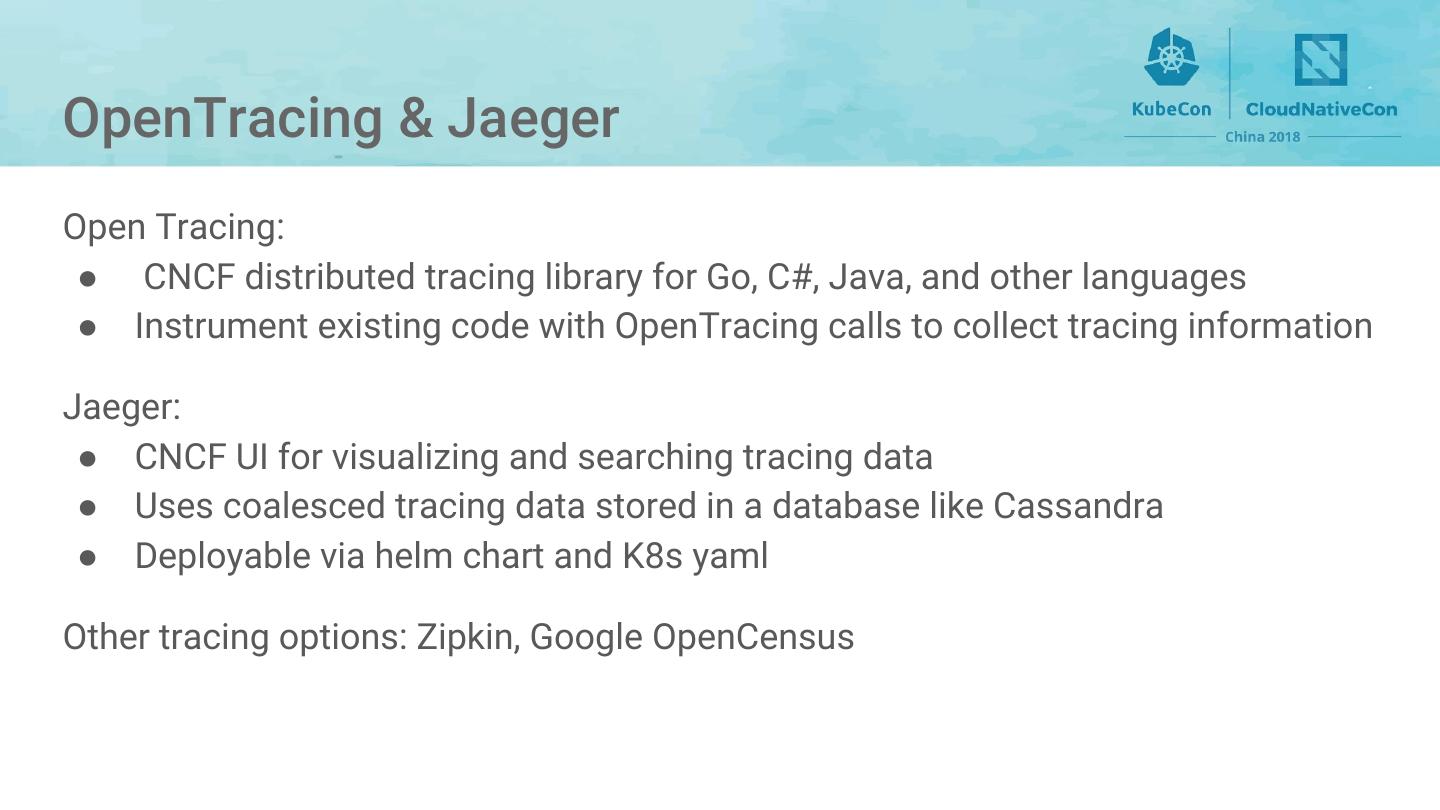
9 .OpenTracing & Jaeger Open Tracing: ● CNCF distributed tracing library for Go, C#, Java, and other languages ● Instrument existing code with OpenTracing calls to collect tracing information Jaeger: ● CNCF UI for visualizing and searching tracing data ● Uses coalesced tracing data stored in a database like Cassandra ● Deployable via helm chart and K8s yaml Other tracing options: Zipkin, Google OpenCensus
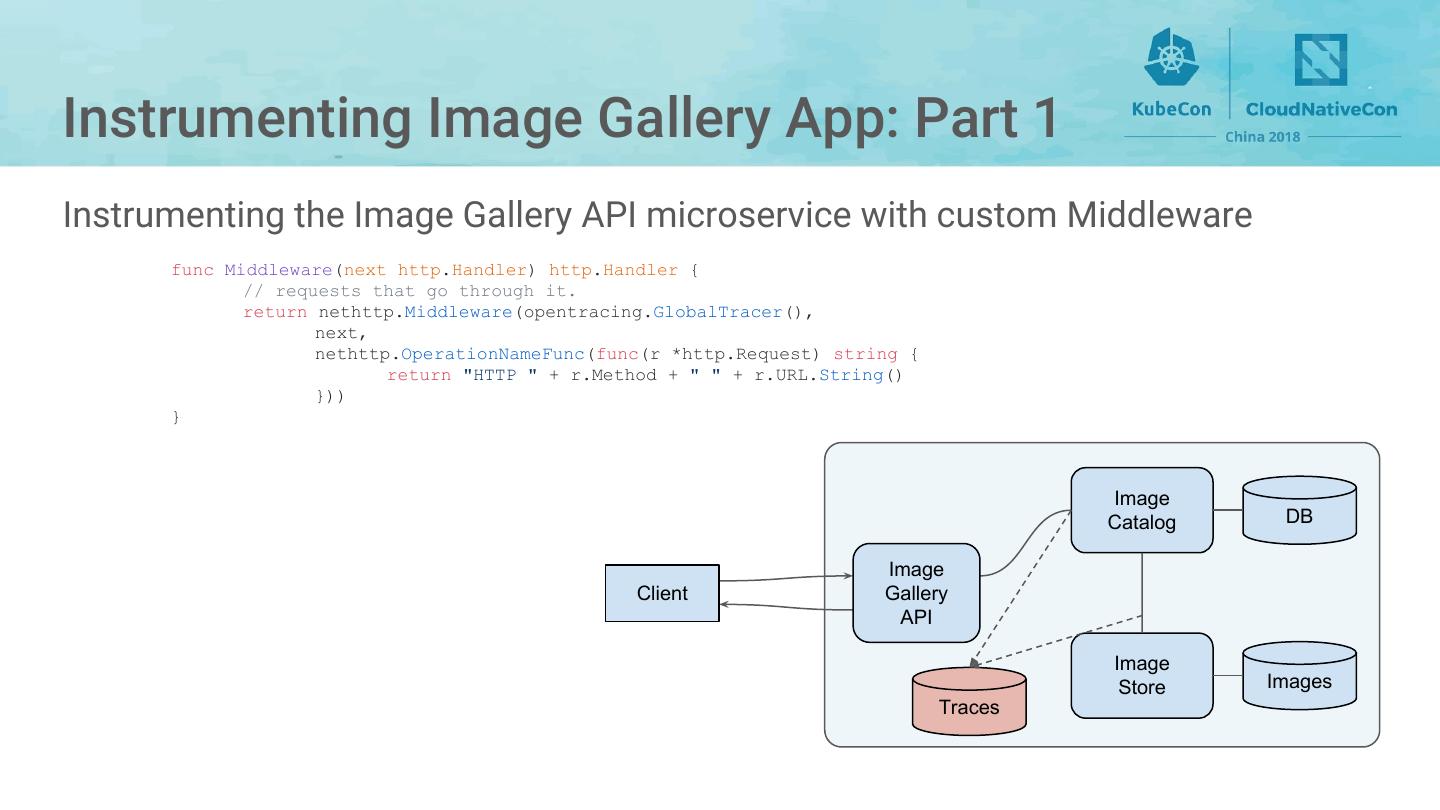
10 .Instrumenting Image Gallery App: Part 1 Instrumenting the Image Gallery API microservice with custom Middleware func Middleware(next http.Handler) http.Handler { // requests that go through it. return nethttp.Middleware(opentracing.GlobalTracer(), next, nethttp.OperationNameFunc(func(r *http.Request) string { return "HTTP " + r.Method + " " + r.URL.String() })) } Image Catalog DB Image Client Gallery API Image Store Images Traces
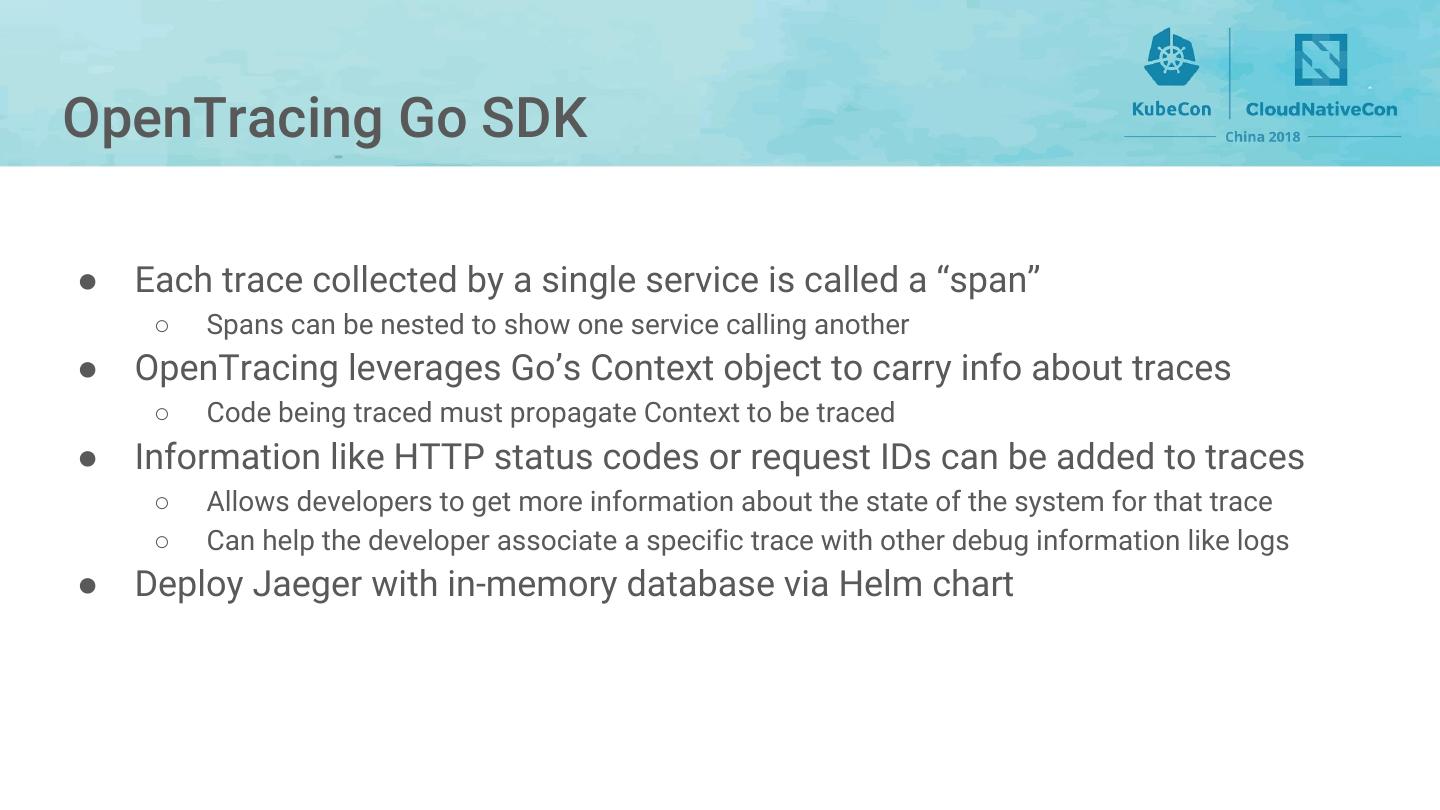
11 .OpenTracing Go SDK ● Each trace collected by a single service is called a “span” ○ Spans can be nested to show one service calling another ● OpenTracing leverages Go’s Context object to carry info about traces ○ Code being traced must propagate Context to be traced ● Information like HTTP status codes or request IDs can be added to traces ○ Allows developers to get more information about the state of the system for that trace ○ Can help the developer associate a specific trace with other debug information like logs ● Deploy Jaeger with in-memory database via Helm chart
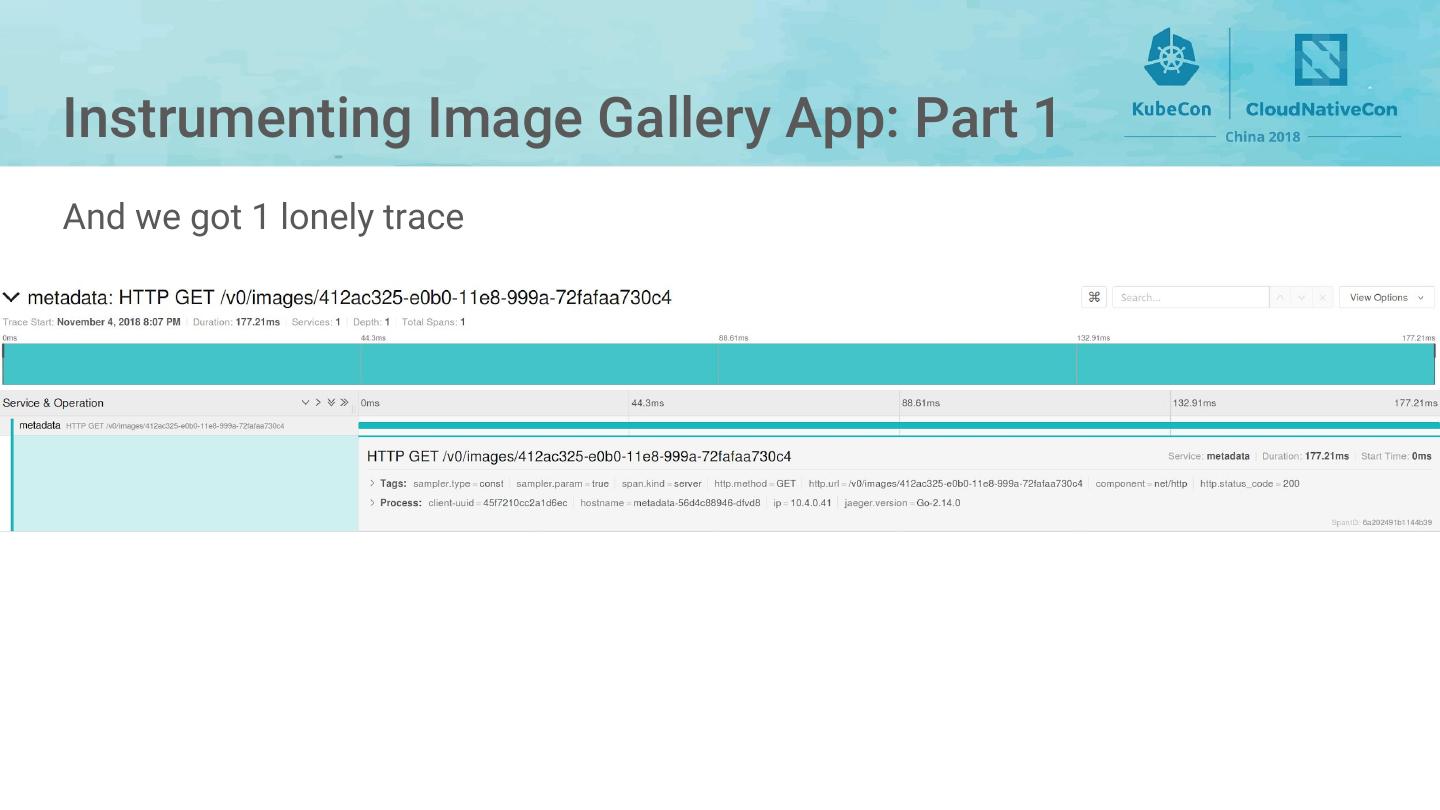
12 .Instrumenting Image Gallery App: Part 1 And we got 1 lonely trace
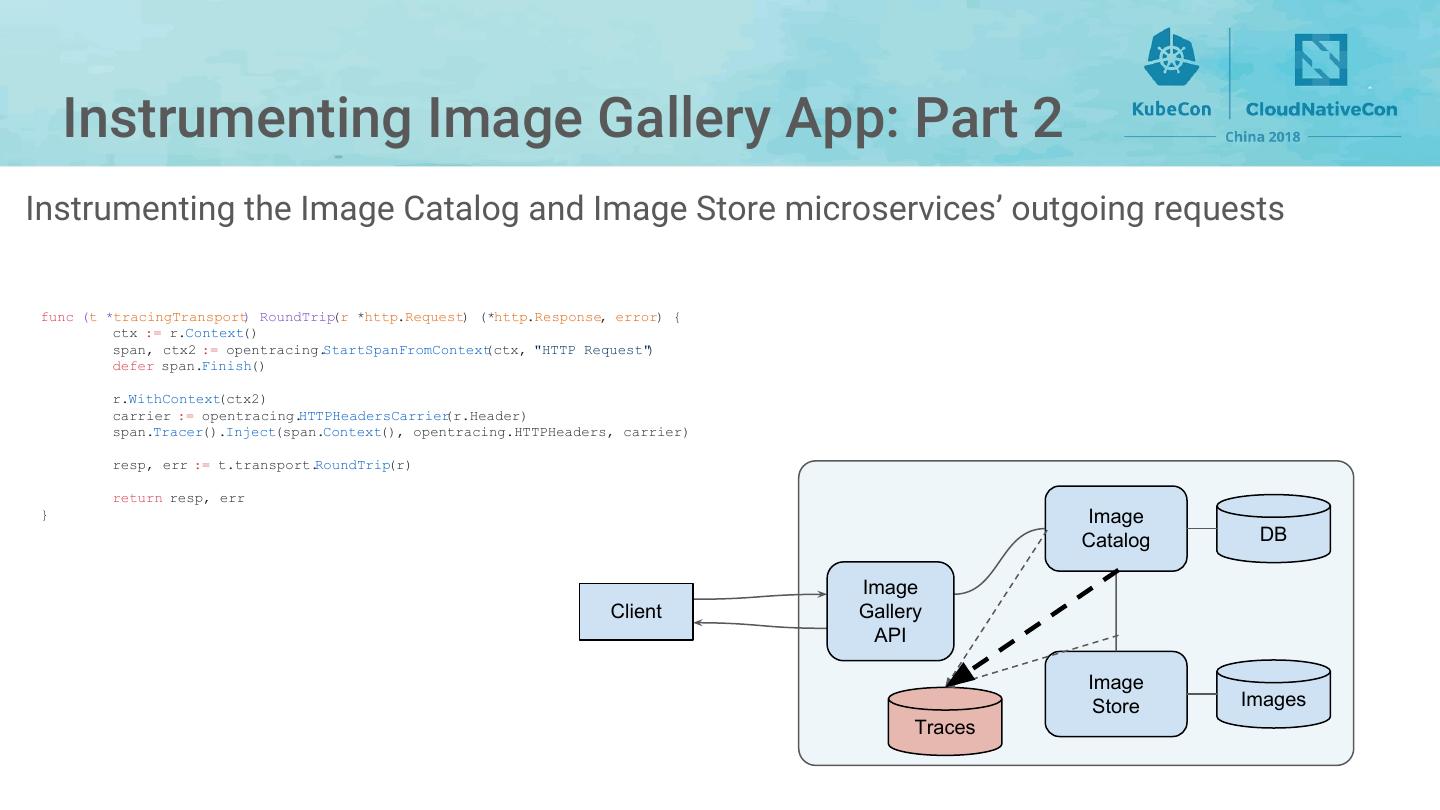
13 . Instrumenting Image Gallery App: Part 2 Instrumenting the Image Catalog and Image Store microservices’ outgoing requests func (t *tracingTransport) RoundTrip(r *http.Request) (*http.Response, error) { ctx := r.Context() span, ctx2 := opentracing.StartSpanFromContext(ctx, "HTTP Request") defer span.Finish() r.WithContext(ctx2) carrier := opentracing.HTTPHeadersCarrier(r.Header) span.Tracer().Inject(span.Context(), opentracing.HTTPHeaders, carrier) resp, err := t.transport.RoundTrip(r) return resp, err } Image Catalog DB Image Client Gallery API Image Store Images Traces
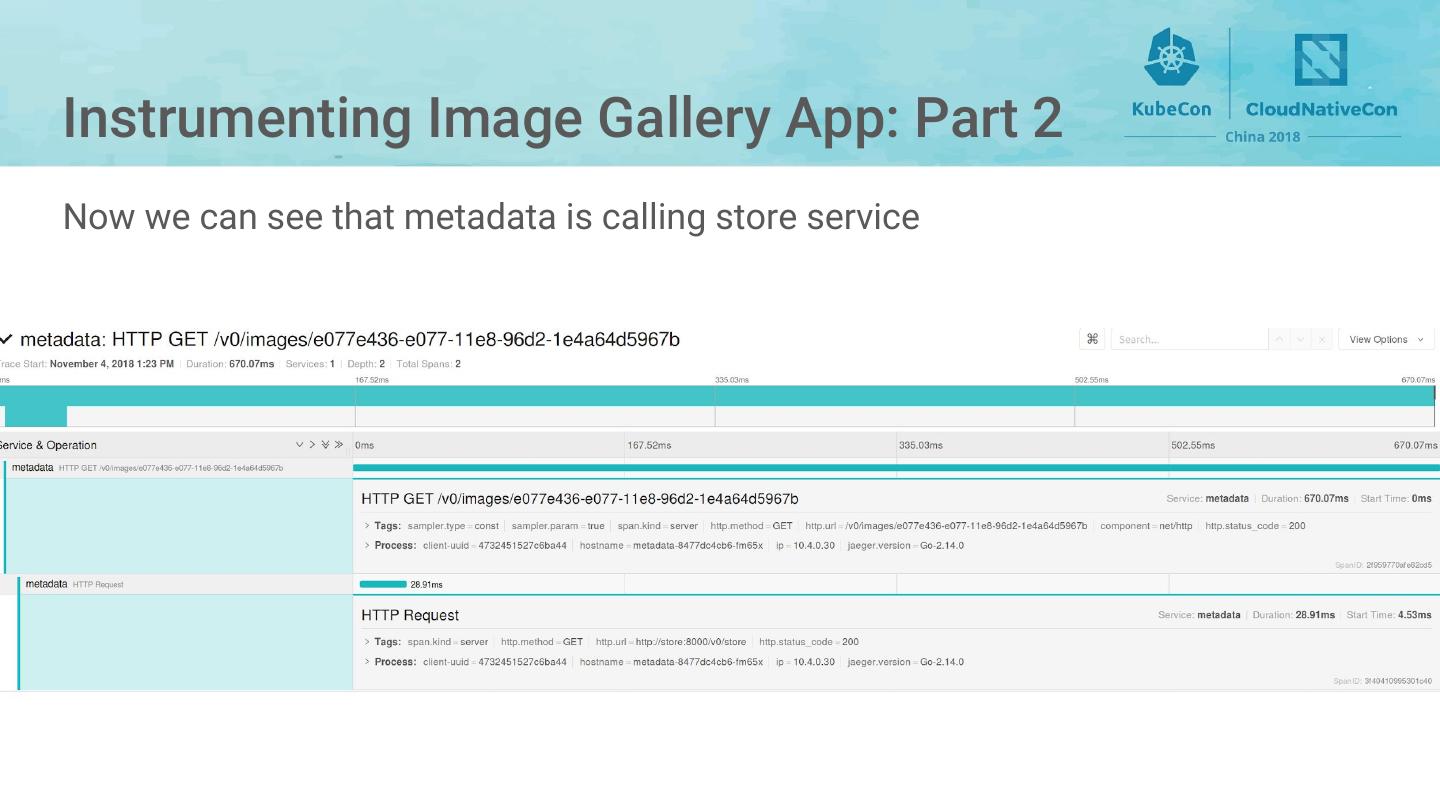
14 .Instrumenting Image Gallery App: Part 2 Now we can see that metadata is calling store service
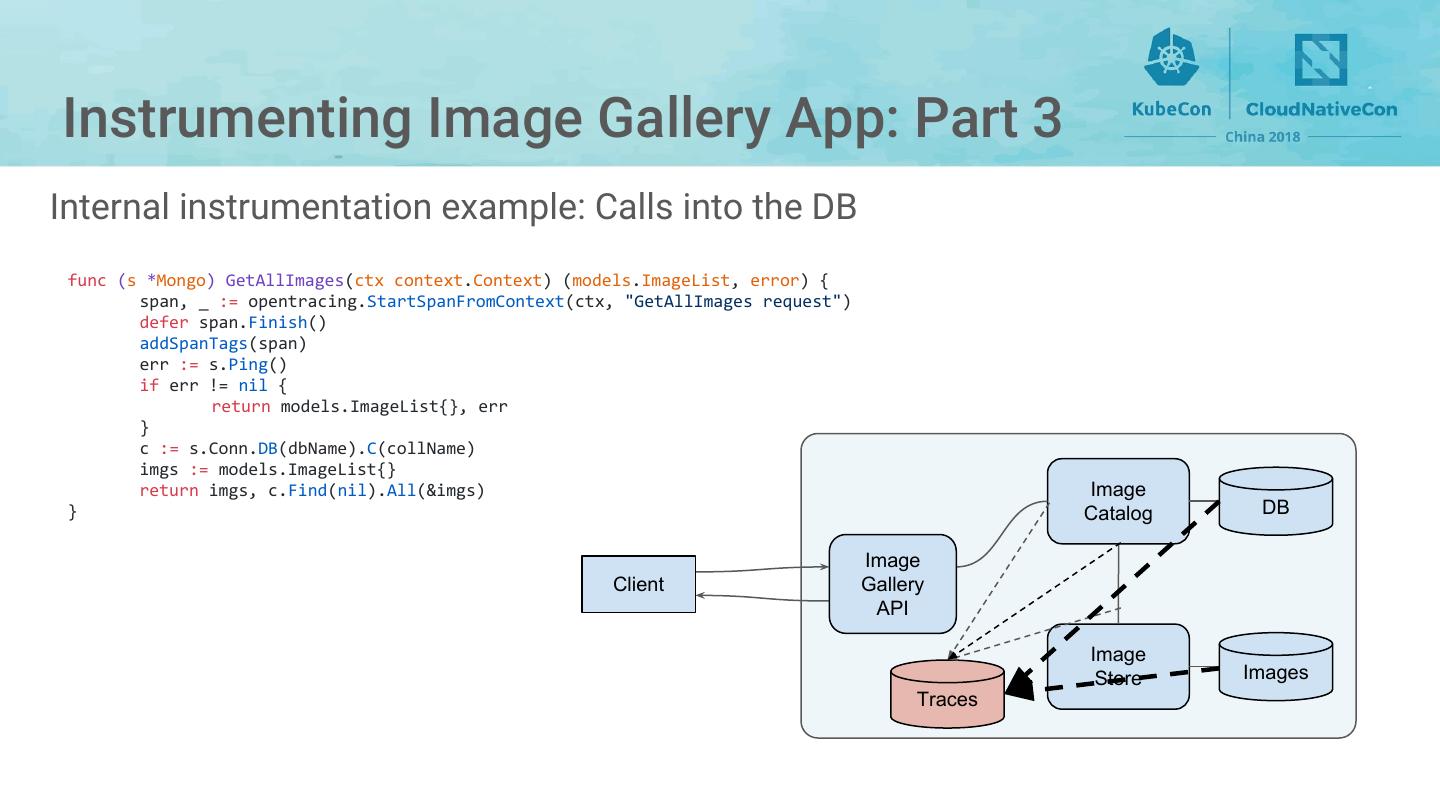
15 .Instrumenting Image Gallery App: Part 3 Internal instrumentation example: Calls into the DB func (s *Mongo) GetAllImages(ctx context.Context) (models.ImageList, error) { span, _ := opentracing.StartSpanFromContext(ctx, "GetAllImages request") defer span.Finish() addSpanTags(span) err := s.Ping() if err != nil { return models.ImageList{}, err } c := s.Conn.DB(dbName).C(collName) imgs := models.ImageList{} return imgs, c.Find(nil).All(&imgs) Image } Catalog DB Image Client Gallery API Image Store Images Traces
16 .Instrumenting Image Gallery App: Part 3 Here we can see everything.
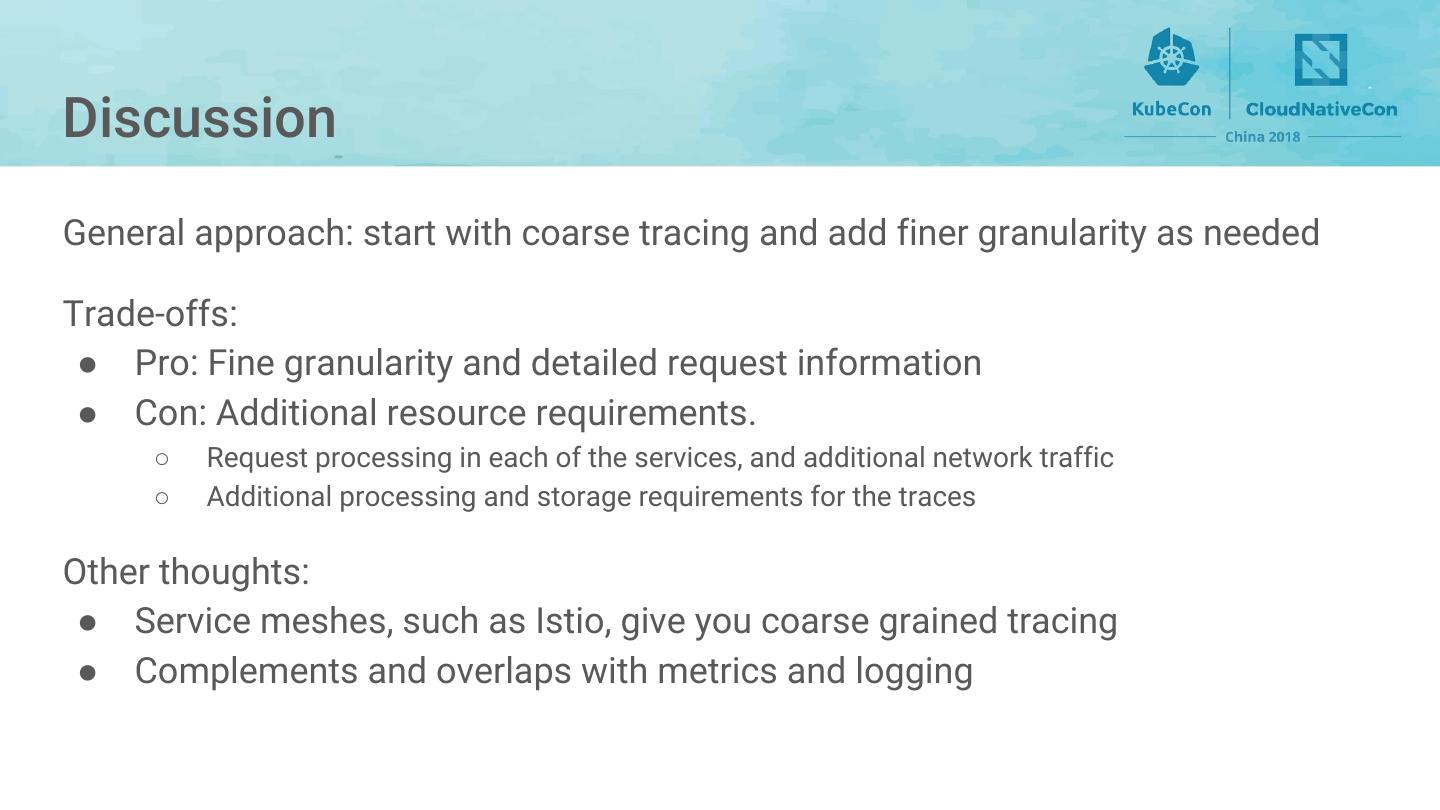
17 .Discussion General approach: start with coarse tracing and add finer granularity as needed Trade-offs: ● Pro: Fine granularity and detailed request information ● Con: Additional resource requirements. ○ Request processing in each of the services, and additional network traffic ○ Additional processing and storage requirements for the traces Other thoughts: ● Service meshes, such as Istio, give you coarse grained tracing ● Complements and overlaps with metrics and logging
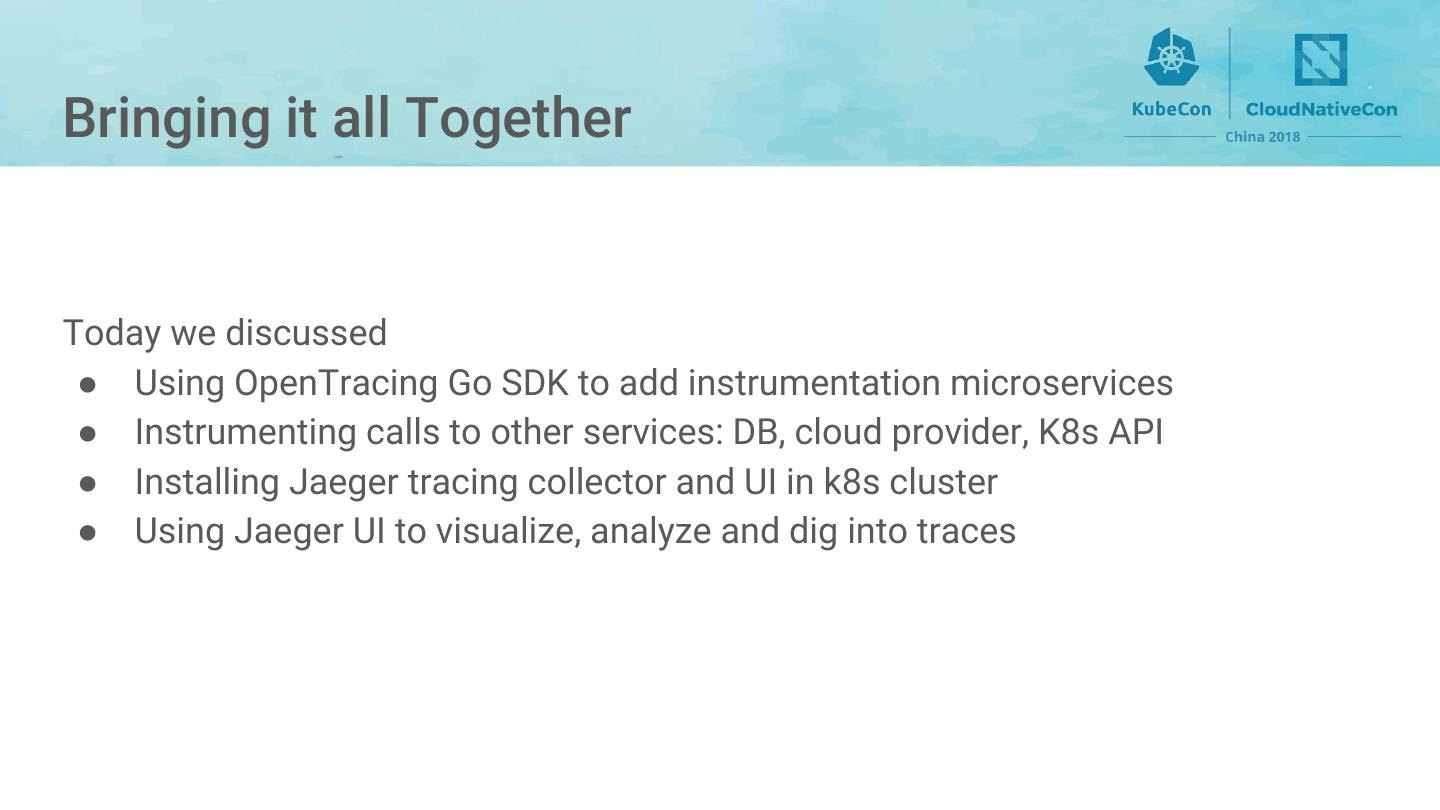
18 .Bringing it all Together Today we discussed ● Using OpenTracing Go SDK to add instrumentation microservices ● Instrumenting calls to other services: DB, cloud provider, K8s API ● Installing Jaeger tracing collector and UI in k8s cluster ● Using Jaeger UI to visualize, analyze and dig into traces
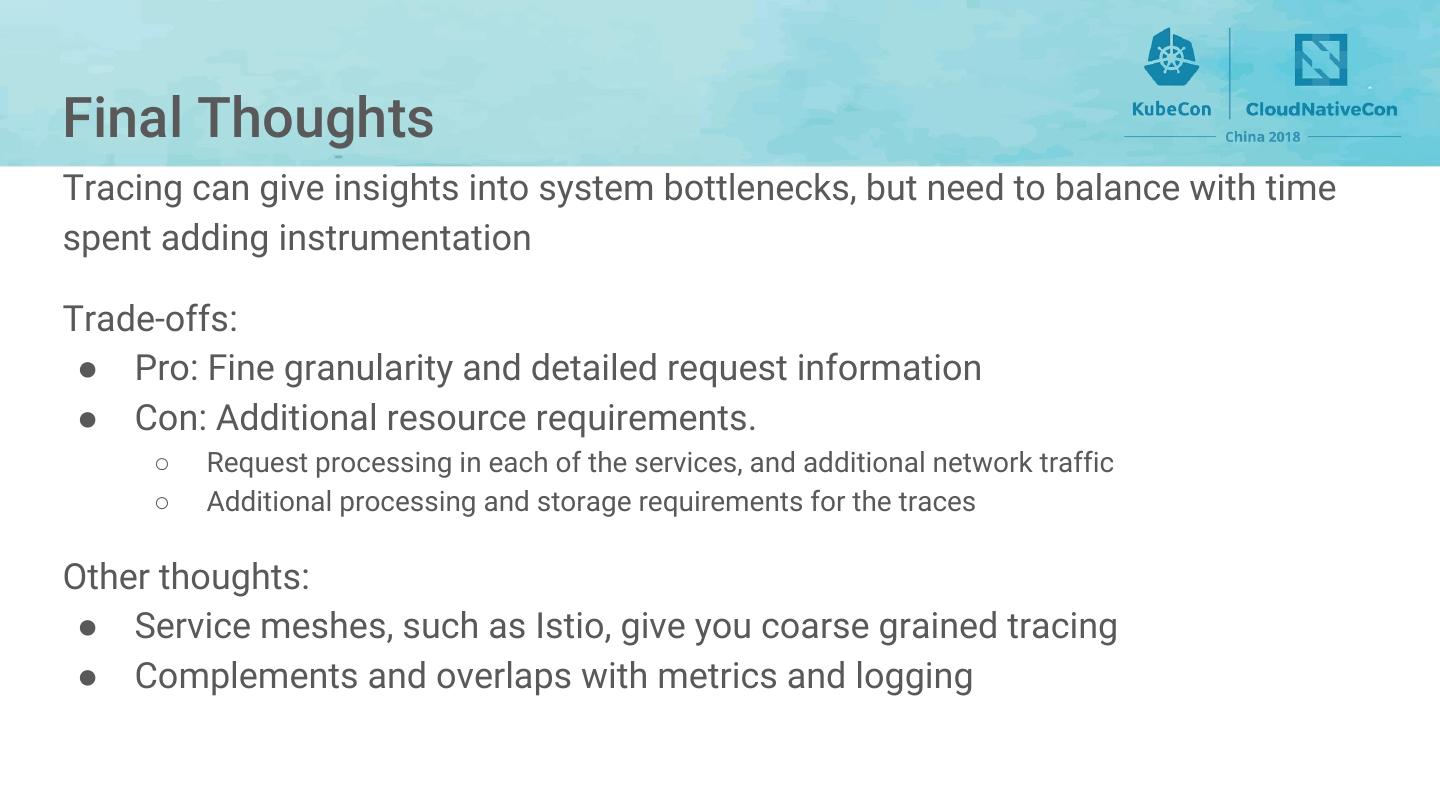
19 .Final Thoughts Tracing can give insights into system bottlenecks, but need to balance with time spent adding instrumentation Trade-offs: ● Pro: Fine granularity and detailed request information ● Con: Additional resource requirements. ○ Request processing in each of the services, and additional network traffic ○ Additional processing and storage requirements for the traces Other thoughts: ● Service meshes, such as Istio, give you coarse grained tracing ● Complements and overlaps with metrics and logging
20 .Questions?
21 .Sample App: Image Gallery Image Catalog DB Image Client Gallery API Image Store Images
22 .Sample App: Image Gallery ❌ ? Latency > 10 s Image Catalog DB Image Client Gallery API Image Store Images Where is the slowdown?
3秒后跳转登录页面
去登陆

