- 快召唤伙伴们来围观吧
- 微博 QQ QQ空间 贴吧
- 文档嵌入链接
- 复制
- 微信扫一扫分享
- 已成功复制到剪贴板
04_Feature representation
展开查看详情
1 .Ch. 4: Feature representation Using Vector Quantization (VQ) and K-means Feature representation using VQ and Kmeans. v.8a 1
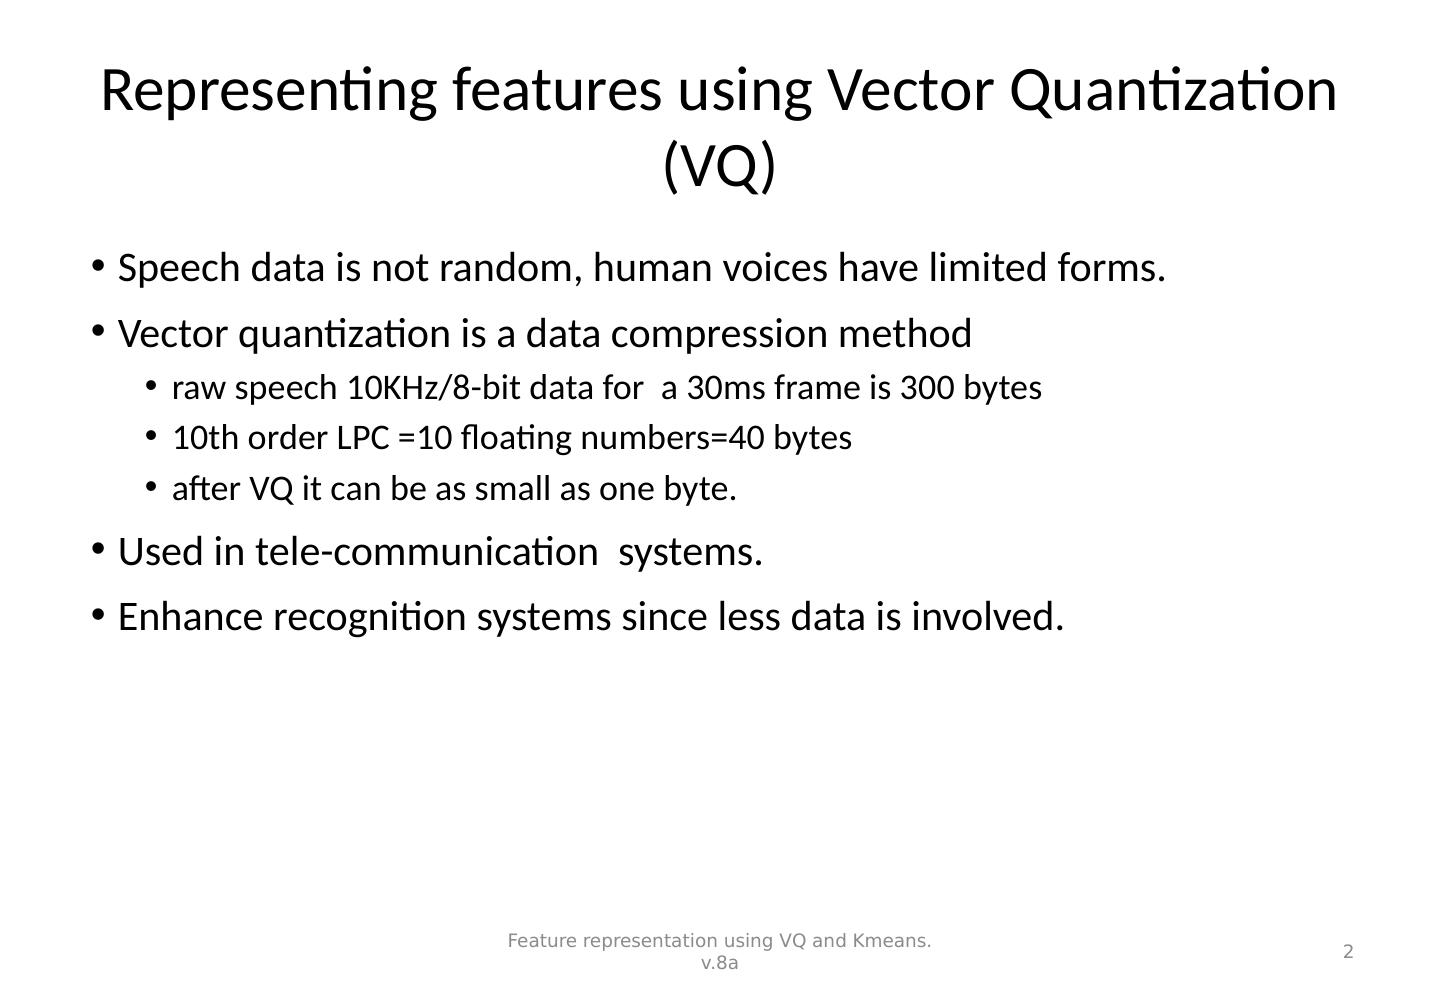
2 .Representing features using Vector Quantization (VQ) Speech data is not random, human voices have limited forms. Vector quantization is a data compression method raw speech 10KHz/8-bit data for a 30ms frame is 300 bytes 10th order LPC =10 floating numbers=40 bytes after VQ it can be as small as one byte. Used in tele-communication systems. Enhance recognition systems since less data is involved. Feature representation using VQ and Kmeans. v.8a 2
3 .Use of Vector quantization for Further compression If the order of LPC is 10, it is a data in a 10 dimensional space after VQ it can be as small as one byte. Example, the order of LPC is 2 (2 D space, it is simplified for illustrating the idea) Feature representation using VQ and Kmeans. v.8a 3 e: i: u: LPC coefficient a1 LPC coefficient a2 e.g. same voices (i:) spoken by the same person at different times
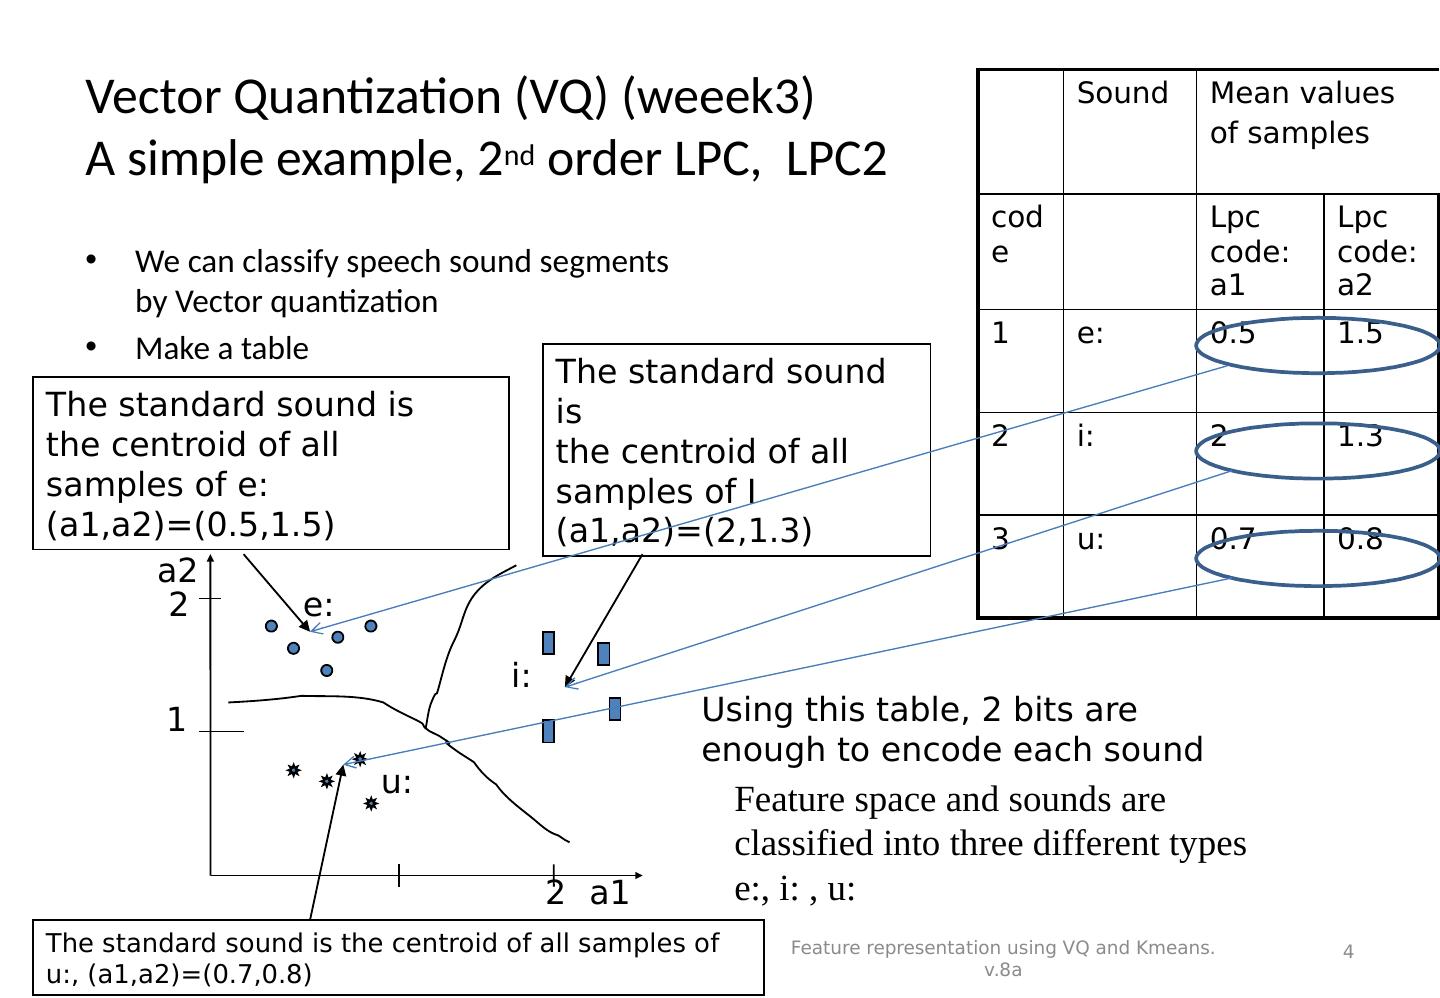
4 .Vector Quantization (VQ) (weeek3) A simple example, 2 nd order LPC, LPC2 We can classify speech sound segments by Vector quantization Make a table Sound Mean values of samples code Lpc code: a1 Lpc code:a2 1 e: 0.5 1.5 2 i: 2 1.3 3 u: 0.7 0.8 Feature representation using VQ and Kmeans. v.8a 4 Feature space and sounds are classified into three different types e:, i: , u: e: i: u: The standard sound is the centroid of all samples of e: (a1,a2)=(0.5,1.5) The standard sound is the centroid of all samples of I (a1,a2)=(2,1.3) The standard sound is the centroid of all samples of u:, (a1,a2)=(0.7,0.8) a2 a1 1 2 2 Using this table, 2 bits are enough to encode each sound
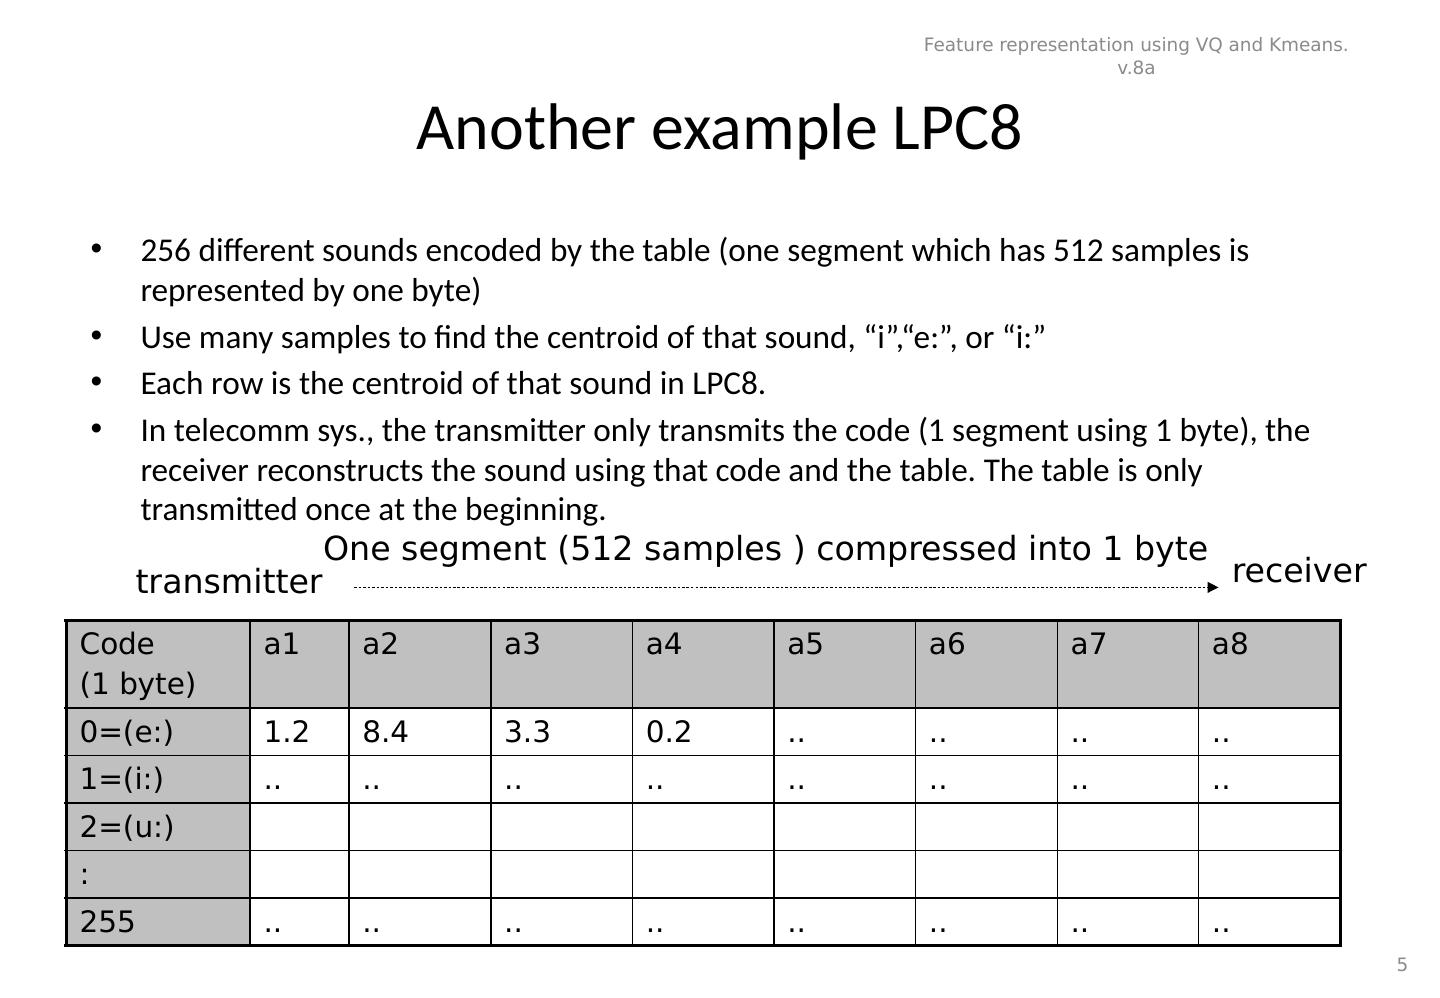
5 .Another example LPC8 256 different sounds encoded by the table (one segment which has 512 samples is represented by one byte) Use many samples to find the centroid of that sound, “i”,“e:”, or “i:” Each row is the centroid of that sound in LPC8. In telecomm sys., the transmitter only transmits the code (1 segment using 1 byte), the receiver reconstructs the sound using that code and the table. The table is only transmitted once at the beginning. Code (1 byte) a1 a2 a3 a4 a5 a6 a7 a8 0=(e:) 1.2 8.4 3.3 0.2 .. .. .. .. 1=(i:) .. .. .. .. .. .. .. .. 2=(u:) : 255 .. .. .. .. .. .. .. .. Feature representation using VQ and Kmeans. v.8a 5 transmitter receiver One segment (512 samples ) compressed into 1 byte
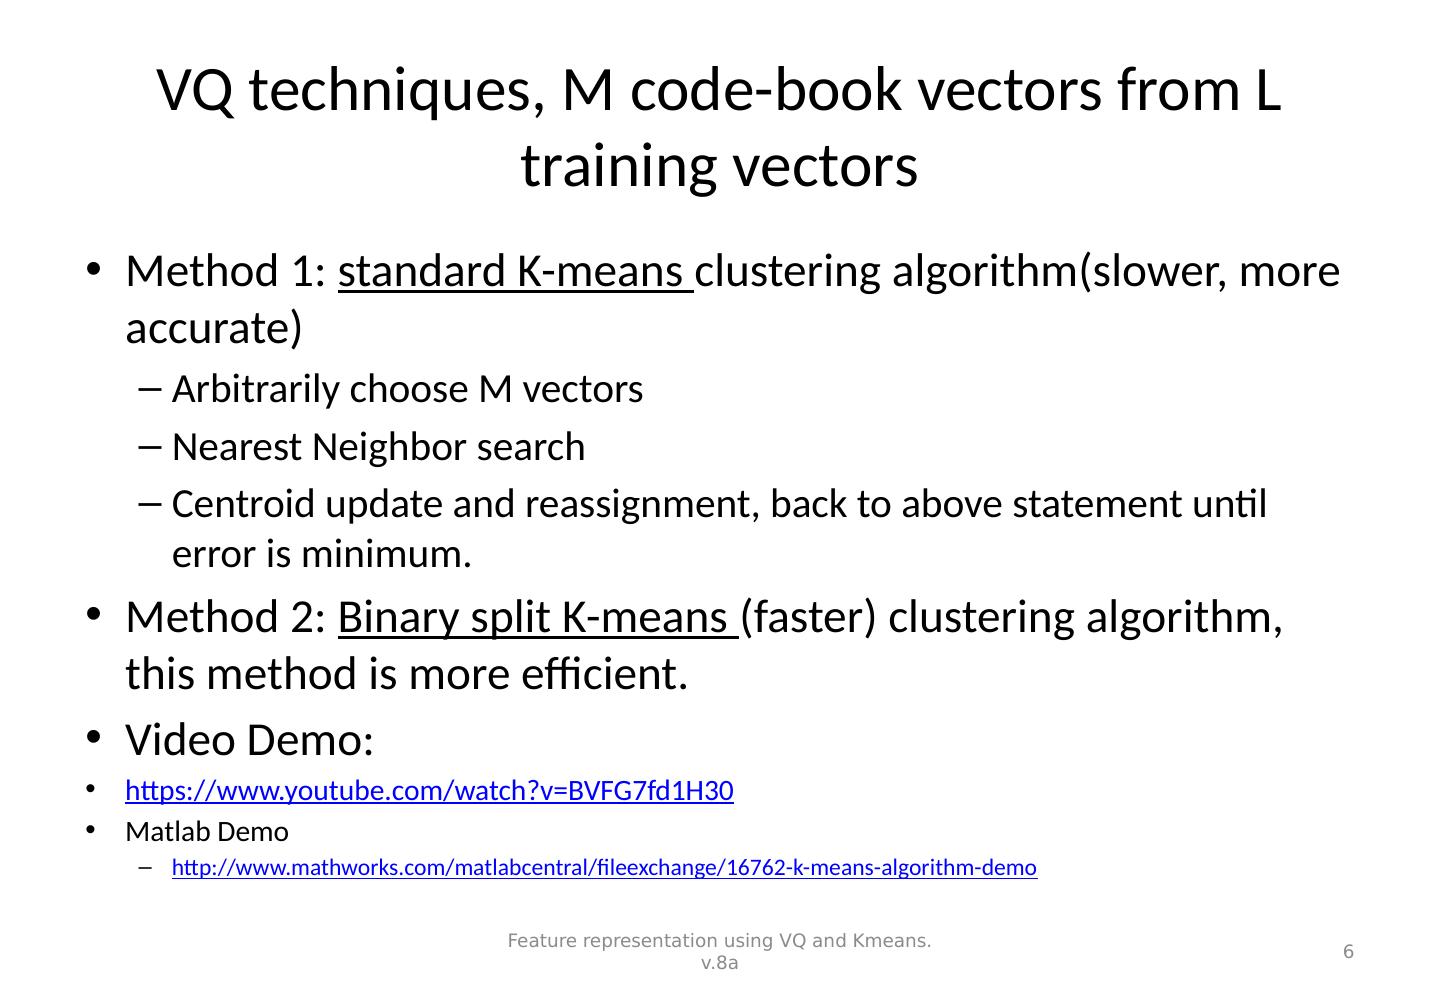
6 .VQ techniques, M code-book vectors from L training vectors Method 1: standard K-means clustering algorithm(slower, more accurate) Arbitrarily choose M vectors Nearest Neighbor search Centroid update and reassignment, back to above statement until error is minimum. Method 2: Binary split K-means (faster) clustering algorithm, this method is more efficient. Video Demo: https://www.youtube.com/watch?v=BVFG7fd1H30 Matlab Demo http:// www.mathworks.com/matlabcentral/fileexchange/16762-k-means-algorithm-demo Feature representation using VQ and Kmeans. v.8a 6
7 .Method 1: Standard K-means Example: the goal is to partition these sample data into 3 clusters (groups). Feature representation using VQ and Kmeans. v.8a 7
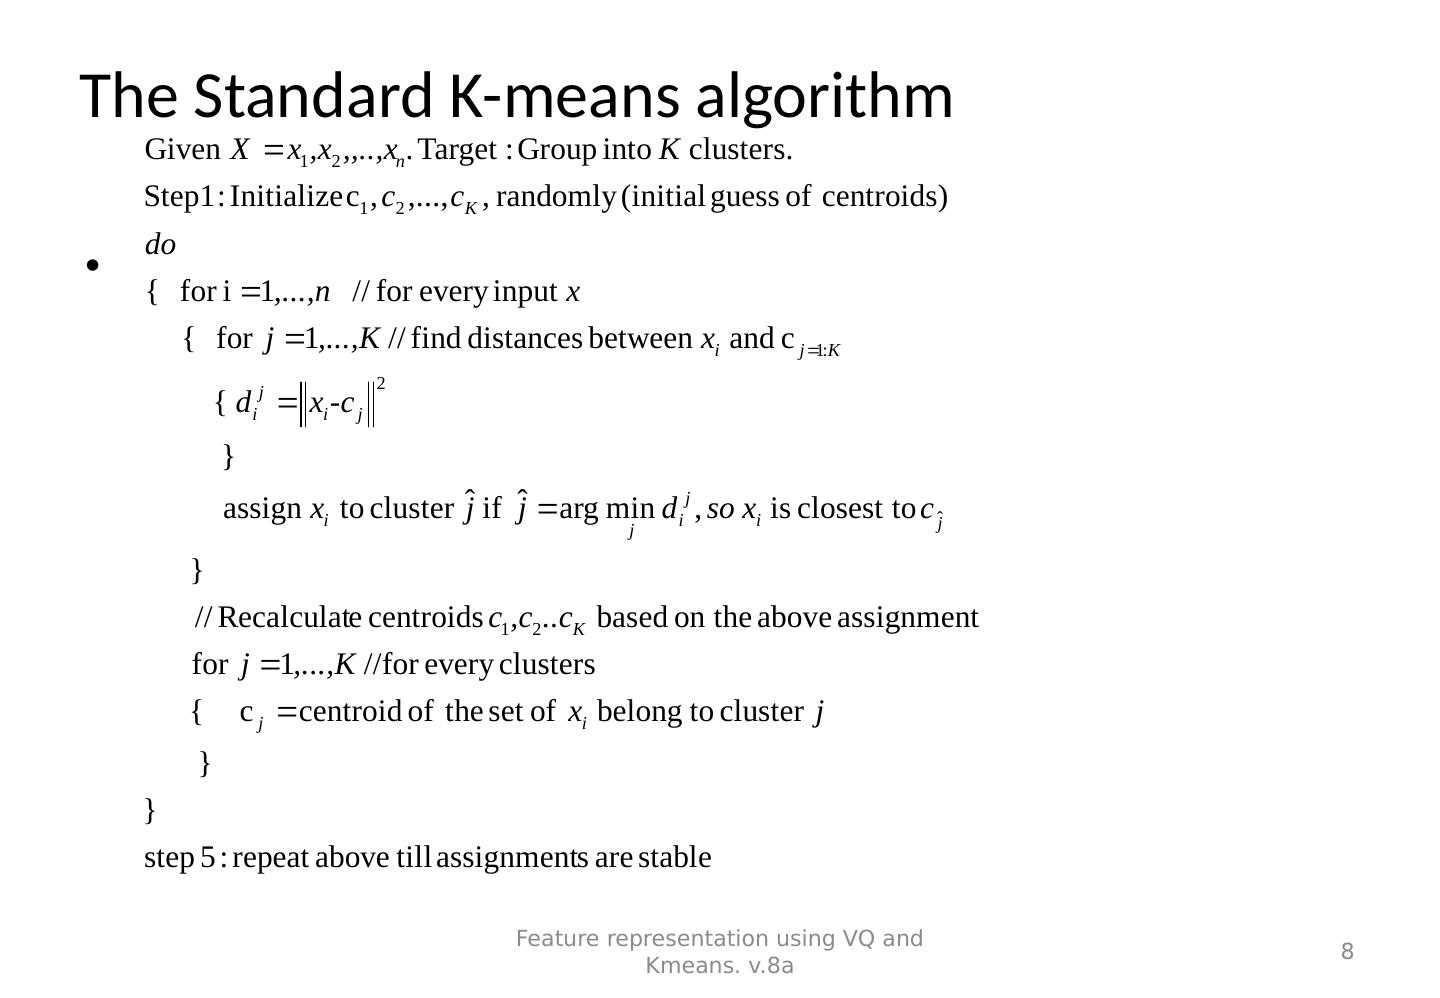
8 . Feature representation using VQ and Kmeans. v.8a 8 The Standard K-means algorithm
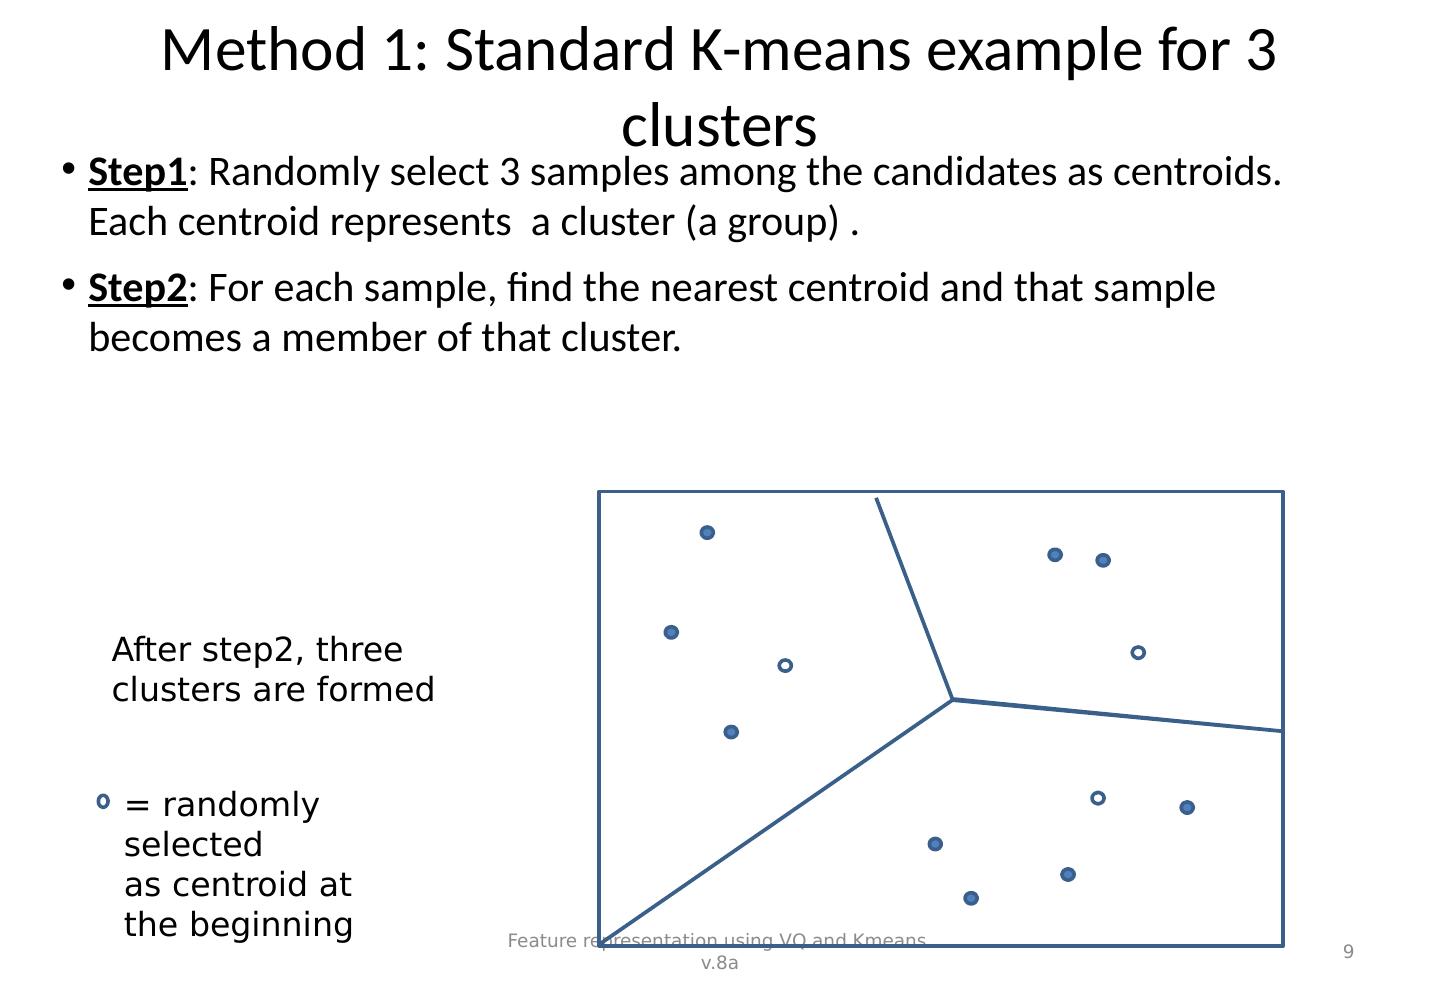
9 .Method 1: Standard K-means example for 3 clusters Step1 : Randomly select 3 samples among the candidates as centroids. Each centroid represents a cluster (a group) . Step2 : For each sample, find the nearest centroid and that sample becomes a member of that cluster. Feature representation using VQ and Kmeans. v.8a 9 After step2, three clusters are formed = randomly selected as centroid at the beginning
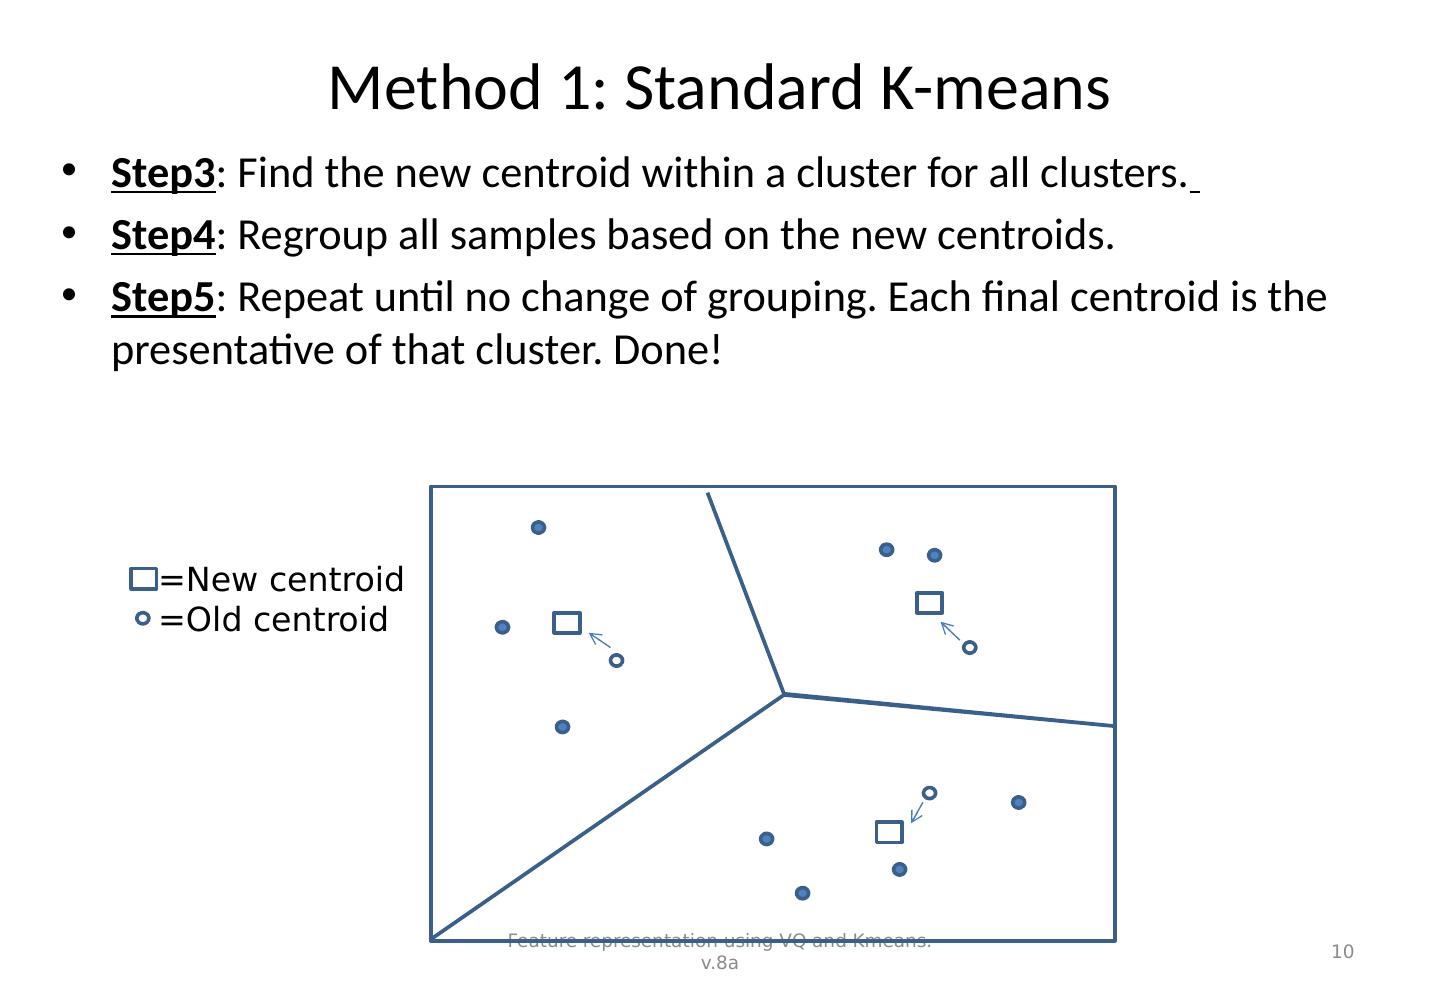
10 .Method 1: Standard K-means Step3 : Find the new centroid within a cluster for all clusters. Step4 : Regroup all samples based on the new centroids. Step5 : Repeat until no change of grouping. Each final centroid is the presentative of that cluster. Done! Feature representation using VQ and Kmeans. v.8a 10 =New centroid =Old centroid
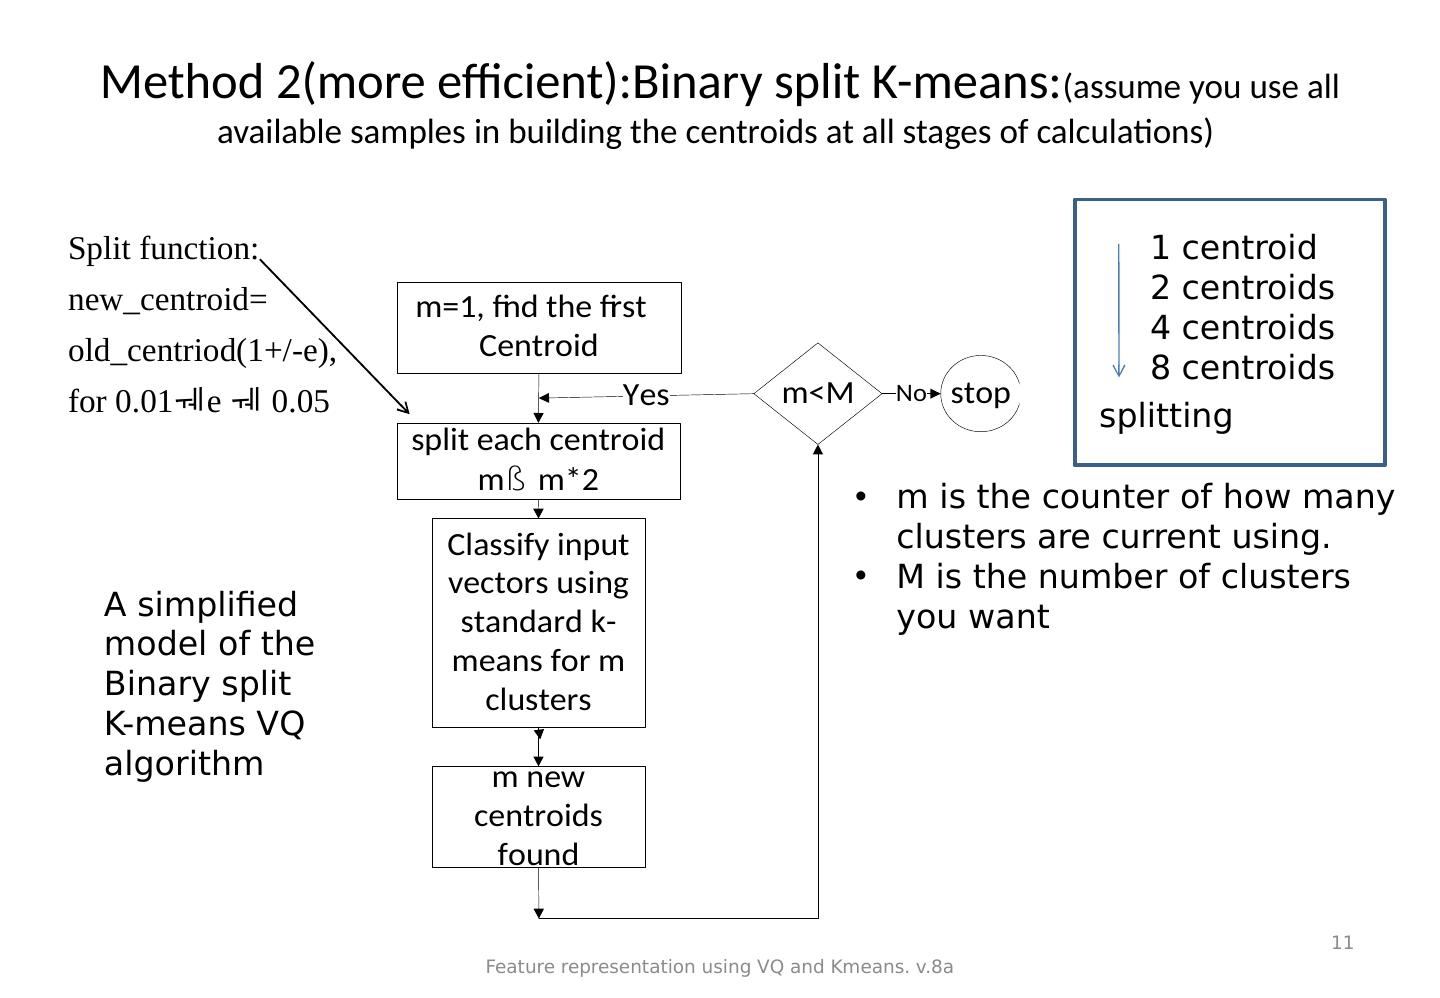
11 .Method 2(more efficient):Binary split K-means: (assume you use all available samples in building the centroids at all stages of calculations) Feature representation using VQ and Kmeans. v.8a 11 Split function: new_centroid= old_centriod(1+/-e), for 0.01 e 0.05 A simplified model of the Binary split K-means VQ algorithm m is the counter of how many clusters are current using. M is the number of clusters you want 1 centroid 2 centroids 4 centroids 8 centroids splitting
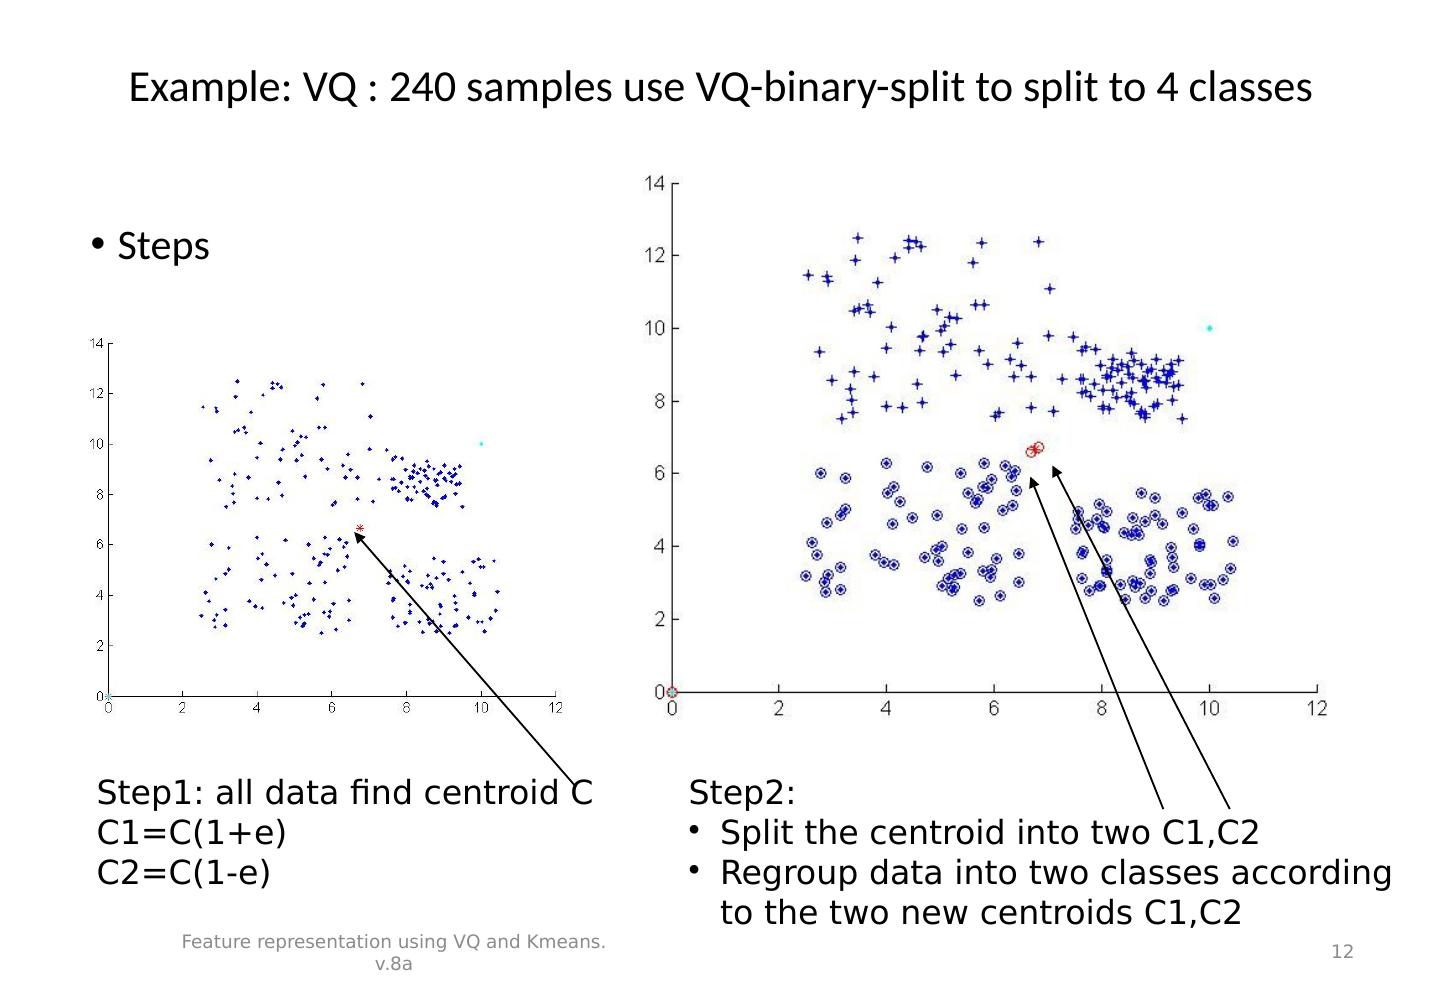
12 .Example: VQ : 240 samples use VQ-binary-split to split to 4 classes Steps Feature representation using VQ and Kmeans. v.8a 12 Step1: all data find centroid C C1=C(1+e) C2=C(1-e) Step2: Split the centroid into two C1,C2 Regroup data into two classes according to the two new centroids C1,C2
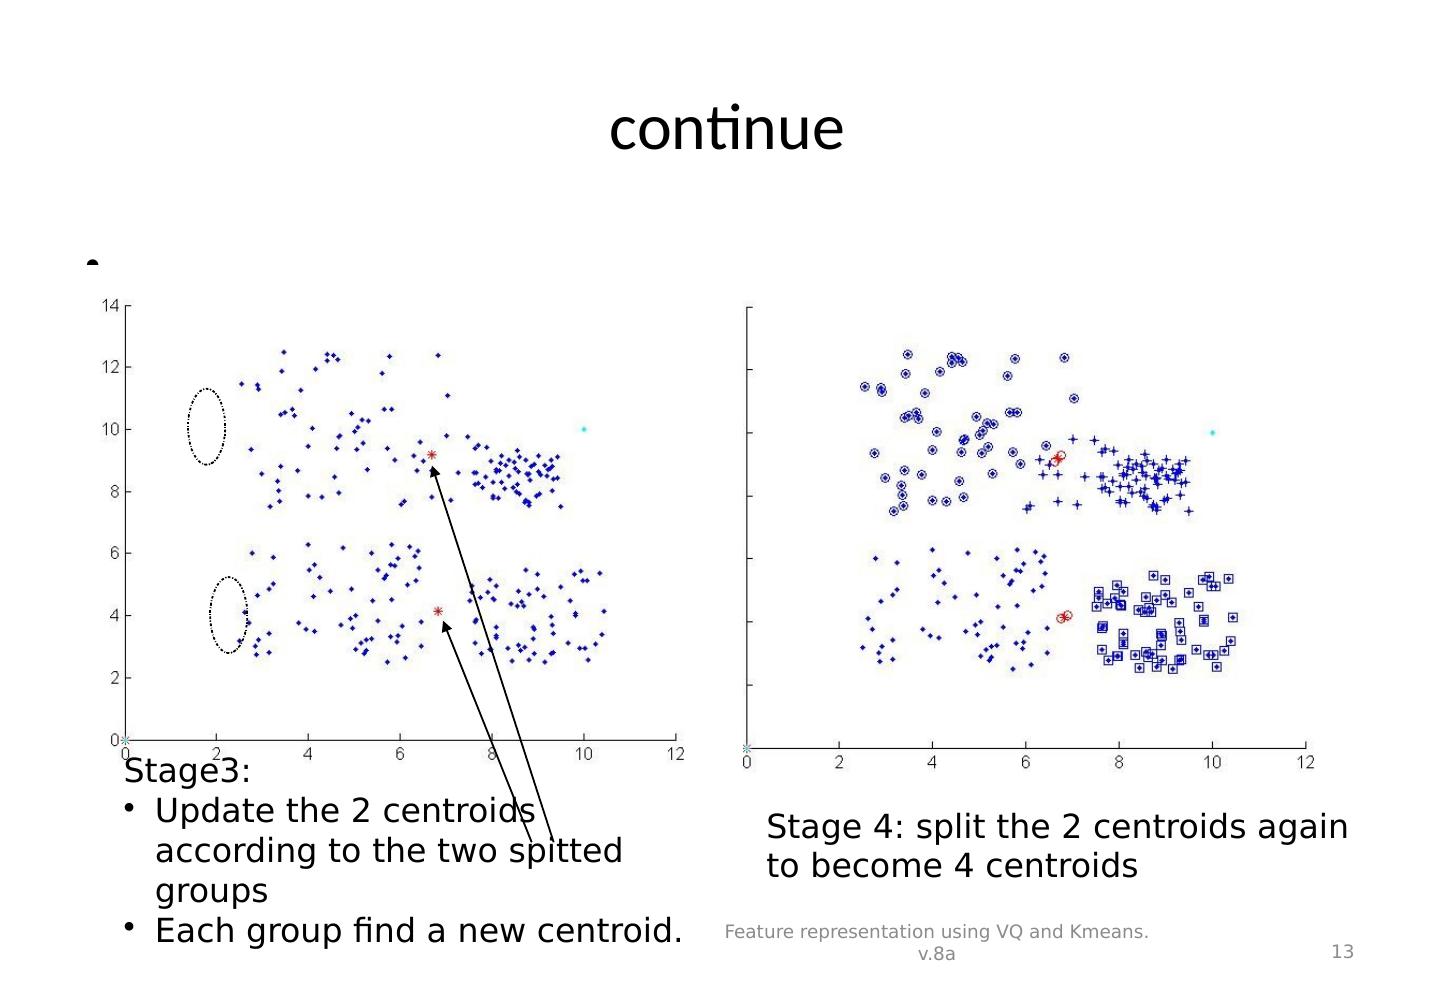
13 . continue Feature representation using VQ and Kmeans. v.8a 13 Stage3: Update the 2 centroids according to the two spitted groups Each group find a new centroid. Stage 4: split the 2 centroids again to become 4 centroids
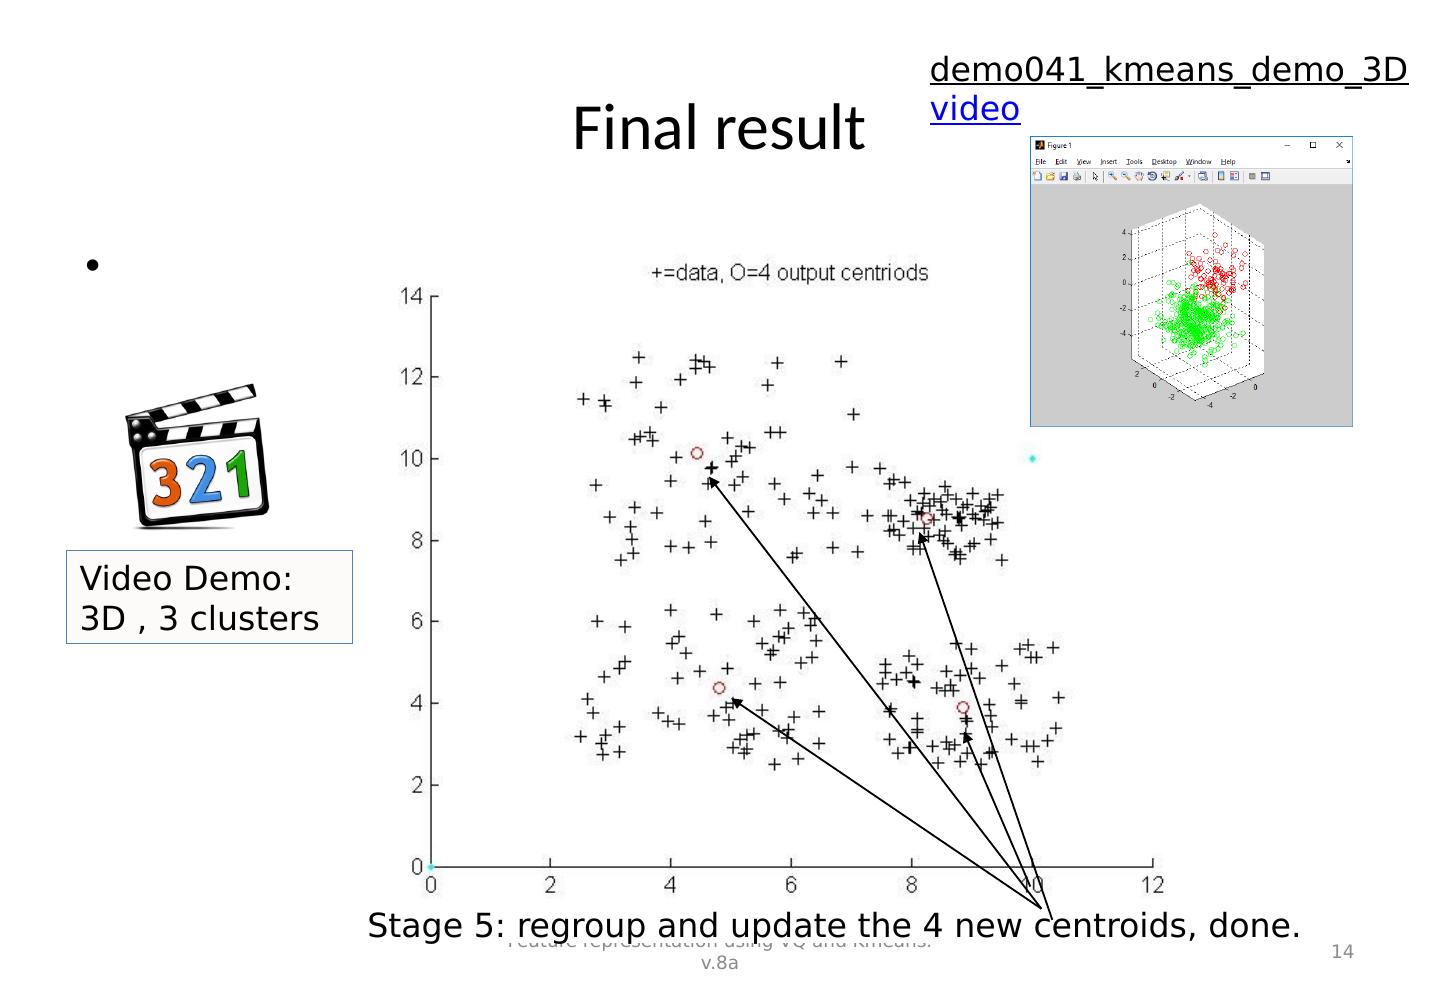
14 .Final result Feature representation using VQ and Kmeans. v.8a 14 Stage 5: regroup and update the 4 new centroids, done. Video Demo: 3D , 3 clusters demo041_kmeans_demo_3D video
15 .Exercise 4.1: VQ Given 4 speech frames, each is described by a 2-D vector ( x,y ) as below. P1=(1.2,8.8); P2=(1.8,6.9); P3=(7.2,1.5); P4=(9.1,0.3). Use K-means method to find the two centroids. Use Binary split K-means method to find the two centroids. Assume you use all available samples in building the centroids at all stages of calculations A raw speech signal is sampled at 10KHz/8-bit. Estimate compression ratio (=raw data storage/compressed data storage) if LPC-order is 10 and frame size is 25ms with no overlapping samples. Feature representation using VQ and Kmeans. v.8a 15
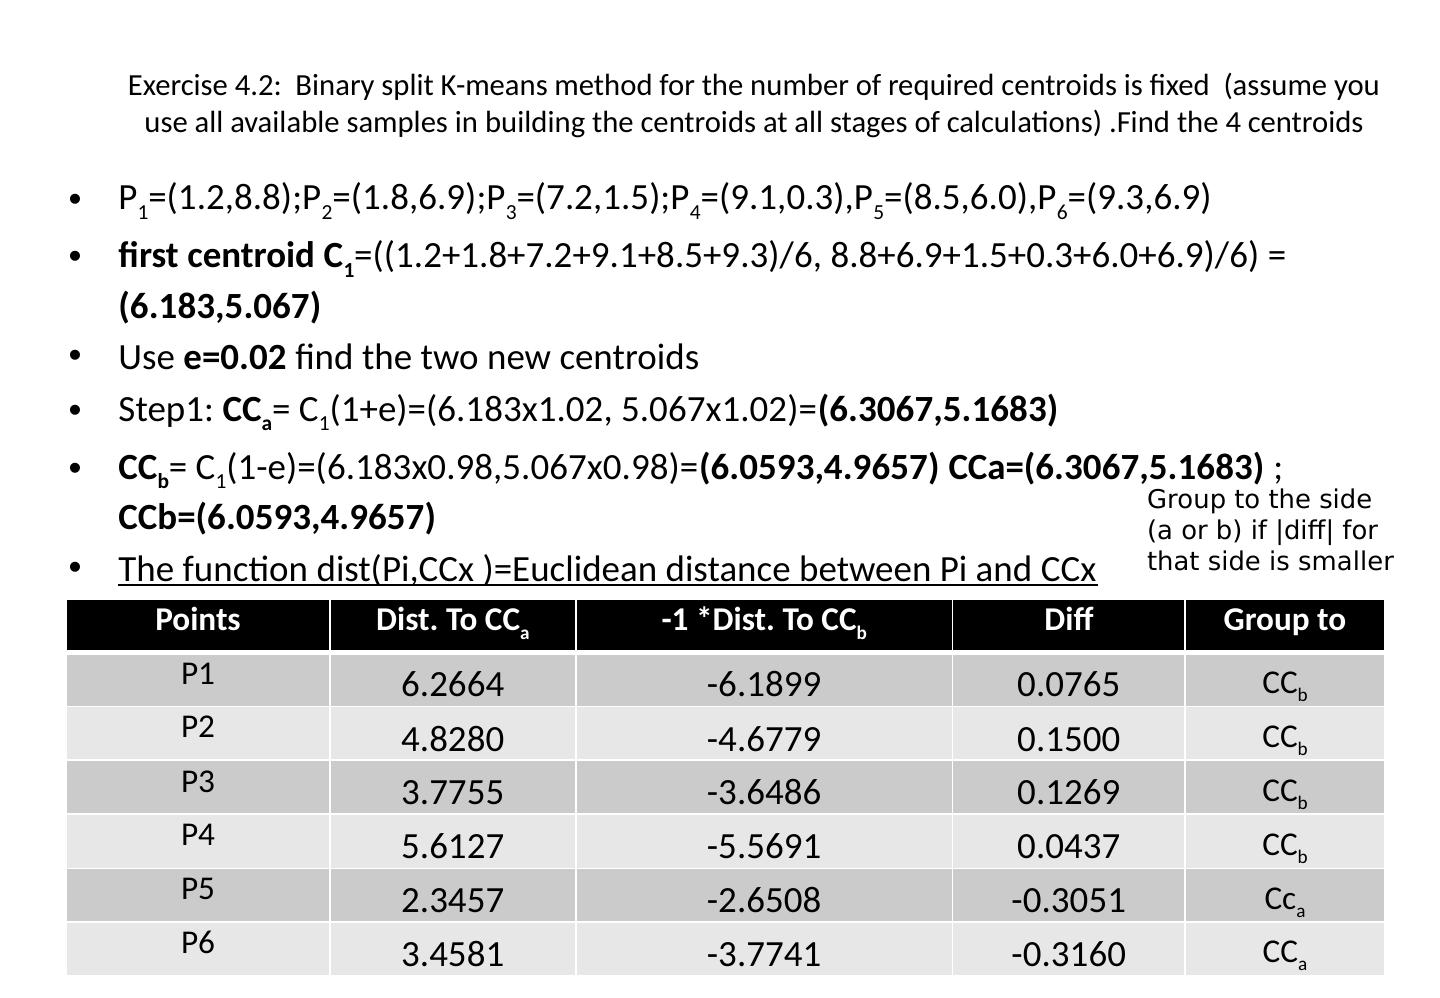
16 .Exercise 4.2: Binary split K-means method for the number of required centroids is fixed (assume you use all available samples in building the centroids at all stages of calculations) .Find the 4 centroids P 1 =(1.2,8.8);P 2 =(1.8,6.9);P 3 =(7.2,1.5);P 4 =(9.1,0.3),P 5 =(8.5,6.0),P 6 =(9.3,6.9) first centroid C 1 =((1.2+1.8+7.2+9.1+8.5+9.3)/6, 8.8+6.9+1.5+0.3+6.0+6.9)/6) = (6.183,5.067) Use e=0.02 find the two new centroids Step1: CC a = C 1 (1+e)=(6.183x1.02, 5.067x1.02)= (6.3067,5.1683 ) CC b = C 1 (1-e)=(6.183x0.98,5.067x0.98) = ( 6.0593 , 4.9657 ) CCa =(6.3067,5.1683 ) ; CCb =( 6.0593 , 4.9657 ) The function dist ( Pi,CCx )=Euclidean distance between Pi and CCx Feature representation using VQ and Kmeans. v.8a 16 Points Dist. To CC a -1 *Dist. To CC b Diff Group to P1 6.2664 -6.1899 0.0765 CC b P2 4.8280 -4.6779 0.1500 CC b P3 3.7755 -3.6486 0.1269 CC b P4 5.6127 -5.5691 0.0437 CC b P5 2.3457 -2.6508 -0.3051 Cc a P6 3.4581 -3.7741 -0.3160 CC a Group to the side (a or b) if |diff| for that side is smaller
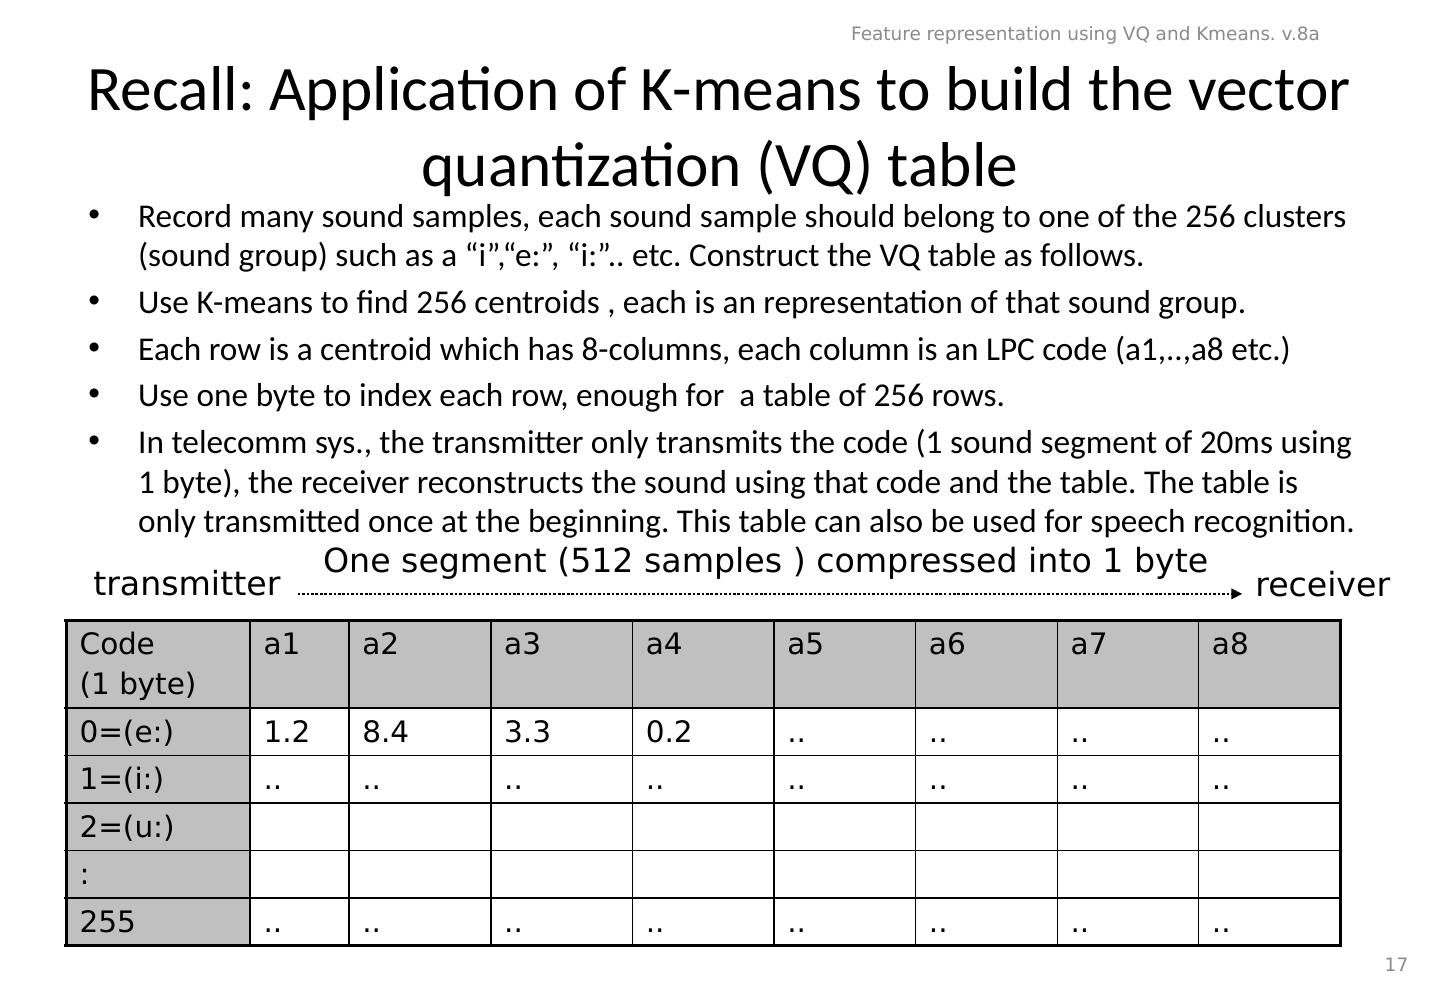
17 .Recall: Application of K-means to build the vector quantization (VQ) table Record many sound samples, each sound sample should belong to one of the 256 clusters (sound group) such as a “ i ”,“e:”, “ i :”.. etc. Construct the VQ table as follows. Use K-means to find 256 centroids , each is an representation of that sound group. Each row is a centroid which has 8-columns, each column is an LPC code (a1,..,a8 etc.) Use one byte to index each row, enough for a table of 256 rows. In telecomm sys., the transmitter only transmits the code (1 sound segment of 20ms using 1 byte), the receiver reconstructs the sound using that code and the table. The table is only transmitted once at the beginning. This table can also be used for speech recognition. Code (1 byte) a1 a2 a3 a4 a5 a6 a7 a8 0=(e:) 1.2 8.4 3.3 0.2 .. .. .. .. 1=(i:) .. .. .. .. .. .. .. .. 2=(u:) : 255 .. .. .. .. .. .. .. .. Feature representation using VQ and Kmeans. v.8a 17 transmitter receiver One segment (512 samples ) compressed into 1 byte
18 .4.3 Exercise X =[1.5 5.9 0.6 4.2 4.9 8.5 9.5 10 7.0 9.5 6.9 0.3 11.2 4.2 4.8 2.1 ] e=0.1 Use Binary Split K-means to find centroids of 4 cluster 4 Answer: Feature representation using VQ and Kmeans. v.8a 18
19 .Summary Learned Audio feature types How to extract audio features How to represent these features Feature representation using VQ and Kmeans. v.8a 19
20 .Appendix Feature representation using VQ and Kmeans. v.8a 20
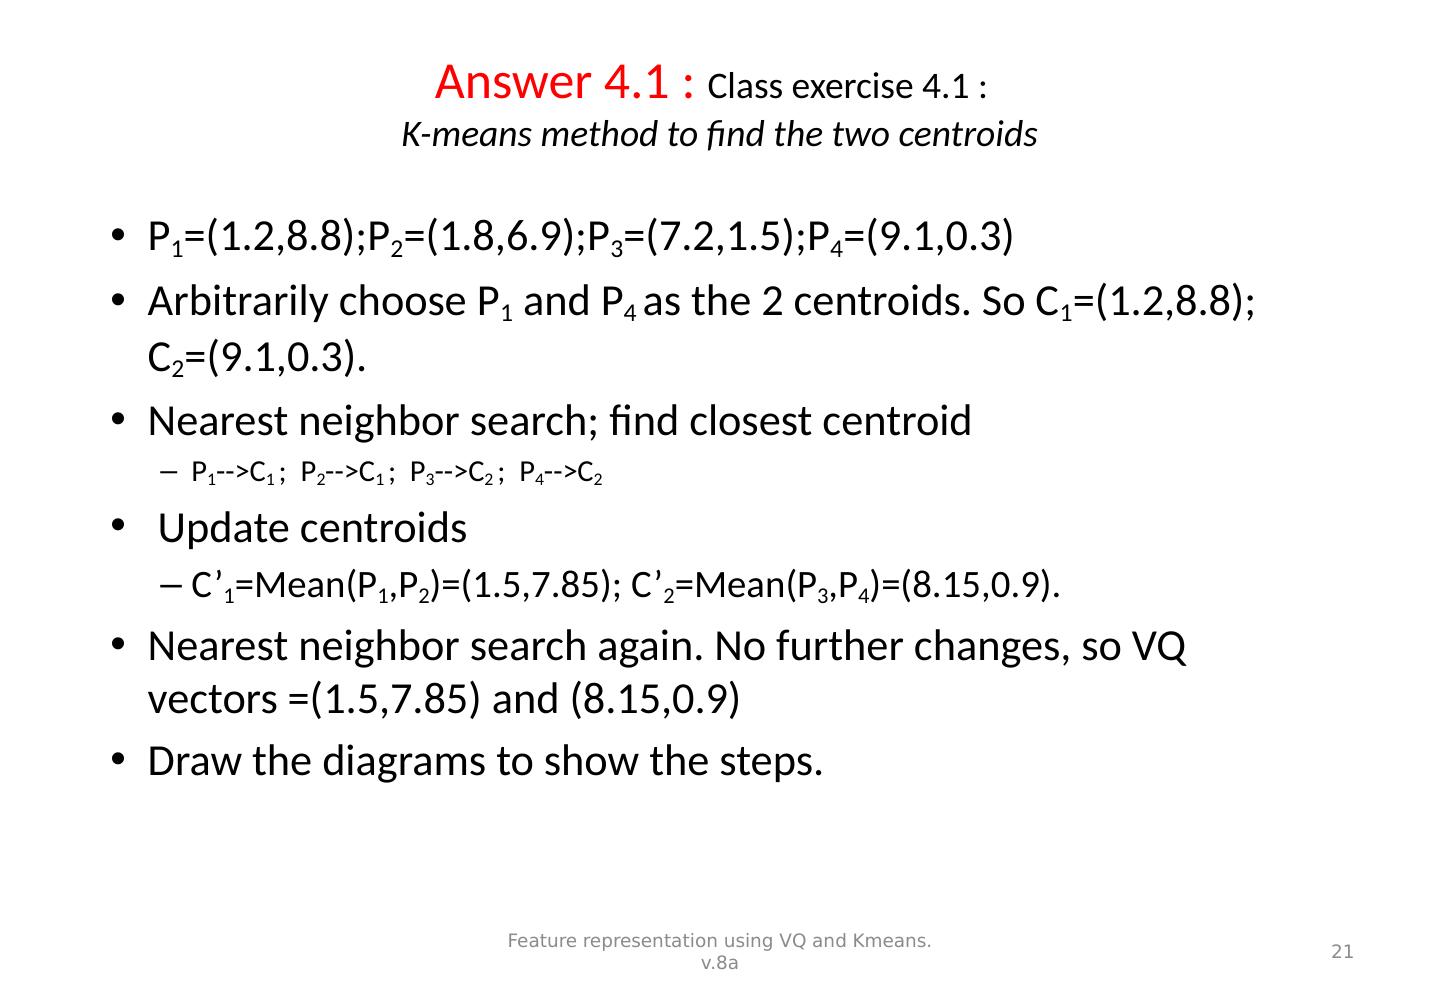
21 .Answer 4.1 : Class exercise 4.1 : K-means method to find the two centroids P 1 =(1.2,8.8);P 2 =(1.8,6.9);P 3 =(7.2,1.5);P 4 =(9.1,0.3) Arbitrarily choose P 1 and P 4 as the 2 centroids. So C 1 =(1.2,8.8); C 2 =(9.1,0.3). Nearest neighbor search; find closest centroid P 1 -->C 1 ; P 2 -->C 1 ; P 3 -->C 2 ; P 4 -->C 2 Update centroids C’ 1 =Mean(P 1 ,P 2 )=(1.5,7.85); C’ 2 =Mean(P 3 ,P 4 )=(8.15,0.9). Nearest neighbor search again. No further changes, so VQ vectors =(1.5,7.85) and (8.15,0.9) Draw the diagrams to show the steps. Feature representation using VQ and Kmeans. v.8a 21
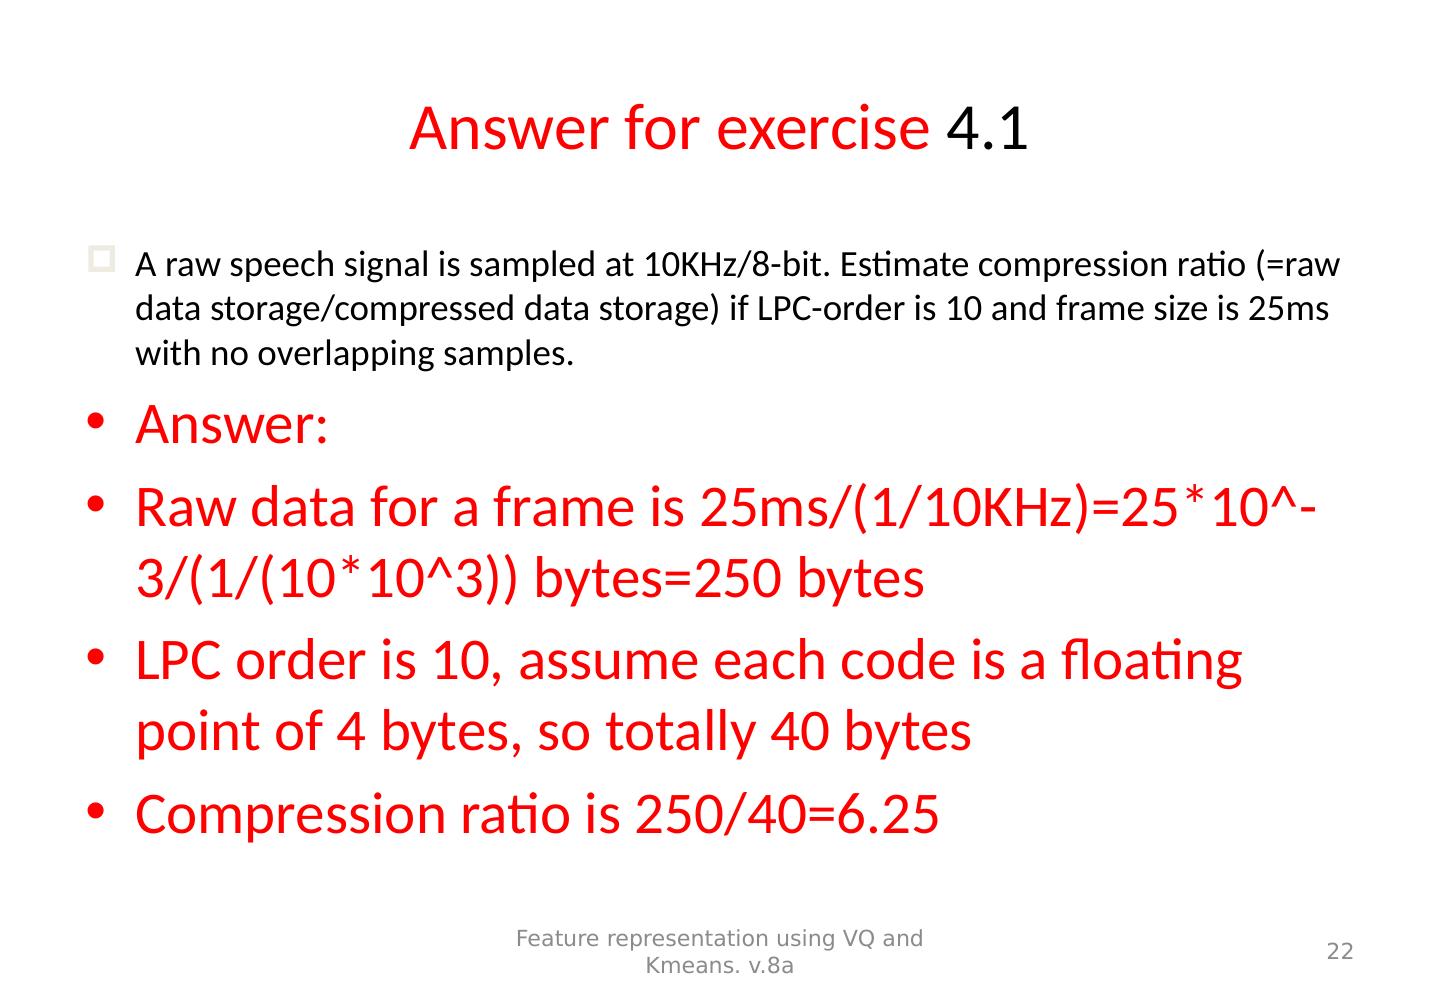
22 .Answer for exercise 4.1 A raw speech signal is sampled at 10KHz/8-bit. Estimate compression ratio (=raw data storage/compressed data storage) if LPC-order is 10 and frame size is 25ms with no overlapping samples. Answer: Raw data for a frame is 25ms/(1/10KHz)=25*10^-3/(1/(10*10^3)) bytes=250 bytes LPC order is 10, assume each code is a floating point of 4 bytes, so totally 40 bytes Compression ratio is 250/40=6.25 Feature representation using VQ and Kmeans. v.8a 22
23 .Answer 4.2: Binary split K-means method for the number of required contriods is fixed (assume you use all available samples in building the centroids at all stages of calculations) P 1 =(1.2,8.8);P 2 =(1.8,6.9);P 3 =(7.2,1.5);P 4 =(9.1,0.3) first centroid C 1 =((1.2+1.8+7.2+9.1)/4, 8.8+6.9+1.5+0.3)/4) = (4.825,4.375) Use e=0.02 find the two new centroids Step1: CC a = C 1 (1+e)=(4.825x1.02,4.375x1.02)=( 4.9215,4.4625) CC b = C 1 (1-e)=(4.825x0.98,4.375x0.98) =(4.7285,4.2875) CCa =( 4.9215,4.4625) CCb =(4.7285,4.2875) The function dist ( Pi,CCx )=Euclidean distance between Pi and CCx points dist to CCa -1* dist to CCb =diff Group to P1 5.7152 -5.7283 = -0.0131 CCa P2 3.9605 -3.9244 = 0.036 CCb P3 3.7374 -3.7254 = 0.012 CCb P4 5.8980 -5.9169 = -0.019 CCa Feature representation using VQ and Kmeans. v.8a 23
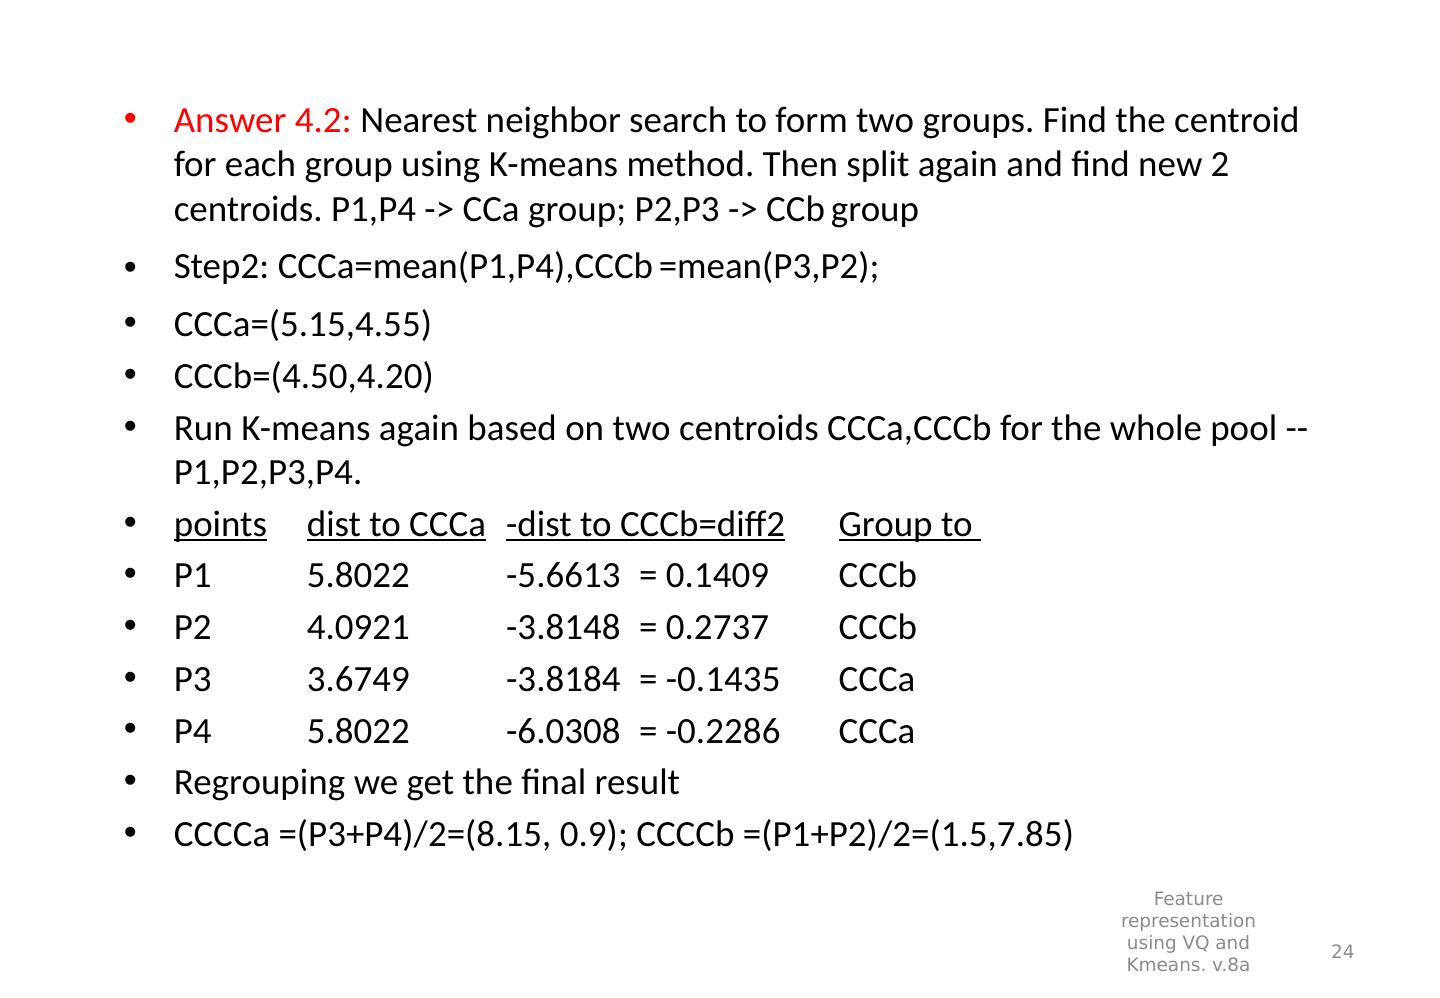
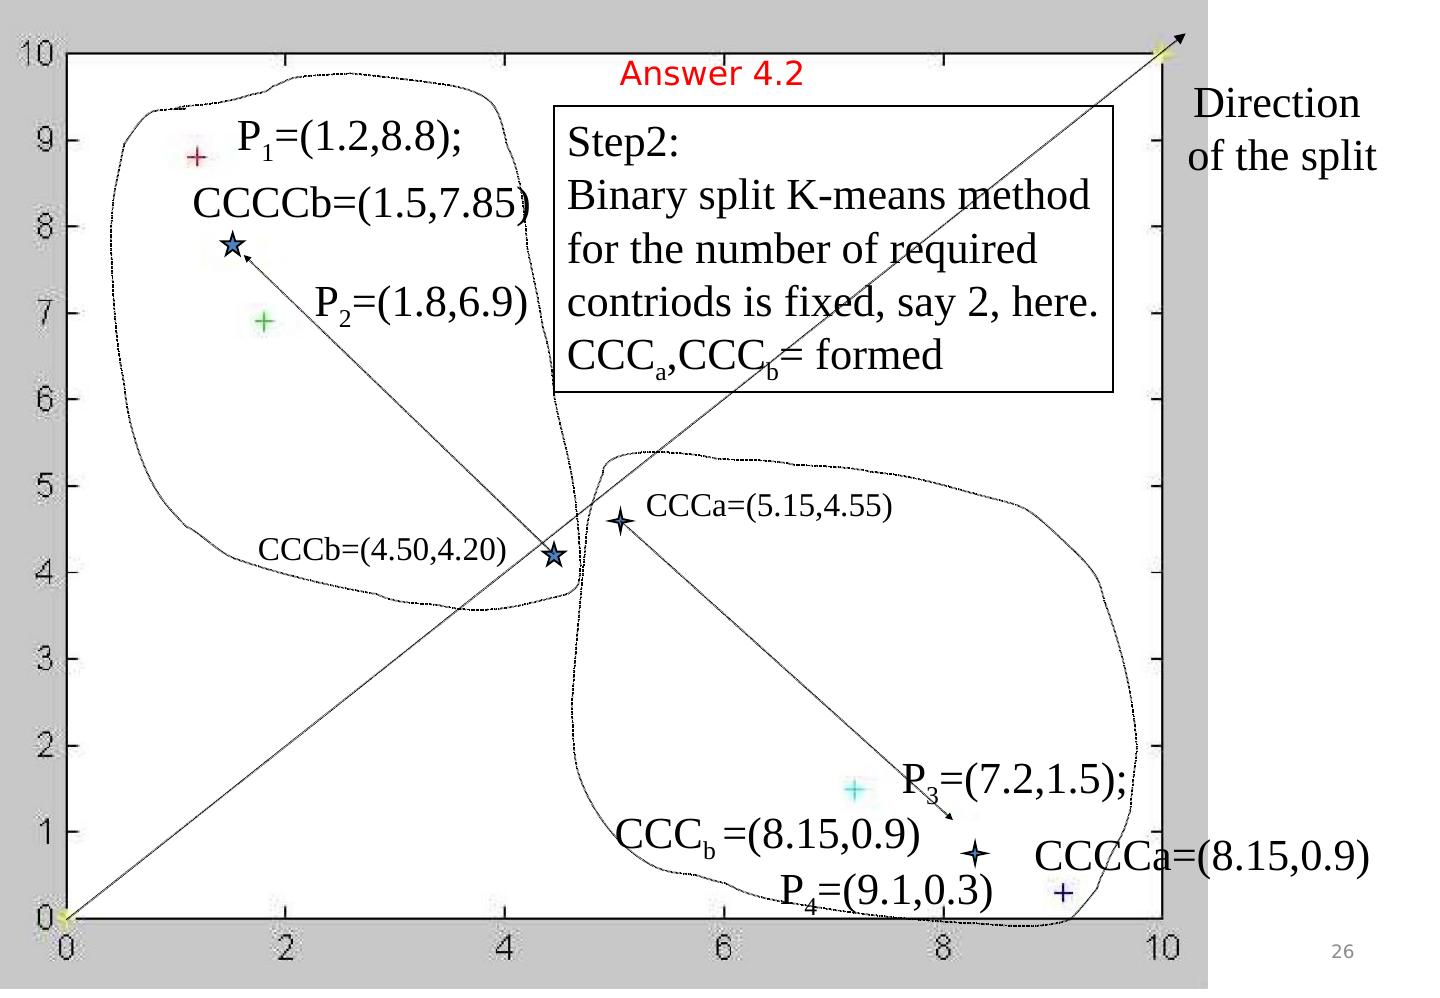
24 . Answer 4.2: Nearest neighbor search to form two groups. Find the centroid for each group using K-means method. Then split again and find new 2 centroids. P1,P4 -> CCa group; P2,P3 -> CCb group Step2: CCCa =mean(P1,P4), CCCb =mean(P3,P2); CCCa =( 5.15,4.55 ) CCCb =(4.50,4.20) Run K-means again based on two centroids CCCa,CCCb for the whole pool -- P1,P2,P3,P4. points dist to CCCa - dist to CCCb =diff2 Group to P1 5.8022 -5.6613 = 0.1409 CCCb P2 4.0921 -3.8148 = 0.2737 CCCb P3 3.6749 -3.8184 = -0.1435 CCCa P4 5.8022 -6.0308 = -0.2286 CCCa Regrouping we get the final result CCCCa =(P3+P4)/2=(8.15, 0.9); CCCCb =(P1+P2)/2=(1.5,7.85) Feature representation using VQ and Kmeans. v.8a 24
25 .Feature representation using VQ and Kmeans. v.8a 25 P 1 =(1.2,8.8); P 2 =(1.8,6.9) P 3 =(7.2,1.5); P 4 =(9.1,0.3) C1=(4.825,4.375) CC b = C 1 (1-e) =(4.7285,4.2875) CC a = C 1 (1+e)=( 4.9215,4.4625) Step1: Binary split K-means method for the number of required contriods is fixed, say 2, here. CC a ,CC b = formed Answer 4.2
26 .Feature representation using VQ and Kmeans. v.8a 26 CCCa=( 5.15,4.55 ) CCC b =( 8.15,0.9) P 1 =(1.2,8.8); P 2 =(1.8,6.9) P 3 =(7.2,1.5); P 4 =(9.1,0.3) Step2: Binary split K-means method for the number of required contriods is fixed, say 2, here. CCC a ,CCC b = formed CCCb=(4.50,4.20) Direction of the split CCCCb=( 1.5,7.85 ) CCCCa=(8.15,0.9) Answer 4.2
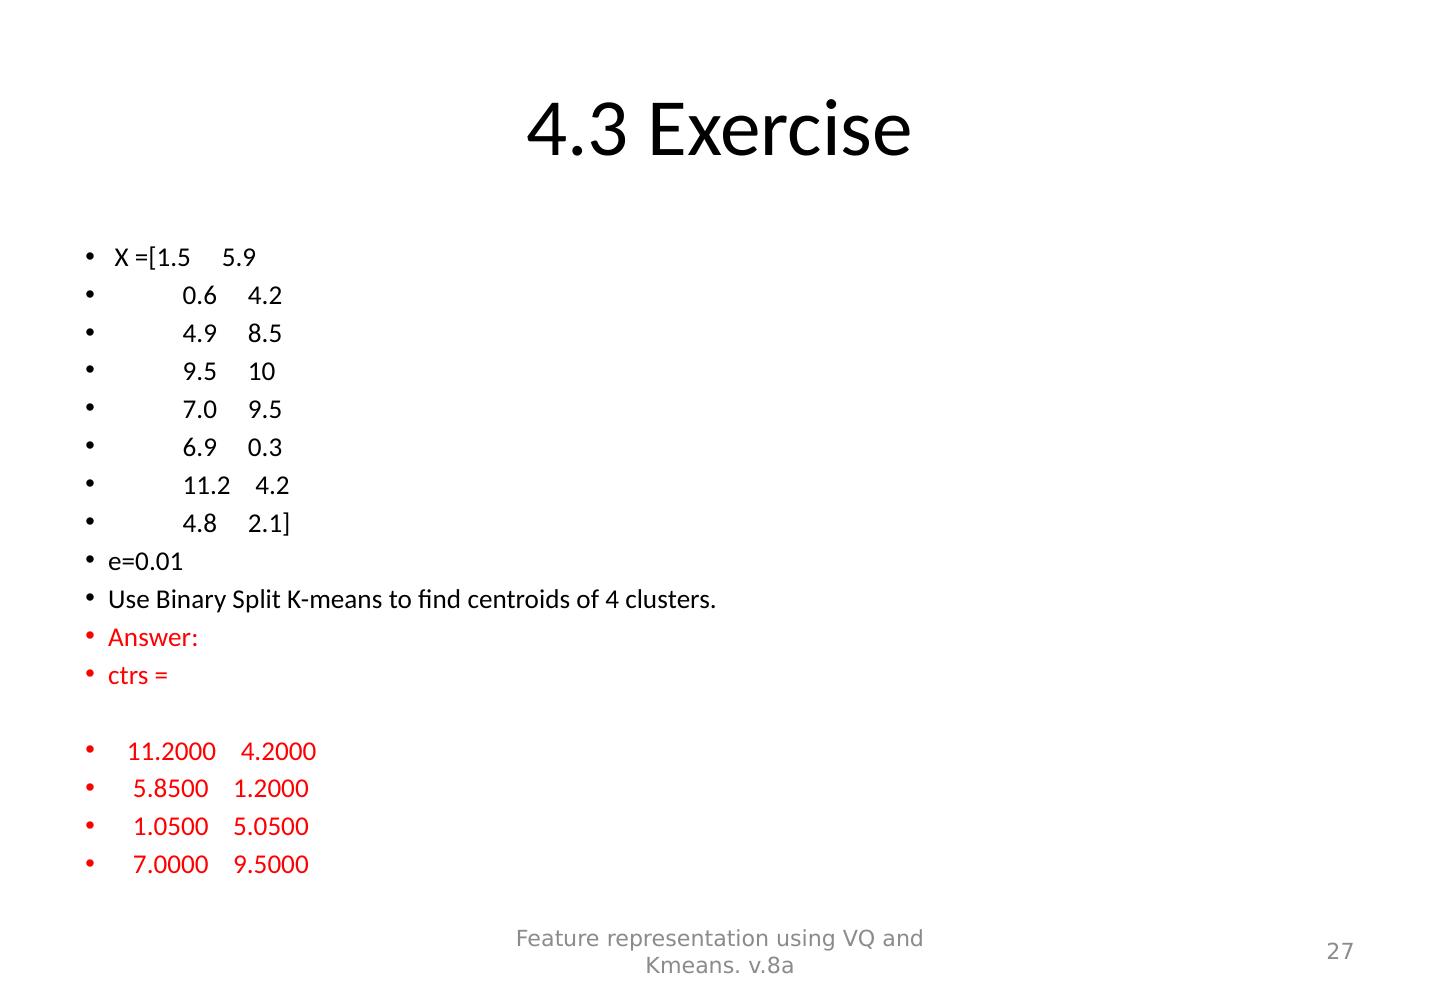
27 .4.3 Exercise X =[1.5 5.9 0.6 4.2 4.9 8.5 9.5 10 7.0 9.5 6.9 0.3 11.2 4.2 4.8 2.1 ] e=0.01 Use Binary Split K-means to find centroids of 4 clusters. Answer: ctrs = 11.2000 4.2000 5.8500 1.2000 1.0500 5.0500 7.0000 9.5000 Feature representation using VQ and Kmeans. v.8a 27


