- 快召唤伙伴们来围观吧
- 微博 QQ QQ空间 贴吧
- 文档嵌入链接
- 复制
- 微信扫一扫分享
- 已成功复制到剪贴板
Design considerations for collaborative visual analytics
展开查看详情
1 . Information Visualization (2008) 7, 49 -- 62 © 2008 Palgr ave Macmillan Ltd. All r ights r eser ved 1473-8716 $30.00 www.palgrave-journals.com/ivs Design considerations for collaborative visual analytics Jeffrey Heer1 Abstract Visualizations leverage the human visual system to support the process of Maneesh Agrawala1 sensemaking, in which information is collected, organized, and analyzed 1 to generate knowledge and inform action. Although most research to date University of California, Berkeley, CA, U.S.A. assumes a single-user focus on perceptual and cognitive processes, in prac- tice, sensemaking is often a social process involving parallelization of effort, Correspondence: discussion, and consensus building. Thus, to fully support sensemaking, Jeffrey Heer, Soda Hall # 1776, Computer Science Division, EECS Department, interactive visualization should also support social interaction. However, the University of California, Berkeley, most appropriate collaboration mechanisms for supporting this interaction CA 94720-1776, U.S.A. are not immediately clear. In this article, we present design considerations Fax: +1 510 642 5775 for asynchronous collaboration in visual analysis environments, highlighting E-mail: jheer@cs.berkeley.edu issues of work parallelization, communication, and social organization. These considerations provide a guide for the design and evaluation of collaborative visualization systems. Information Visualization (2008) 7, 49 -- 62. doi:10.1057/palgrave.ivs.9500167 Keywords: Visualization; visual analytics; sensemaking; social data analysis; collaboration Introduction Visualizations leverage the human visual system to support the analysis of large amounts of information. Although most visualization research to date focuses on the interaction between a single user and an interac- tive display, visual analysis is rarely a solitary activity. Analysts must share and communicate their findings. They may disagree on how to interpret data and contribute contextual knowledge that deepens understanding. As participants build consensus or make decisions, they learn from their peers. Furthermore, some data sets are so large that thorough exploration by a single person is unlikely. Such scenarios regularly arise in busi- ness intelligence,1 intelligence analysis,2,3 and public data consumption.4 Consequently, the design of visual analysis technologies could benefit by considering social interaction in addition to perceptual and cognitive processes. In this spirit, a recent report3 names the design of collaborative visualization tools as a grand challenge for visualization research. The social aspects of visualization have taken on new importance with the rise of the Internet, enabling collaboration between partici- pants acting in different geographic locations and at different times. This distributed, asynchronous style of collaboration introduces new challenges for visualization research. Most existing research on collab- orative visualization has focused on synchronous scenarios: users Received: 1 December 2007 working together at the same time to analyze scientific results or Accepted: 5 January 2008 discuss the state of a battlefield. Collocated collaboration usually Online publication date: 21 February 2008 involves shared displays, including large wall-sized screens and table-top
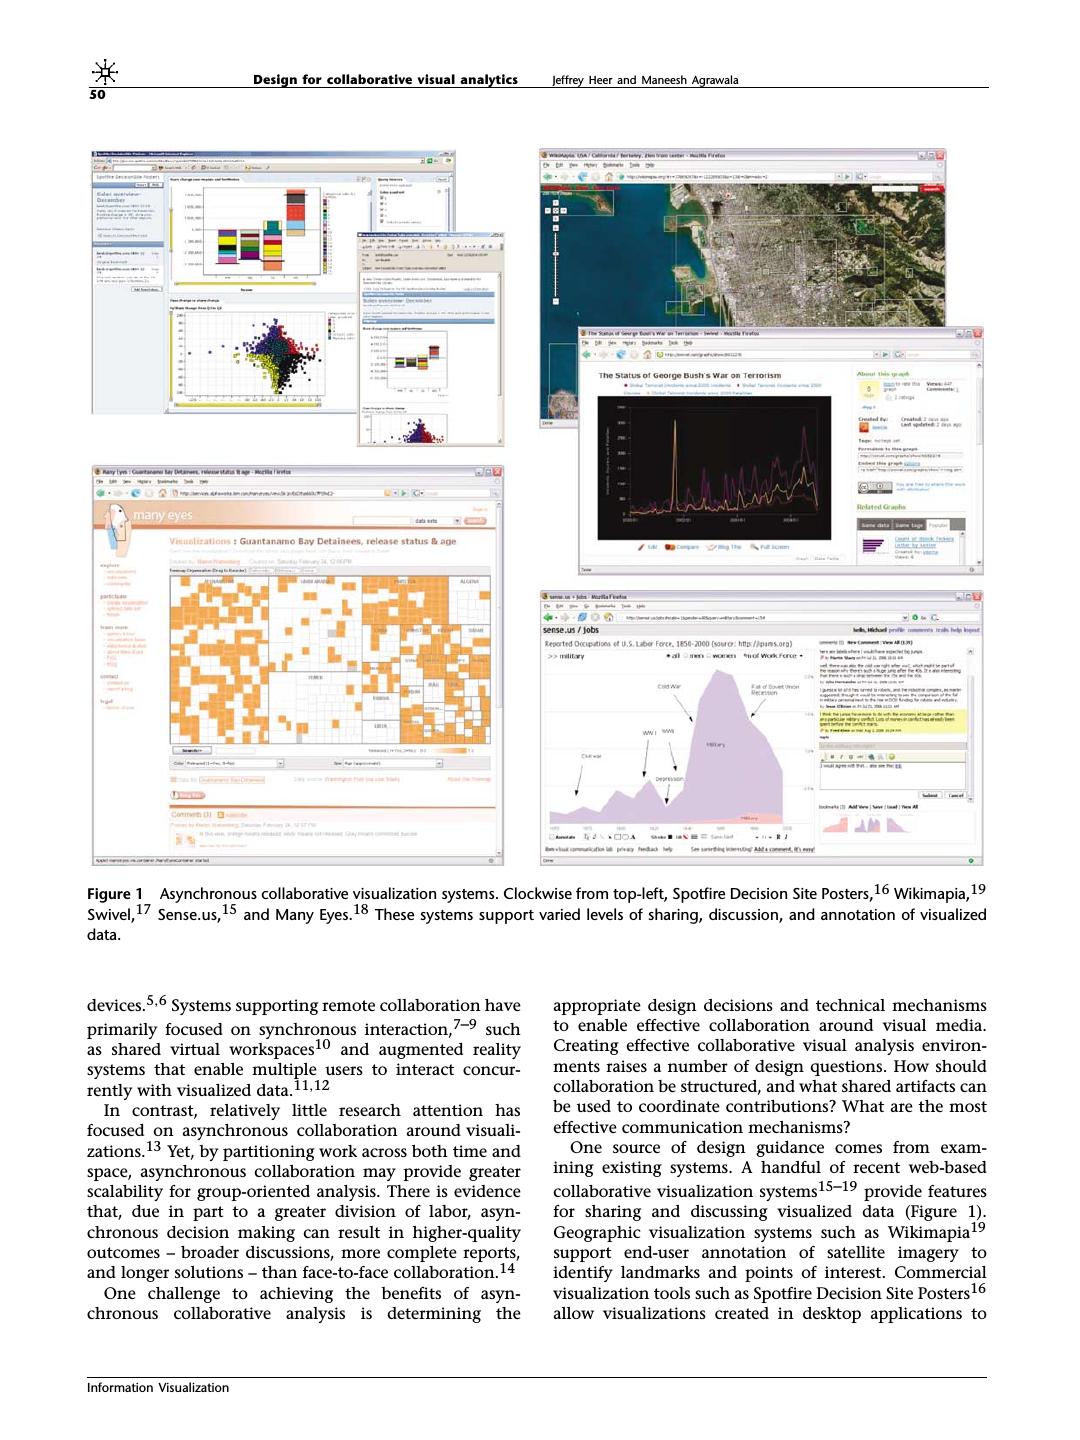
2 . Design for collaborative visual analytics Jeffrey Heer and Maneesh Agrawala 50 Figure 1 Asynchronous collaborative visualization systems. Clockwise from top-left, Spotfire Decision Site Posters,16 Wikimapia,19 Swivel,17 Sense.us,15 and Many Eyes.18 These systems support varied levels of sharing, discussion, and annotation of visualized data. devices.5,6 Systems supporting remote collaboration have appropriate design decisions and technical mechanisms primarily focused on synchronous interaction,7–9 such to enable effective collaboration around visual media. as shared virtual workspaces10 and augmented reality Creating effective collaborative visual analysis environ- systems that enable multiple users to interact concur- ments raises a number of design questions. How should rently with visualized data.11,12 collaboration be structured, and what shared artifacts can In contrast, relatively little research attention has be used to coordinate contributions? What are the most focused on asynchronous collaboration around visuali- effective communication mechanisms? zations.13 Yet, by partitioning work across both time and One source of design guidance comes from exam- space, asynchronous collaboration may provide greater ining existing systems. A handful of recent web-based scalability for group-oriented analysis. There is evidence collaborative visualization systems15–19 provide features that, due in part to a greater division of labor, asyn- for sharing and discussing visualized data (Figure 1). chronous decision making can result in higher-quality Geographic visualization systems such as Wikimapia19 outcomes – broader discussions, more complete reports, support end-user annotation of satellite imagery to and longer solutions – than face-to-face collaboration.14 identify landmarks and points of interest. Commercial One challenge to achieving the benefits of asyn- visualization tools such as Spotfire Decision Site Posters16 chronous collaborative analysis is determining the allow visualizations created in desktop applications to Information Visualization
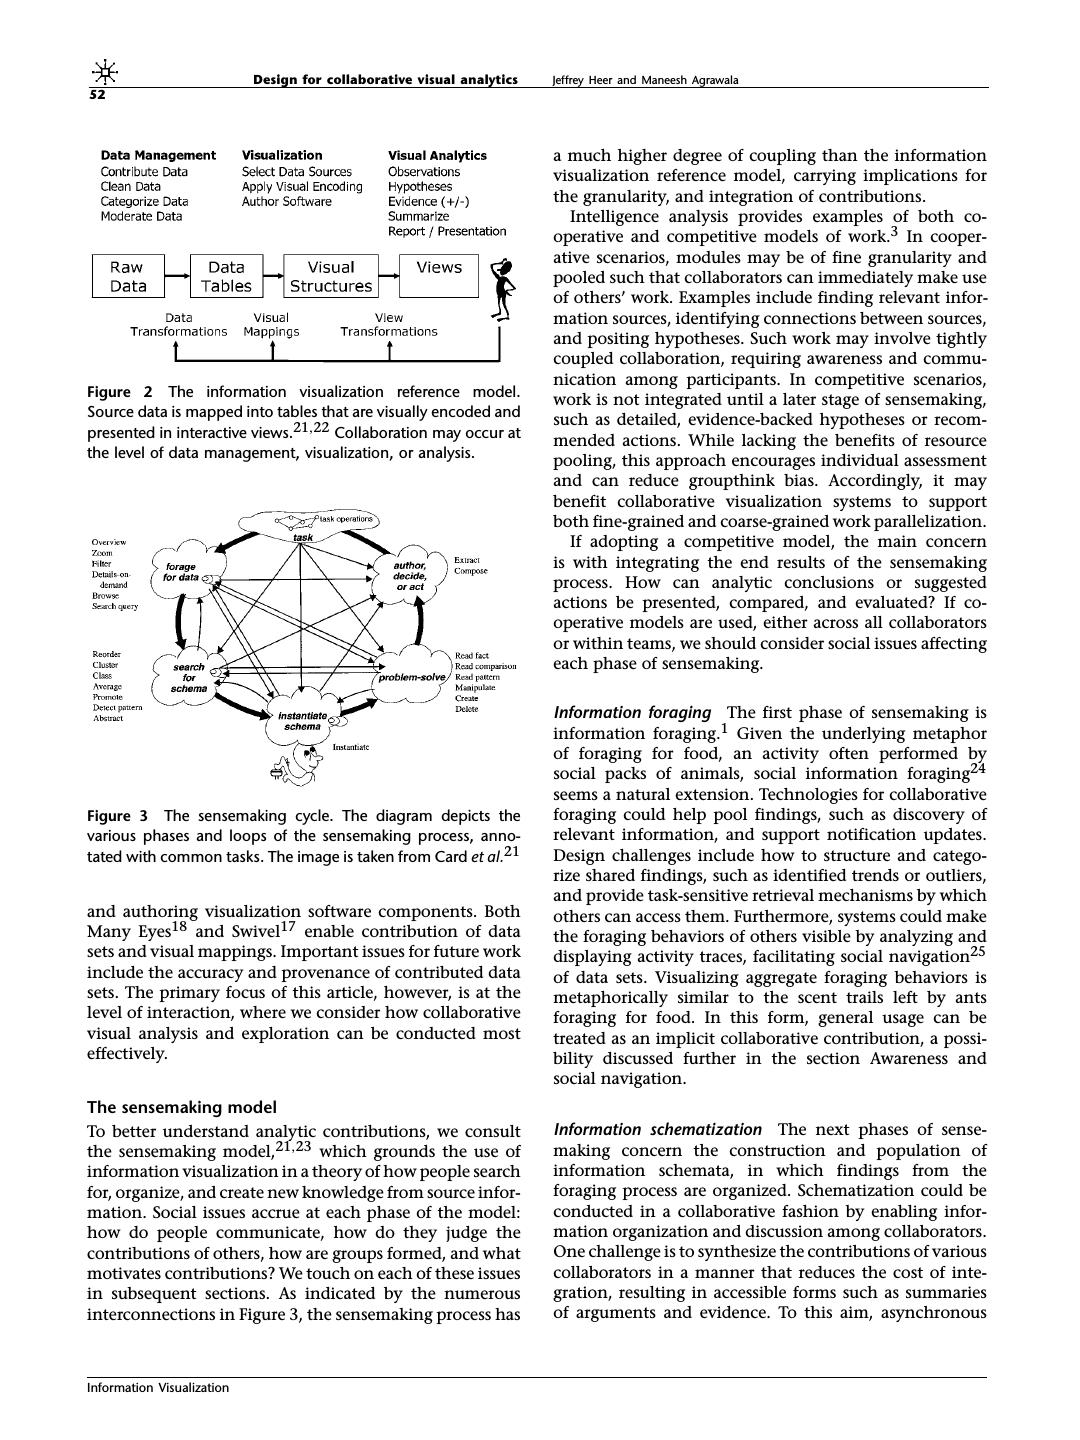
3 . Design for collaborative visual analytics Jeffrey Heer and Maneesh Agrawala 51 be posted to web pages and discussed through text refers to how work is segmented into atomic units, paral- comments. The public web sites Many-Eyes.com18 and lelizing work into independent tasks. The granularity of Swivel.com17 allow users to upload data sets and visualize a module is a measure of the cost or effort involved in them using a palette of supported visualizations. Collab- performing the task. The optimal granularity of modules is oration is supported through application bookmarks closely tied to the incentives for performing the work. For (in the form of URLs) into specific visualization states, example, in online scenarios where the incentives tend blog-style text comments, and posting linked screen- to be small and non-monetary, a small granularity helps shots to external blogs. The research prototype sense.us15 facilitate participation, encouraging people to participate provides new techniques for linking commentary with in part due to the ease of contributing. A variety of granu- visualization states and supports graphical annotation larities enables different classes of contribution to emerge. and the construction of tours through multiple visual- The third aspect of Benkler’s model is the cost of inte- ization states. Observing usage of these systems provides gration: what effort is required to usefully synthesize the numerous examples of group sensemaking in action15 contributions of each individual module? Collaborative cycles of observation, question, and hypothesis; social work will only be effective if the cost of integration is navigation to interesting or controversial data; and iden- low enough to warrant the overhead of modularization tification of problematic or incorrect data values. while enforcing adequate quality control. There are a Still, these systems represent only the first steps in a number of mutually inclusive approaches to handling larger design space; many challenges remain for providing integration: automation (automatically integrating work effective, scalable forms of collaborative analysis. We through technological means), peer production (casting wish to better support the observed user behaviors of integration as an additional collaborative task given to these existing systems by grounding design decisions in trusted participants), social norms (using social pressures both practical and theoretical knowledge of social inter- to reduce vandalistic behavior), and hierarchical control action. A theoretically grounded design framework can (exercising explicit moderation). be applied to contrast the existing offerings and guide Collaborative visual analytics can similarly be viewed the future research and development of social visual as a process of peer production of information goods. analysis systems. Towards this aim, we review research Such goods may include the observations, questions, and in analytics, social psychology, sociology, organizational hypotheses generated in the analysis process as well as studies, and computer-supported cooperative work to tours or presentations of analysis results. Questions for identify a set of design considerations to inform the collaborative visualization include how to facilitate the development of asynchronous collaborative information modularization of work. The first step is determining the visualization systems. units (modules) of contribution and their granularity. The goal of this article is to identify key issues to guide Existing frameworks for aiding this task include struc- work in collaborative visual analytics. We have grouped tural models of visualization design and sensemaking our design considerations into seven inter-related areas: processes. Once modules have been identified, one can division and allocation of work; common ground and then attempt designs that reduce the cost structure for awareness; reference and deixis; incentives and engage- these tasks. Another important concern is the proscrip- ment; identity, trust, and reputation; group dynamics; tion of particular task types or roles – what aspects should and consensus and decision making. In each of these be formally inscribed in the system and what should be areas, we discuss the aspect underlying effective collab- left open to negotiation and definition by work groups oration and suggest specific mechanisms by which they themselves? could be achieved. We conclude by summarizing the various design considerations presented and suggesting avenues for future research and development in collabo- The information visualization reference model rative visual analytics. One model for identifying modules of contribution is the information visualization reference model,21,22 a general pattern for describing visualization applications (Figure 2). Division and allocation of work The model decomposes the visualization process into A fundamental aspect of successful collaboration is an data acquisition and representation, visual encoding of effective division of labor among participants. This data, and display and interaction. Each phase of this involves both the segmentation of effort into proper model provides an entry point for collaborative activity. units of work and the allocation of individuals to tasks in Contributions involving data include uploading data sets, a manner that best matches their skills and disposition. cleaning or reformatting data, moderating contributed Primary concerns are how to split work among multiple data (e.g., to safeguard copyright or privacy concerns), and participants and meaningfully aggregate the results. affixing metadata (e.g., providing keyword tags). Addi- Benkler20 describes the role of modularity, granularity, tional contributions of varying granularity lie in the appli- and cost of integration in the peer production of informa- cation of visual encodings. Examples include matching tion goods, drawing on examples such as online discus- data sets with existing visualization components, editing sions, open source software, and Wikipedia. Modularity visual mappings to form more effective visualizations, Information Visualization
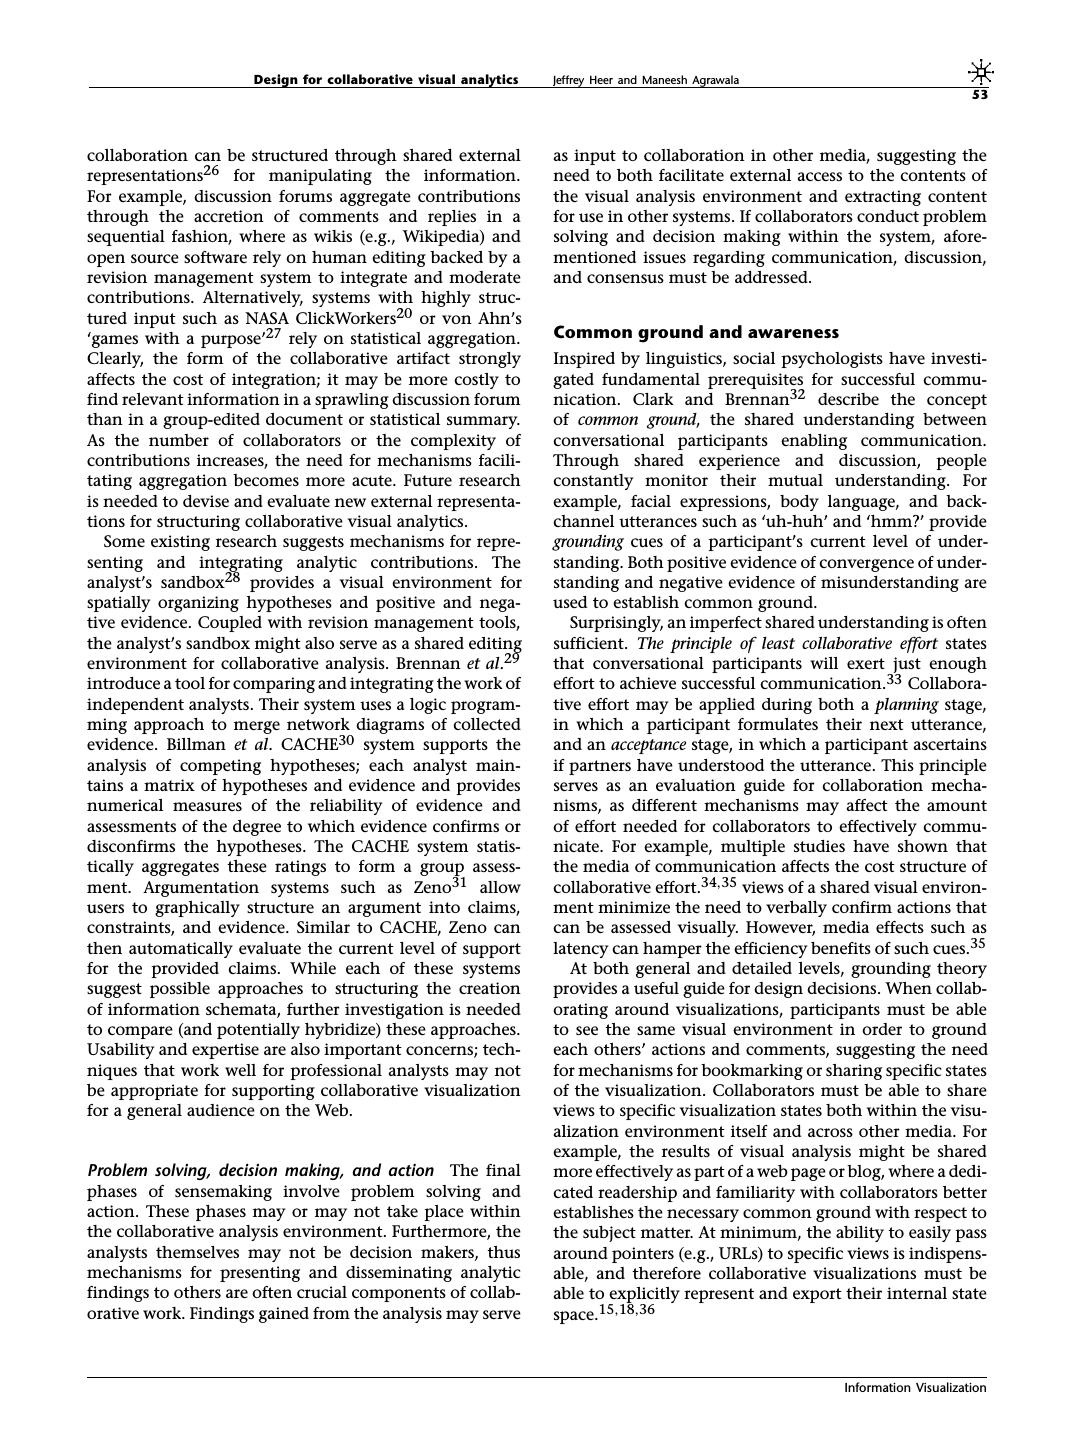
4 . Design for collaborative visual analytics Jeffrey Heer and Maneesh Agrawala 52 a much higher degree of coupling than the information visualization reference model, carrying implications for the granularity, and integration of contributions. Intelligence analysis provides examples of both co- operative and competitive models of work.3 In cooper- ative scenarios, modules may be of fine granularity and pooled such that collaborators can immediately make use of others’ work. Examples include finding relevant infor- mation sources, identifying connections between sources, and positing hypotheses. Such work may involve tightly coupled collaboration, requiring awareness and commu- nication among participants. In competitive scenarios, Figure 2 The information visualization reference model. work is not integrated until a later stage of sensemaking, Source data is mapped into tables that are visually encoded and such as detailed, evidence-backed hypotheses or recom- presented in interactive views.21,22 Collaboration may occur at mended actions. While lacking the benefits of resource the level of data management, visualization, or analysis. pooling, this approach encourages individual assessment and can reduce groupthink bias. Accordingly, it may benefit collaborative visualization systems to support both fine-grained and coarse-grained work parallelization. If adopting a competitive model, the main concern is with integrating the end results of the sensemaking process. How can analytic conclusions or suggested actions be presented, compared, and evaluated? If co- operative models are used, either across all collaborators or within teams, we should consider social issues affecting each phase of sensemaking. Information foraging The first phase of sensemaking is information foraging.1 Given the underlying metaphor of foraging for food, an activity often performed by social packs of animals, social information foraging24 seems a natural extension. Technologies for collaborative Figure 3 The sensemaking cycle. The diagram depicts the foraging could help pool findings, such as discovery of various phases and loops of the sensemaking process, anno- relevant information, and support notification updates. tated with common tasks. The image is taken from Card et al.21 Design challenges include how to structure and catego- rize shared findings, such as identified trends or outliers, and provide task-sensitive retrieval mechanisms by which and authoring visualization software components. Both others can access them. Furthermore, systems could make Many Eyes18 and Swivel17 enable contribution of data the foraging behaviors of others visible by analyzing and sets and visual mappings. Important issues for future work displaying activity traces, facilitating social navigation25 include the accuracy and provenance of contributed data of data sets. Visualizing aggregate foraging behaviors is sets. The primary focus of this article, however, is at the metaphorically similar to the scent trails left by ants level of interaction, where we consider how collaborative foraging for food. In this form, general usage can be visual analysis and exploration can be conducted most treated as an implicit collaborative contribution, a possi- effectively. bility discussed further in the section Awareness and social navigation. The sensemaking model To better understand analytic contributions, we consult Information schematization The next phases of sense- the sensemaking model,21,23 which grounds the use of making concern the construction and population of information visualization in a theory of how people search information schemata, in which findings from the for, organize, and create new knowledge from source infor- foraging process are organized. Schematization could be mation. Social issues accrue at each phase of the model: conducted in a collaborative fashion by enabling infor- how do people communicate, how do they judge the mation organization and discussion among collaborators. contributions of others, how are groups formed, and what One challenge is to synthesize the contributions of various motivates contributions? We touch on each of these issues collaborators in a manner that reduces the cost of inte- in subsequent sections. As indicated by the numerous gration, resulting in accessible forms such as summaries interconnections in Figure 3, the sensemaking process has of arguments and evidence. To this aim, asynchronous Information Visualization
5 . Design for collaborative visual analytics Jeffrey Heer and Maneesh Agrawala 53 collaboration can be structured through shared external as input to collaboration in other media, suggesting the representations26 for manipulating the information. need to both facilitate external access to the contents of For example, discussion forums aggregate contributions the visual analysis environment and extracting content through the accretion of comments and replies in a for use in other systems. If collaborators conduct problem sequential fashion, where as wikis (e.g., Wikipedia) and solving and decision making within the system, afore- open source software rely on human editing backed by a mentioned issues regarding communication, discussion, revision management system to integrate and moderate and consensus must be addressed. contributions. Alternatively, systems with highly struc- tured input such as NASA ClickWorkers20 or von Ahn’s ‘games with a purpose’27 rely on statistical aggregation. Common ground and awareness Clearly, the form of the collaborative artifact strongly Inspired by linguistics, social psychologists have investi- affects the cost of integration; it may be more costly to gated fundamental prerequisites for successful commu- find relevant information in a sprawling discussion forum nication. Clark and Brennan32 describe the concept than in a group-edited document or statistical summary. of common ground, the shared understanding between As the number of collaborators or the complexity of conversational participants enabling communication. contributions increases, the need for mechanisms facili- Through shared experience and discussion, people tating aggregation becomes more acute. Future research constantly monitor their mutual understanding. For is needed to devise and evaluate new external representa- example, facial expressions, body language, and back- tions for structuring collaborative visual analytics. channel utterances such as ‘uh-huh’ and ‘hmm?’ provide Some existing research suggests mechanisms for repre- grounding cues of a participant’s current level of under- senting and integrating analytic contributions. The standing. Both positive evidence of convergence of under- analyst’s sandbox28 provides a visual environment for standing and negative evidence of misunderstanding are spatially organizing hypotheses and positive and nega- used to establish common ground. tive evidence. Coupled with revision management tools, Surprisingly, an imperfect shared understanding is often the analyst’s sandbox might also serve as a shared editing sufficient. The principle of least collaborative effort states environment for collaborative analysis. Brennan et al.29 that conversational participants will exert just enough introduce a tool for comparing and integrating the work of effort to achieve successful communication.33 Collabora- independent analysts. Their system uses a logic program- tive effort may be applied during both a planning stage, ming approach to merge network diagrams of collected in which a participant formulates their next utterance, evidence. Billman et al. CACHE30 system supports the and an acceptance stage, in which a participant ascertains analysis of competing hypotheses; each analyst main- if partners have understood the utterance. This principle tains a matrix of hypotheses and evidence and provides serves as an evaluation guide for collaboration mecha- numerical measures of the reliability of evidence and nisms, as different mechanisms may affect the amount assessments of the degree to which evidence confirms or of effort needed for collaborators to effectively commu- disconfirms the hypotheses. The CACHE system statis- nicate. For example, multiple studies have shown that tically aggregates these ratings to form a group assess- the media of communication affects the cost structure of ment. Argumentation systems such as Zeno31 allow collaborative effort.34,35 views of a shared visual environ- users to graphically structure an argument into claims, ment minimize the need to verbally confirm actions that constraints, and evidence. Similar to CACHE, Zeno can can be assessed visually. However, media effects such as then automatically evaluate the current level of support latency can hamper the efficiency benefits of such cues.35 for the provided claims. While each of these systems At both general and detailed levels, grounding theory suggest possible approaches to structuring the creation provides a useful guide for design decisions. When collab- of information schemata, further investigation is needed orating around visualizations, participants must be able to compare (and potentially hybridize) these approaches. to see the same visual environment in order to ground Usability and expertise are also important concerns; tech- each others’ actions and comments, suggesting the need niques that work well for professional analysts may not for mechanisms for bookmarking or sharing specific states be appropriate for supporting collaborative visualization of the visualization. Collaborators must be able to share for a general audience on the Web. views to specific visualization states both within the visu- alization environment itself and across other media. For example, the results of visual analysis might be shared Problem solving, decision making, and action The final more effectively as part of a web page or blog, where a dedi- phases of sensemaking involve problem solving and cated readership and familiarity with collaborators better action. These phases may or may not take place within establishes the necessary common ground with respect to the collaborative analysis environment. Furthermore, the the subject matter. At minimum, the ability to easily pass analysts themselves may not be decision makers, thus around pointers (e.g., URLs) to specific views is indispens- mechanisms for presenting and disseminating analytic able, and therefore collaborative visualizations must be findings to others are often crucial components of collab- able to explicitly represent and export their internal state orative work. Findings gained from the analysis may serve space.15,18,36 Information Visualization
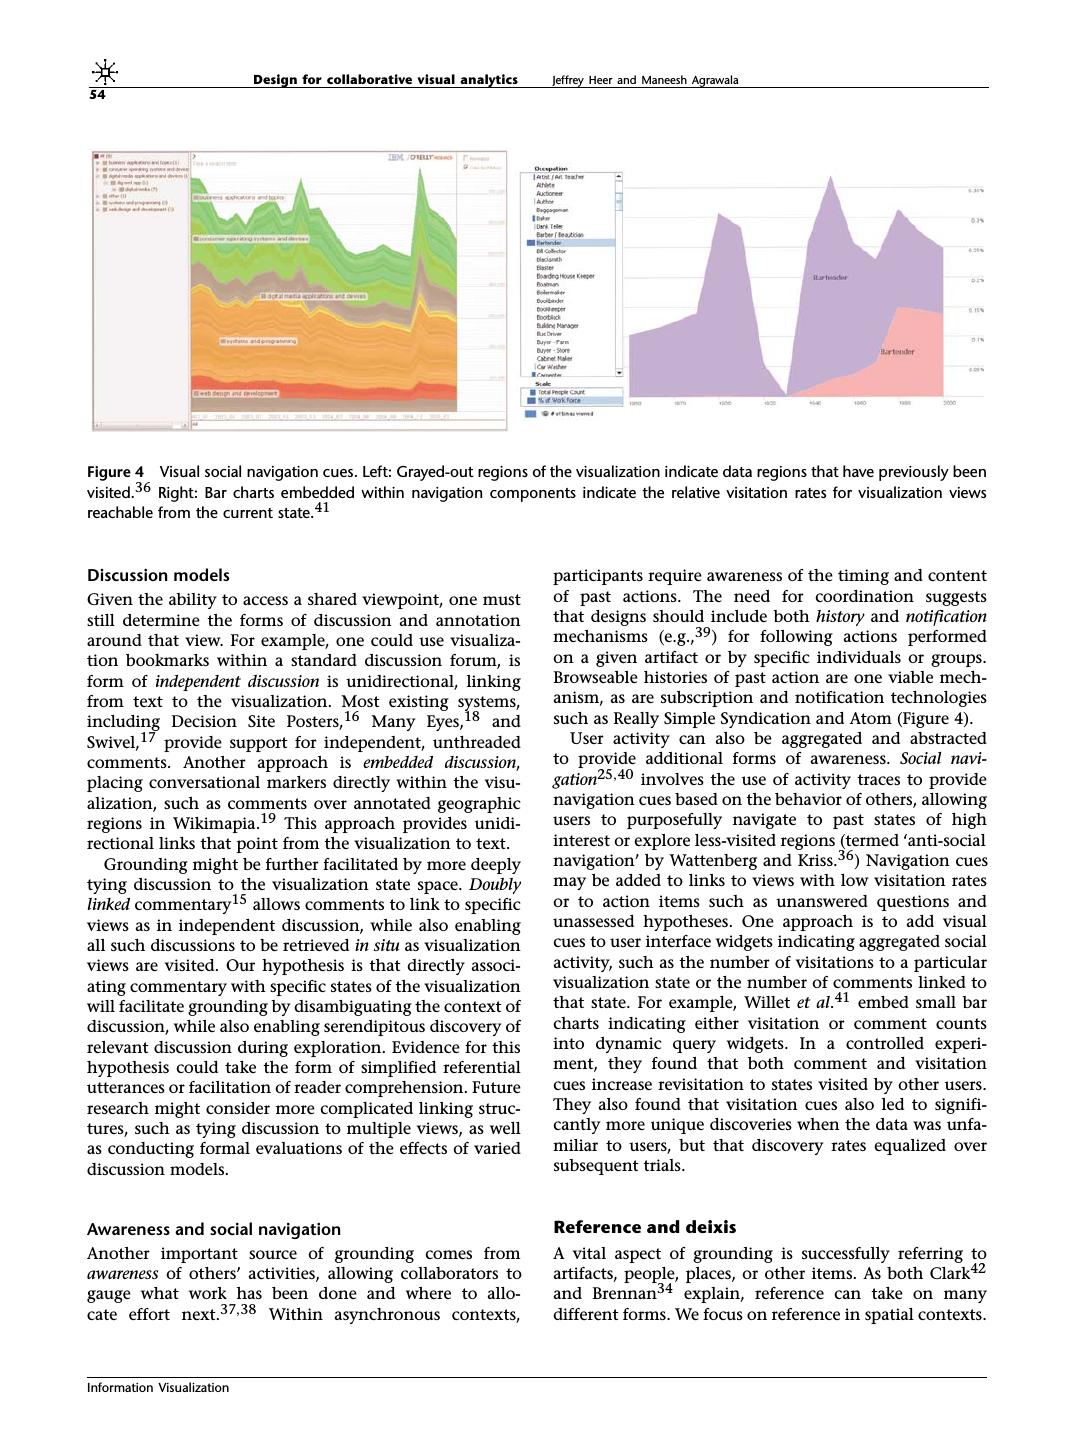
6 . Design for collaborative visual analytics Jeffrey Heer and Maneesh Agrawala 54 Figure 4 Visual social navigation cues. Left: Grayed-out regions of the visualization indicate data regions that have previously been visited.36 Right: Bar charts embedded within navigation components indicate the relative visitation rates for visualization views reachable from the current state.41 Discussion models participants require awareness of the timing and content Given the ability to access a shared viewpoint, one must of past actions. The need for coordination suggests still determine the forms of discussion and annotation that designs should include both history and notification around that view. For example, one could use visualiza- mechanisms (e.g.,39 ) for following actions performed tion bookmarks within a standard discussion forum, is on a given artifact or by specific individuals or groups. form of independent discussion is unidirectional, linking Browseable histories of past action are one viable mech- from text to the visualization. Most existing systems, anism, as are subscription and notification technologies including Decision Site Posters,16 Many Eyes,18 and such as Really Simple Syndication and Atom (Figure 4). Swivel,17 provide support for independent, unthreaded User activity can also be aggregated and abstracted comments. Another approach is embedded discussion, to provide additional forms of awareness. Social navi- placing conversational markers directly within the visu- gation25,40 involves the use of activity traces to provide alization, such as comments over annotated geographic navigation cues based on the behavior of others, allowing regions in Wikimapia.19 This approach provides unidi- users to purposefully navigate to past states of high rectional links that point from the visualization to text. interest or explore less-visited regions (termed ‘anti-social Grounding might be further facilitated by more deeply navigation’ by Wattenberg and Kriss.36 ) Navigation cues tying discussion to the visualization state space. Doubly may be added to links to views with low visitation rates linked commentary15 allows comments to link to specific or to action items such as unanswered questions and views as in independent discussion, while also enabling unassessed hypotheses. One approach is to add visual all such discussions to be retrieved in situ as visualization cues to user interface widgets indicating aggregated social views are visited. Our hypothesis is that directly associ- activity, such as the number of visitations to a particular ating commentary with specific states of the visualization visualization state or the number of comments linked to will facilitate grounding by disambiguating the context of that state. For example, Willet et al.41 embed small bar discussion, while also enabling serendipitous discovery of charts indicating either visitation or comment counts relevant discussion during exploration. Evidence for this into dynamic query widgets. In a controlled experi- hypothesis could take the form of simplified referential ment, they found that both comment and visitation utterances or facilitation of reader comprehension. Future cues increase revisitation to states visited by other users. research might consider more complicated linking struc- They also found that visitation cues also led to signifi- tures, such as tying discussion to multiple views, as well cantly more unique discoveries when the data was unfa- as conducting formal evaluations of the effects of varied miliar to users, but that discovery rates equalized over discussion models. subsequent trials. Awareness and social navigation Reference and deixis Another important source of grounding comes from A vital aspect of grounding is successfully referring to awareness of others’ activities, allowing collaborators to artifacts, people, places, or other items. As both Clark42 gauge what work has been done and where to allo- and Brennan34 explain, reference can take on many cate effort next.37,38 Within asynchronous contexts, different forms. We focus on reference in spatial contexts. Information Visualization
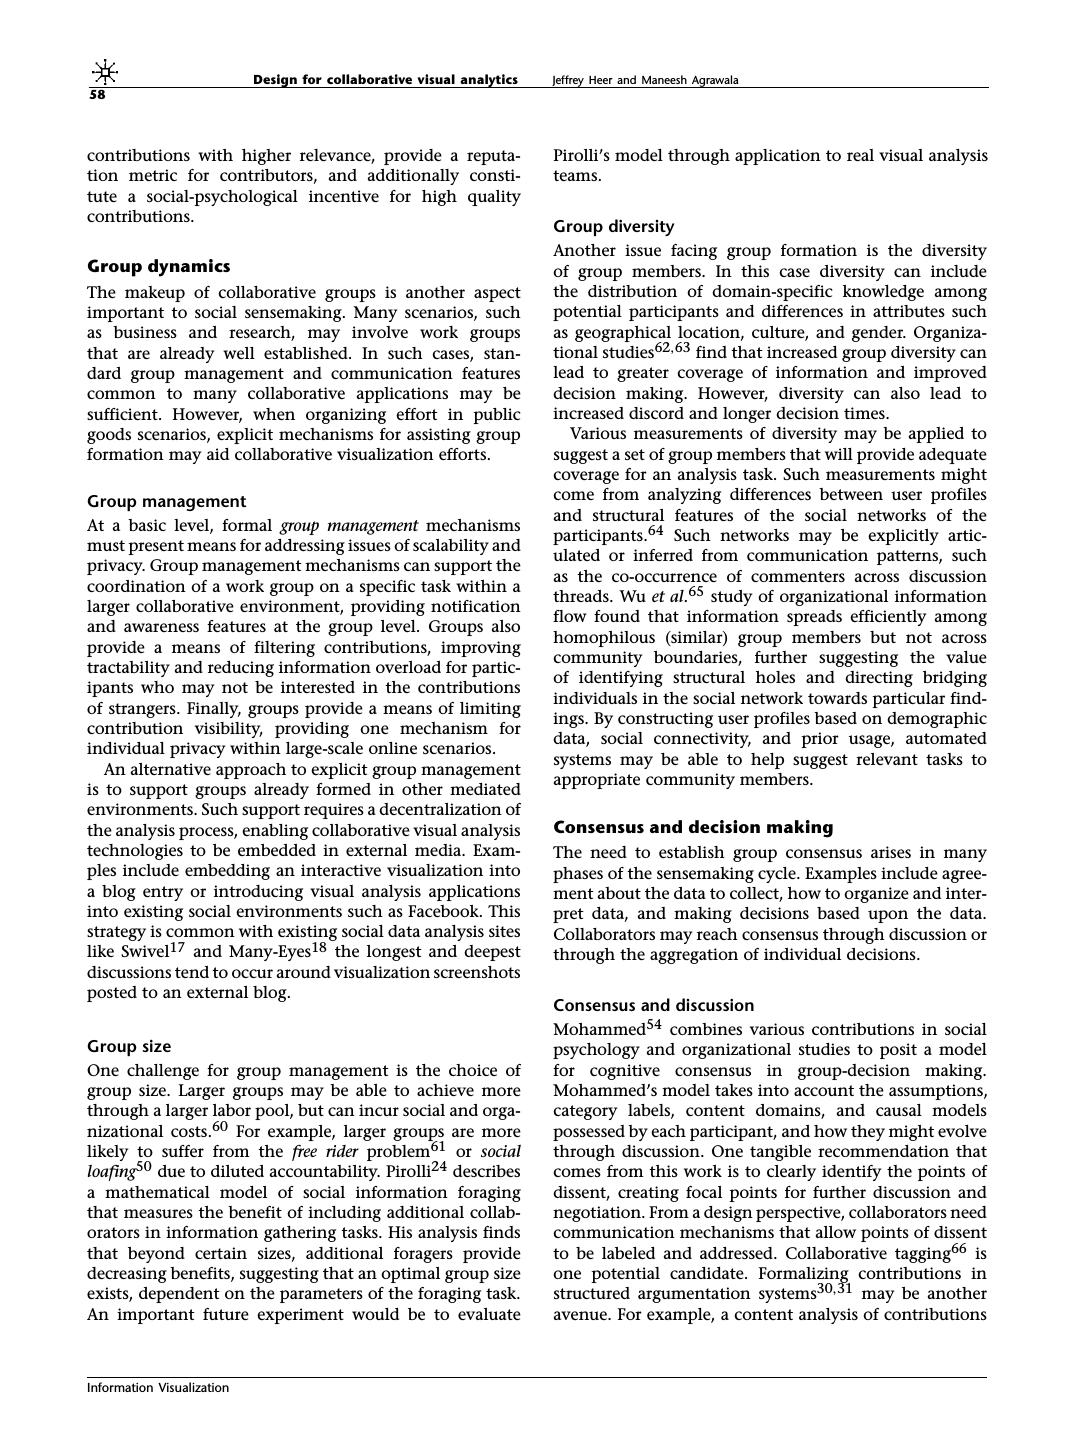
7 . Design for collaborative visual analytics Jeffrey Heer and Maneesh Agrawala 55 When collaborating around visual media, it is common Brushing-based forms of pointing have the advan- to refer to specific objects, groups, or regions visible to tage that the pointing action is tied directly to the data, participants. Such references may be general (‘north by whether modeled as a vector of selected tuples, a declar- northwest’), definite (named entities), detailed (described ative query, or both. ‘Data-aware’ representations allow by attributes, such as the ‘blue ball’), or deictic (pointing a pointing intention to be reapplied in different views to an object and saying ‘that one’, also referred to as index- of the same data, enabling reuse of references across ical reference). Once the referent has been successfully different choices of visual encodings. Data-aware annota- established and grounding has been achieved between tions could also enable users to search for all commentary participants, collaboration can move forward. or visualizations that reference a particular data item. Clark42 surveys various forms of spatial indexical refer- As data-aware annotations are machine-readable, they ence, grouping them into the categories of pointing and might also be used to export subsets of data and help placing. Pointing behaviors use some form of vectorial steer automated data mining (e.g.,47 ). Finally, machine- reference to direct attention to an object, group, or region readable selections might be used as input for achieving of interest, such as pointing a finger or directing one’s more generalized forms of reference. For example, one gaze. Placing behaviors involve moving an object to a might deictically refer to a particular object, but formu- region of space that has a shared, conventional meaning. late a broader selection by abstracting from the properties Examples include placing groceries on a counter to indi- of that object (e.g., ‘select all items blue like this one’). In cate items for purchase and standing across from the teller this way, other forms of reference might be achieved in to indicate that you will be the purchaser. In addition to both human and machine readable form. directing attention, indexical reference allows patterns of speech and text to change. Participants can use deictic terms like ‘that’ and ‘there’ to invoke indexical referents, Graphical annotation simplifying the production of utterances along the prin- Freeform graphical annotations15 can provide an expres- ciple of least collaborative effort. sive form of pointing. Drawing a circle around a cluster of Hill and Hollan43 further discuss the various roles that items or pointing an arrow at a peak in a graph can direct deictic pointing gestures can play, often communicating the attention of remote viewers. The angle of the arrow intents more complicated than simply ‘look here.’ They or shape of the hand-drawn circle may communicate describe how different hand gestures can communi- emotional cues or add emphasis. Although such drawing cate angle (oriented flat hand), height (horizontal flat and vector graphic annotations allow a high degree of hand), intervals (thumb and index finger in ‘C’ shape), expression, without any explicit tie to the underlying groupings (lasso’ing a region), and forces (accelerating data they only apply to a single view in the visualiza- fist). While other forms of reference are often achieved tion. Freeform annotations can persist over purely visual through speech or written text, deictic reference in transformations such as panning and zooming, but if particular offers important interface design challenges they are not data-aware they may become meaningless for collaborative visualization. Our hypothesis is that in the face of data-oriented operations such as filtering methods for performing nuanced pointing behaviors can or drill-down. One future research direction is to develop improve collaboration by favorably altering its cost struc- hybrid approaches that combine aspects of both brushing ture. Hill and Hollan make this claim explicitly, arguing and graphical annotation. The resulting techniques could for ‘generally applicable techniques that realize complex create graphical annotations that are tied to data points pointing intentions’ by engaging ‘pre-attentive vision in so that they can be displayed in other views of the data the service of cognitive tasks.’ and remain meaningful (Figure 5). Brushing and dynamic queries Ambiguity of reference A standard way to point in a visualization is through An additional concern is ambiguity of reference. Clark brushing44,45 and dynamic queries46 selecting and high- et al.48 demonstrate how people’s common ground can lighting a subset of the data through direct manipulation affect ambiguity resolution: two people with greater famil- of the display or auxiliary query controls. Naturally, iarity might successfully communicate using ambiguous these selections should be sharable as part of the state of references, while a third participant remains confused. the visualization. In addition, a palette of visual effects Asynchronous collaboration may be more susceptible richer than simple filtering and highlighting can let to ambiguities than synchronous collaboration because users communicate different intents. For example, a user participants do not receive immediate feedback or selecting a range of values in a chart might have one of grounding cues from other collaborators. As a result, any number of intents. If the user is interested in the designers of pointing interactions must also consider specific points selected, those points should be promi- the ease with which pointing actions can be interpreted nently highlighted. However, if the user is primarily unambiguously. The implicit interplay between gesture interested in the range of the contained values, the range and text, often fluidly performed and subconsciously interval should be given visual prominence. interpreted in synchronous interactions, may need to Information Visualization
8 . Design for collaborative visual analytics Jeffrey Heer and Maneesh Agrawala 56 Figure 5 Annotation and selection in visualizations. Left: Brushing and dynamic query techniques enable forms of pointing and selection tied to the underlying data. Right: Freeform graphical annotation enables a greater range of expressiveness.15 be linked more concretely in asynchronous settings. selecting data sets or designing the presentation such that For example, a text comment involving multiple deictic the data is personally relevant, usage rates will rise due terms may need to link those terms explicitly to visual to increased hedonic incentive. For example, geographic annotations, as the gestural cues used in face-to-face visualizations may facilitate navigation to personally rele- communication are not available for disambiguation. vant locations through typing in zip codes or city names, while a visualization of the United States’ budget might communicate how a specific user’s taxes were allocated Incentives and engagement rather than only listing total dollar amounts. If collaborators are professionals working within a partic- ular context (e.g., financial analysts or research scien- Social-psychological incentives tists) there may be existing incentives, both financial In the case of social-psychological incentives, the visi- and professional, for conducting collaborative work. In a bility of contributions can be manipulated for social public goods scenario, incentives such as social visibility effects. Ling et al.50 found that users contributed more or sense of contribution may be motivating factors. Incor- if reminded of the uniqueness of their contribution or porating incentives into the design process may increase if given specific challenges. In one experiment, Ling the level of contribution, and could provide additional et al. also found that participants contributed more when motivation in those situations that already have estab- given group goals than when given individual goals, a lished incentive systems. finding at odds with existing social-psychological theory. Benkler20 posits an incentive structure for collabora- Cheshire51 ran a controlled experiment finding that, tive work consisting of monetary incentives, hedonic even in small doses, positive social feedback on a contri- incentives, and social-psychological incentives. Monetary bution greatly increases contributions. He also found incentives refer to material compensation such as a salary that visibility of high levels of cooperative behavior or cash reward. Hedonic incentives refer to well-being or across the community increases contributions in the engagement experienced intrinsically in the work. Social- short term, but has only moderate impact in the long psychological incentives involve perceived benefits such term. These studies suggest that social-psychological as increased status or social capital. incentives can improve contribution rates, but that the improvements depend on the forms of social visibility. One incentive for visual analysis may be to prominently Personal relevance display new discoveries or successful responses to open A number of observations of social use of visualization questions. Mechanisms for positive feedback, such as have noted that visualization users are attracted to data voting for interesting comments, might also foster more that they find personally relevant.49,13,36 For example, contributions. in collaborative visual analysis of the occupations of American workers,15 people often start by searching for their own profession and those of their friends and family, Game play similar to the way people search for names in the popular Finally, it is worth considering game play as an addi- NameVoyager visualization.36 The hypothesis is that by tional framework for increasing incentives. For example, Information Visualization
9 . Design for collaborative visual analytics Jeffrey Heer and Maneesh Agrawala 57 von Ahn’s ‘games with a purpose’27 reframe otherwise require longer time spans to develop. These diminished tedious data entry tasks as actions within online games, cues allow for a greater role of imagination and specula- successfully leveraging game dynamics to engage users in tion when assessing another person. Furthermore, many the construction of information goods. Heer49 discusses researchers find that such diminished cues give rise to various examples in which playful activity contributes ‘deindividuation’ effects that have both desirable and to visual analysis, applying insights from an existing undesirable consequences. For example, people who are theory of playful behavior52 that analyzes the compet- shy in face-to-face interactions often show greater rates itive, visceral, and teamwork building aspects of play. of participation, but anti-social ‘flaming’ is also more For example, scoring mechanisms create competitive prevalent online.57,58 social-psychological incentives. Game design might also When considering the implications of identity assess- be used to allocate attention. For example, creating ment for collaborative visualization systems, designers a team-oriented ‘scavenger hunt’ analysis game could should also take the context of deployment into account. focus participants on a particular subject matter. Salen If collaborators are already familiar to each other, they and Zimmerman53 provide a thorough resource for the may require little additional support to make assessments further study of game design concepts. of identity and reputation, instead of relying on existing channels through which assessments can be made. It may be enough to simply identify collaborators’ individual Identity, trust, and reputation contributions with recognizable names. Still, it may prove Aspects of identity, reputation, and trust all influence valuable for visual analysis environments to interface the way people interact with each other. Within a sense- with external communication channels, both for sharing making context, interpersonal assessments affect how and interpersonal assessment. Many organizations main- people value, consider, and respond to the individual tain online personnel directories to aid awareness and contributions of others. Other things being equal, a collaboration; visual analysis systems should be able to hypothesis suggested by a more trusted or reputable leverage such existing artifacts. person will have a higher probability of being accepted On the other hand, if collaborators begin as strangers, as part of the group consensus.54 For social sensemaking mechanisms for self-presentation and reputation forma- in a computer-mediated environment, design challenges tion need to be included in the system design. Possible accrue around the various markers of identity and past mechanisms include identity markers, such as screen action that might be transmitted through the system. For names, demographic profiles, social networks, and group example, Donath55 describes how even a cue as simple as memberships. Considerations include the type of personal one’s e-mail address can lead to a number of inferences information germane to the context of visual analysis; about identity and status. for example, is a playful or professional environment desired? Attributes such as age, geographic location, inter- ests, and skills might help assess a collaborator’s back- Identity presentation ground knowledge, affecting the confidence one places Many theorists try to understand interpersonal percep- in hypotheses. Of course, this picture is complicated if tion via the signals available for interpretation by others. such measures are self-reported, because such self-reports Goffman56 distinguishes between expressions given and may be subject to fabrication. expressions given off to indicate those parts of our presen- tation of self that are consciously planned (e.g., the content of our speech) or unconsciously generated (e.g., a Reputation formation wavering of voice indicating nervousness), each of which Considering how interpersonal assessment develops over is interpreted to form opinions of a person. Donath55 time gives rise to questions of reputation and trust forma- classifies such signals into conventional signals – low-cost tion. In the case where participants only interact through signals that are easy to fake (e.g., talking about going the system itself, means of gauging a user’s past actions to the gym) – and assessment signals – more reliable or contributions are needed not only to aid awareness signals that are difficult to fabricate (e.g., having large (c.f. section on common ground and awareness) but also muscles). to facilitate reputation formation. Observations of past Other researchers have focused on the way media with actions provide implicit means of reputation formation, different capacities for transmitting such signals affect allowing collaborators to make inter-personal judgments interpersonal assessment. For example, most computer- grounded in past activity. One challenge for design is to mediated communication filters out non-verbal cues, consider what pieces of information are most informative stripping many of the signals ‘given off’ by participants. for reputation formation. Despite these missing cues, Walther57 argues that online Some systems instead provide explicit reputation mech- relationships can be as deep and meaningful as face-to- anisms, such as seller ratings in online markets such as face interactions through explicit sharing of personal eBay.59 In a visual analysis environment, collaborators information. However, due to diminished cues and asyn- might rate each other’s contributions according to their chronous interaction, such online relationships can interestingness or accuracy. Such ratings may help surface Information Visualization
10 . Design for collaborative visual analytics Jeffrey Heer and Maneesh Agrawala 58 contributions with higher relevance, provide a reputa- Pirolli’s model through application to real visual analysis tion metric for contributors, and additionally consti- teams. tute a social-psychological incentive for high quality contributions. Group diversity Another issue facing group formation is the diversity Group dynamics of group members. In this case diversity can include The makeup of collaborative groups is another aspect the distribution of domain-specific knowledge among important to social sensemaking. Many scenarios, such potential participants and differences in attributes such as business and research, may involve work groups as geographical location, culture, and gender. Organiza- that are already well established. In such cases, stan- tional studies62,63 find that increased group diversity can dard group management and communication features lead to greater coverage of information and improved common to many collaborative applications may be decision making. However, diversity can also lead to sufficient. However, when organizing effort in public increased discord and longer decision times. goods scenarios, explicit mechanisms for assisting group Various measurements of diversity may be applied to formation may aid collaborative visualization efforts. suggest a set of group members that will provide adequate coverage for an analysis task. Such measurements might Group management come from analyzing differences between user profiles and structural features of the social networks of the At a basic level, formal group management mechanisms participants.64 Such networks may be explicitly artic- must present means for addressing issues of scalability and ulated or inferred from communication patterns, such privacy. Group management mechanisms can support the as the co-occurrence of commenters across discussion coordination of a work group on a specific task within a threads. Wu et al.65 study of organizational information larger collaborative environment, providing notification flow found that information spreads efficiently among and awareness features at the group level. Groups also homophilous (similar) group members but not across provide a means of filtering contributions, improving community boundaries, further suggesting the value tractability and reducing information overload for partic- of identifying structural holes and directing bridging ipants who may not be interested in the contributions individuals in the social network towards particular find- of strangers. Finally, groups provide a means of limiting ings. By constructing user profiles based on demographic contribution visibility, providing one mechanism for data, social connectivity, and prior usage, automated individual privacy within large-scale online scenarios. systems may be able to help suggest relevant tasks to An alternative approach to explicit group management appropriate community members. is to support groups already formed in other mediated environments. Such support requires a decentralization of the analysis process, enabling collaborative visual analysis Consensus and decision making technologies to be embedded in external media. Exam- The need to establish group consensus arises in many ples include embedding an interactive visualization into phases of the sensemaking cycle. Examples include agree- a blog entry or introducing visual analysis applications ment about the data to collect, how to organize and inter- into existing social environments such as Facebook. This pret data, and making decisions based upon the data. strategy is common with existing social data analysis sites Collaborators may reach consensus through discussion or like Swivel17 and Many-Eyes18 the longest and deepest through the aggregation of individual decisions. discussions tend to occur around visualization screenshots posted to an external blog. Consensus and discussion Mohammed54 combines various contributions in social Group size psychology and organizational studies to posit a model One challenge for group management is the choice of for cognitive consensus in group-decision making. group size. Larger groups may be able to achieve more Mohammed’s model takes into account the assumptions, through a larger labor pool, but can incur social and orga- category labels, content domains, and causal models nizational costs.60 For example, larger groups are more possessed by each participant, and how they might evolve likely to suffer from the free rider problem61 or social through discussion. One tangible recommendation that loafing50 due to diluted accountability. Pirolli24 describes comes from this work is to clearly identify the points of a mathematical model of social information foraging dissent, creating focal points for further discussion and that measures the benefit of including additional collab- negotiation. From a design perspective, collaborators need orators in information gathering tasks. His analysis finds communication mechanisms that allow points of dissent that beyond certain sizes, additional foragers provide to be labeled and addressed. Collaborative tagging66 is decreasing benefits, suggesting that an optimal group size one potential candidate. Formalizing contributions in exists, dependent on the parameters of the foraging task. structured argumentation systems30,31 may be another An important future experiment would be to evaluate avenue. For example, a content analysis of contributions Information Visualization
11 . Design for collaborative visual analytics Jeffrey Heer and Maneesh Agrawala 59 to the sense.us system15 found that users primarily used opinions that can be surveyed prior to decision-making free-text comments to post observations, questions, and and discussion. hypotheses. These categories could be formally repre- sented to help structure discussion and voting. Scheff67 notes that consensus requires more than Presentation and story-telling participants simply sharing a belief; participants must Common forms of information exchange in group think that their beliefs are the same, and achieve realiza- sensemaking are reports and presentations. Narrative tion that others understand one’s position. Users need presentation of analysis ‘stories’ is a natural and often feedback loops to gauge mutual understanding. Along effective way to communicate analytic findings, and is a these lines, it may be useful to consider the effects of primary use of Spotfire Decision Site Posters.16 Further- multiple communication channels on decision processes. more, users of Swivel,17 sense.us,15 and Many Eyes,18 Collaborative visualization environments that provide all use external media such as blogs and social book- messaging, in either synchronous or asynchronous marking services as external communication channels forms, might provide backchannels for negotiation in which to share and discuss findings from visualiza- and non-public discussion. The integration of instant tions. The challenge to collaborative visualization is to messaging into the GMail e-mail service is an example of provide mechanisms to aid the creation and distribution weaving different communication channels into a single of presentations. For example, sense.us15 allows users to system. construct and share trails of saved views and can thus The value of different forms of consensus can vary based provide tours spanning multiple visualizations. GeoTime on the task at hand. Hastie68 found that group discussion Stories72 supports textual story-telling with hyperlinks improved accuracy when decision tasks had demonstrably to visualization states and annotations. However, neither correct solutions because groups could evaluate their system yet allows these stories to be exported outside output. When task outcomes are open-ended, consensus the respective applications. In future work, such mecha- through discussion is harder to evaluate. In a simulated nisms could be improved with support to build presen- graduate admissions task, Gigone and Hastie69 found tations semi-automatically from interaction histories, little value in discussion, as group decisions were well- apply pointing and annotation techniques, and embed matched by simply averaging prior individual decisions. the resulting presentations in external media. Viewers of One design implication that again arises is to use voting analysis stories may also find value in conducting follow- or ranking systems. Mechanisms for expressing support up analysis and verification on parts of the story, enabling or disdain for hypotheses could aid data interpretation presentations to serve as a catalyst for additional analysis. and further identify controversial points. For example, Wikimapia19 users can vote on the accuracy of labeled geographic regions and Swivel17 supports ratings of inter- Conclusion and future directions estingness. A game-like variation on this approach is the This article presents design considerations for collabora- creation of prediction markets70 individuals can be given tive visual analytics, attempting to identify the aspects a limited amount of ‘points’ or ‘currency’ that they can underlying successful collaboration and suggest mech- use to vote for hypotheses they find most promising. anisms for achieving them. Highlights include a list of Hypotheses that are later validated could reap payback collaborative visualization tasks, techniques to improve rewards for their supporters. shared context and awareness, and suggestions for increasing engagement and allocating effort. Many of these considerations are summarized in Table 1. The Information distribution overarching goal is to design socio-technical systems An important dimension of group consensus is the that improve our analytic capabilities by promoting an distribution of information across group members. Both effective division of labor among participants, facilitating Stasser71 and Gigone and Hastie69 find that it is difficult mutual understanding, and reducing the costs associated for groups to pool information effectively, and therefore, with collaborative tasks. decision-making is biased in the direction of the initial Visiting these considerations also provides an agenda information distribution. They hypothesize that the lack for future research in collaborative visual analytics, of effective pooling may be due to the persistence of surfacing hypotheses in need of study and suggesting individual decisions made prior to discussion or to infor- new technical mechanisms. For example: mation shared prior to the group meeting. The prior decisions and information set a common ground for • What is the effect of different discussion models (e.g., discussion and bias conversation against the unshared independent, embedded, and doubly linked) on partic- information. Thus, improving collective information ipation and the establishment of common ground? foraging may help inform group decision-making by • Beyond textual discussion, what external representa- changing the information distribution. Collaborative tions will effectively support collaborative analysis? analysis environments may facilitate better informa- How do such artifacts affect grounding and the cost of tion pooling by providing a record of findings and integration? Information Visualization
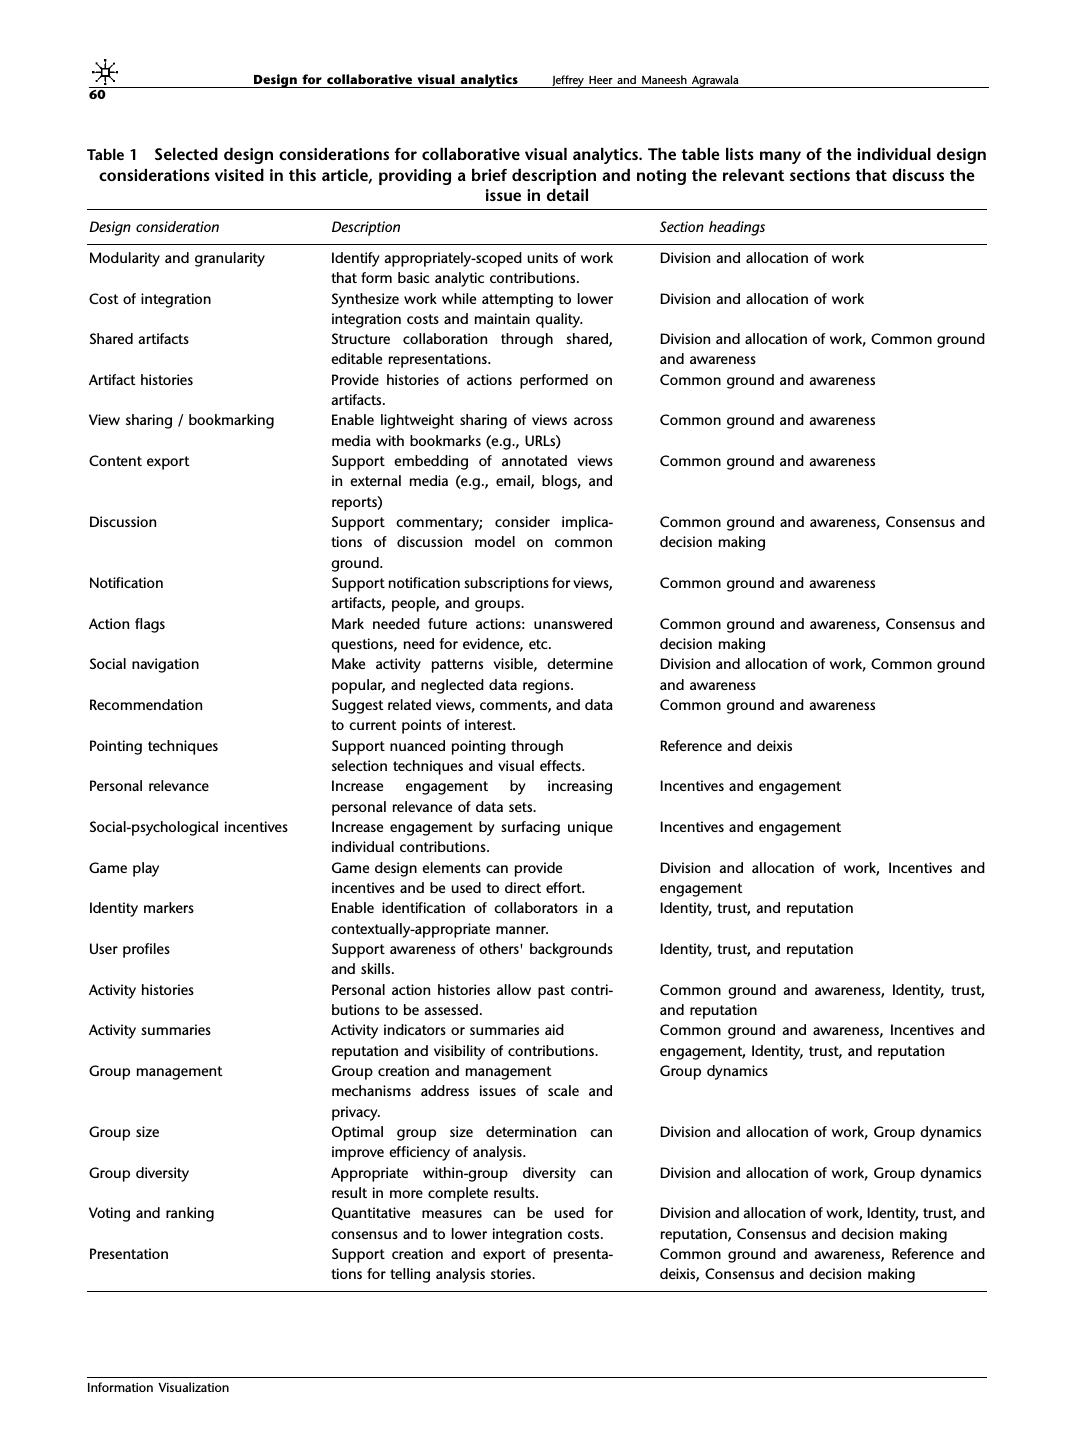
12 . Design for collaborative visual analytics Jeffrey Heer and Maneesh Agrawala 60 Table 1 Selected design considerations for collaborative visual analytics. The table lists many of the individual design considerations visited in this article, providing a brief description and noting the relevant sections that discuss the issue in detail Design consideration Description Section headings Modularity and granularity Identify appropriately-scoped units of work Division and allocation of work that form basic analytic contributions. Cost of integration Synthesize work while attempting to lower Division and allocation of work integration costs and maintain quality. Shared artifacts Structure collaboration through shared, Division and allocation of work, Common ground editable representations. and awareness Artifact histories Provide histories of actions performed on Common ground and awareness artifacts. View sharing / bookmarking Enable lightweight sharing of views across Common ground and awareness media with bookmarks (e.g., URLs) Content export Support embedding of annotated views Common ground and awareness in external media (e.g., email, blogs, and reports) Discussion Support commentary; consider implica- Common ground and awareness, Consensus and tions of discussion model on common decision making ground. Notification Support notification subscriptions for views, Common ground and awareness artifacts, people, and groups. Action flags Mark needed future actions: unanswered Common ground and awareness, Consensus and questions, need for evidence, etc. decision making Social navigation Make activity patterns visible, determine Division and allocation of work, Common ground popular, and neglected data regions. and awareness Recommendation Suggest related views, comments, and data Common ground and awareness to current points of interest. Pointing techniques Support nuanced pointing through Reference and deixis selection techniques and visual effects. Personal relevance Increase engagement by increasing Incentives and engagement personal relevance of data sets. Social-psychological incentives Increase engagement by surfacing unique Incentives and engagement individual contributions. Game play Game design elements can provide Division and allocation of work, Incentives and incentives and be used to direct effort. engagement Identity markers Enable identification of collaborators in a Identity, trust, and reputation contextually-appropriate manner. User profiles Support awareness of others' backgrounds Identity, trust, and reputation and skills. Activity histories Personal action histories allow past contri- Common ground and awareness, Identity, trust, butions to be assessed. and reputation Activity summaries Activity indicators or summaries aid Common ground and awareness, Incentives and reputation and visibility of contributions. engagement, Identity, trust, and reputation Group management Group creation and management Group dynamics mechanisms address issues of scale and privacy. Group size Optimal group size determination can Division and allocation of work, Group dynamics improve efficiency of analysis. Group diversity Appropriate within-group diversity can Division and allocation of work, Group dynamics result in more complete results. Voting and ranking Quantitative measures can be used for Division and allocation of work, Identity, trust, and consensus and to lower integration costs. reputation, Consensus and decision making Presentation Support creation and export of presenta- Common ground and awareness, Reference and tions for telling analysis stories. deixis, Consensus and decision making Information Visualization
13 . Design for collaborative visual analytics Jeffrey Heer and Maneesh Agrawala 61 • How can the synthesis of individual contributions be 2 Pirolli P, Card SK. The sensemaking process and leverage points for improved? Can (semi-)automatic summarization or analyst technology as identified through cognitive task analysis. Proceedings of International Conference on Intelligence Analysis merging of separately developed data views (e.g.,29 ) be (McLean, VA) MITRE: 2005. used to form aggregated contributions? 3 Thomas JJ, Cook, KA (Eds). Illuminating the Path: The Research • How should selection and visual emphasis techniques and Development Agenda for Visual Analytics. IEEE Press: New York, be designed to provide nuanced pointing behaviors? 2005. 4 Dorling D, Barford A, Newman A. Worldmapper: The world as Can referenced objects be unambiguously recognized by you’ve never seen it before. IEEE Transactions on Visualization and both human and machine collaborators? Computer Graphics 2006; 12: 757–764. • How can pointing and graphical annotation gracefully 5 Dietz PH, Leigh DL. DiamondTouch: a multi-user touch handle dynamic visualizations and changing data sets? technology, ACM Symposium on User Interface Software and Technology (Orlando, FL) ACM: New York, NY, 2001; 219–226. • How should social navigation cues be effectively added 6 General Dynamics. Command post of the future. [WWW to visual analysis tools to unobtrusively improve aware- document] http://www.gdc4s.com/content/detail.cfm?item = ness? 2a58f8e2-ef2b-4bb1-9251-42ee4961dd7f (accessed 28 November • Can automated techniques be used to help allocate 2007). 7 Agrawala M, Beers A, Froehlich B, Hanrahan P, MacDowall P, Bolas effort? For example, mining past contributions, user M. The two-user responsive workbench: support for collaboration profiles, and inferred social networks may enable through individual views of a shared space. ACM Conference on systems to direct collaborators to tasks in need of atten- Computer Graphics and Interactive Techniques (SIGGRAPH’97) (Los tion. Angeles, CA) ACM: New York, NY, 1997; 27–332. 8 Anupam V, Bajaj CL, Schikore D, Schikore M. Distributed and • How can the fruits of collaborative visual analysis be collaborative visualization. IEEE Computer 1994; 27: 37–43. more effectively exported, shared, and embedded in 9 Brodlie KW, Duce DA, Gallop JR, Walton JPRB, Wood JD. external media such as web pages, e-mail, and presen- Distributed and collaborative visualization. Computer Graphics tations? Forum 2004; 23: 223–251. 10 Chuah MC, Roth S. Visualizing common ground. Information Visualization (IV) (London, UK) IEEE Computer Society: To answer these questions, we envision future research Washington, DC, 2003; 365–372. projects of varying scopes. Researchers may focus on new 11 Benko H, Ishak EW, Feiner S. Collaborative mixed reality visualization and interaction techniques for supporting visualization of an archaeological excavation. IEEE International collaboration. Such research should propose novel mech- Symposium on Mixed and Augmented Reality (ISMAR 2004) (Arlington, VA) IEEE Computer Society: Washington, DC, 2004; anisms and ideally evaluate them through comparative 132–140. study with other approaches. As listed above, novel 12 Chui Y-P, Heng P-A. Enhancing view consistency in collaborative discussion models, pointing techniques, and story-telling medical visualization systems using predictive-based attitude interfaces are all candidates. Research into targeted tech- estimation. First IEEE International Workshop on Medical Imaging and Augmented Reality (MIAR ’01) (Hong Kong) IEEE Computer niques needs to be balanced with the design, deployment, Society: Washington, DC, 2001; 292. and evaluation of holistic collaborative visual analysis 13 Viégas FB, Wattenberg M. Communication-minded visualization: environments. Such systems should enable real-world a call to action. IBM Systems Journal 2006; 45: 801–812. groups to conduct collaborative visual analysis. Studies 14 Benbunan-Fich R, Hiltz SR, Turoff M. A comparative content analysis of face-to-face vs. asynchronous group decision making. of system usage can then measure the benefits of collab- Decision Support Systems Archive 2003; 34: 457–469. orative visual analytics in ecologically valid settings and 15 Heer J, Viégas F, Wattenberg M. Voyagers and voyeurs: supporting inform best practices for combining collaboration mecha- asynchronous collaborative information visualization. ACM nisms. A number of important experiments, such as those Conference on Human Factors in Computing Systems (CHI’07) (San Jose, CA) ACM: New York, NY, 2007. involving group management and incentives, may be 16 Spotfire Decision Site Posters. [WWW document] http:// best conducted in real-world settings (e.g., Ling et al.,50 spotfire.com/products/decisionsite_posters.cfm (accessed 28 Resnick et al.59 and Wu et al.65 ) and interfacing with November 2007). the Internet is critical to understanding how findings are 17 Swivel. [WWW document] http://www.swivel.com (accessed 28 November 2007). disseminated and how collaborative visual analytics can 18 Viégas FB, Wattenberg M, van Ham F, Kriss J, McKeon M. Many be more deeply weaved into the Web. These and other eyes: a site for visualization at internet scale. IEEE Transactions challenges present exciting opportunities for advancing on Visualization and Computer Graphics (InfoVis’07) 2007; 13: visual analytics research. 1121–1128. 19 Wikimapia. [WWW document] http://wikimapia.org (accessed 28 November 2007). 20 Benkler Y. Coase’s penguin, or, Linux and The Nature of the Firm. Acknowledgments Yale Law Journal 2002; 112: 369–446. We thank Martin Wattenberg, Fernanda Viégas, Stu Card, 21 Card SK, Mackinlay JD, Shneiderman B. Readings in Information Coye Cheshire, and Andrew Fiore for their insightful Visualization: Using Vision To Think. Morgan-Kaufmann: San Francisco, CA, 1999. comments. 22 Heer J, Agrawala M. Software design patterns for information visualization. IEEE Transactions on Visualization and Computer Graphics 2006; 12: 853–860. 23 Russell DM, Stefik MJ, Pirolli P, Card SK. The cost structure of References sensemaking. ACM Conference on Human Factors in Computing 1 Pirolli P, Card SK. Information foraging. Psychological Review 1999; Systems (CHI’93) (Amsterdam, Netherlands) ACM: New York, NY, 106: 643–675. 1993. Information Visualization
14 . Design for collaborative visual analytics Jeffrey Heer and Maneesh Agrawala 62 24 Pirolli P. Social information foraging. Information Foraging: Conference on Human Factors in Computing Systems (CHI’94) Adaptive Interaction with Information, Chapter 8. Oxford University (Boston, MA) ACM: New York, NY, 1994; 313–317. Press: Oxford, 2007. 47 Yang D, Rundensteiner EA, Ward MO. Analysis guided visual 25 Dourish M, Chalmers M. Running out of space: models of exploration to multivariate data. IEEE Symposium on Visual information navigation. Human Computer Interaction (HCI’94) Analytics Science and Technology (Sacramento, CA) IEEE Computer (Glasgow, UK) Cambridge University Press: Cambridge, UK, 1994. Society, Washington, DC, 2007. 26 Zhang J, Norman DA. Representations in distributed cognitive 48 Clark HH, Schreuder R, Buttrick S. Common ground and the tasks. Cognitive Science 1994; 18: 87–122. understanding of demonstrative reference. Journal of Verbal 27 von Ahn L. Games with a purpose. IEEE Computer 2006; 39: Learning and Verbal Behavior 1983; 22: 245–258. 92–94. 49 Heer J. Socializing visualization. CHI 2006 Workshop on Social 28 Wright W, Schroh D, Proulx P, Skaburskis A, Cort B. The sandbox Visualization (Montreal, Quebec) ACM: New York, NY, 2006. for analysis: concepts and evaluation. ACM Conference on Human 50 Ling K, Beenen G, Ludford P, Wang X, Chang K, Cosley Factors in Computing Systems (CHI’06) (Montreal, Quebec) ACM: D, Frankowski D, Terveen L, Rashid AM, Resnick P, Kraut New York, NY, 2006. R. Using social psychology to motivate contributions to 29 Brennan SE, Mueller K, Zelinsky G, Ramakrishnan IV, Warren DS, online communities. Journal of Computer-Mediated Communication Kaufman A. Toward a multi-analyst, collaborative framework for 2005; 10 (http://jcmc.indiana.edu/). visual analytics. IEEE Symposium of Visual Analytics Science and 51 Cheshire C. Selective Incentives and Generalized Information Technology (Baltimore, MD) IEEE Computer Society: Washington, Exchange. Social Psychology Quarterly 2007; 70: 82–100. DC, 2006. 52 Caillois R. Man, Play, and Games. Free Press of Glencoe: Glencoe, 30 Billman D, Convertino G, Shrager J, Pirolli P, Massar J. IL,1961. Collaborative intelligence analysis with CACHE and its effects 53 Salen K, Zimmerman E. Rules of Play: Fundamentals of Game Design. on information gathering and cognitive bias. Human Computer MIT Press: Cambridge, MA, 2003. Interaction Consortium Workshop (Frasier, CO) 2006. 54 Mohammed S. Toward an understanding of cognitive consensus 31 Gordon TF, Karacapilidis N. The Zeno argumentation framework. in a group decision-making context. The Journal of Applied Sixth International Conference on Artificial Intelligence and Law Behavioral Science 2001; 37: 408–425. (Melbourne, Australia) ACM Press: New York, NY, 1997; 10–18. 55 Donath JS. Identity and deception in the virtual community. 32 Clark HH, Brennan SE. Grounding in communication. In: Resnick In: Smith M and Kollock P (Eds). Communities in Cyberspace. LB, Levine RM and Teasley SD (Eds). Perspectives on Socially Shared Routledge: London, 1998. Cognition. APA Books: Washington, 1991; 127–149. 56 Goffman E. The Presentation of Self in Everyday Life. Anchor Books: 33 Clark HH, Wilkes-Gibbs D. Referring as a collaborative process. New York, 1959. Cognition 1986; 22: 1–39. 57 Walther JB. Computer-mediated communication: impersonal, 34 Brennan SE. How conversation is shaped by visual and spoken interpersonal and hyperpersonal interaction. Communication evidence. In: Trueswell J and Tanenhaus M (Eds). Approaches Research 1996; 23: 3–43. to Studying World-Situated Language Use: Bridging the Language- 58 Sproull L, Kiesler S. Computers, networks, and work. Scientific as-Product and Language-as-Action Traditions. MIT Press: American 1991; 265: 84–91. Cambridge, 2005; 95–129. 59 Resnick P, Zeckhauser R, Swanson J, Lockwood K. The value 35 Gergle D, Kraut RE, Fussell SR. Language efficiency and visual of reputation on eBay: a controlled experiment. Experimental technology: minimizing collaborative effort with visual inform- Economics 2006; 9: 79–101. ation. Journal of Language & Social Psychology 2004; 23: 491–517. 60 Brooks FP. The Mythical Man-Month: Essays on Software Engineering. 36 Wattenberg M, Kriss J. Designing for social data analysis. IEEE Addison-Wesley: Reading, MA, 1975. Transactions on Visualization and Computer Graphics 2006; 12: 61 Hardin R. The free rider problem. In: Zalta EN (Ed). The stanford 549–557. encyclopedia of philosophy. 2003. 37 Carroll J, Rosson MB, Convertino G, Ganoe CH. Awareness and 62 Cummings J. Work groups, structural diversity, and knowledge teamwork in computer-supported collaborations. Interacting with sharing in a global organization. Management Science 2004; 50: Computers 2005; 18: 21–46. 352–364. 38 Dourish P, Belotti V. Awareness and coordination in shared 63 Schultz-Hart S, Frey D, Lüthgens C, Moscovici S. Biased workspaces. ACM Conference on Computer-Supported Cooperative information search in group decision making. Journal of Work (Toronto, ON) ACM: New York, NY, 1992; 107–114. Personality and Social Psychology 2000; 78: 655–669. 39 Brush AJ, Bargeron D, Grudin J, Gupta A. Notification for shared 64 Burt RS. Structural holes and good ideas. American Journal of annotation of digital documents. ACM Conference on Human Sociology 2004; 110: 349–399. Factors in Computing Systems (CHI’02) (Minneapolis, MN) ACM: 65 Wu F, Huberman BA, Adamic LA, Tyler JR. Information flow in New York, NY, 2002. social groups. Physica A: Statistical and Theoretical Physics 2004; 40 Hill WC, Hollan JD, Wroblewski D, McCandless T. Edit wear and 337: 327. read wear. ACM Conference on Human Factors in Computing Systems 66 Golder SA, Huberman BA. Usage patterns of collaborative tagging (CHI’92) (Monterey, CA) ACM: New York, NY, 1992; 3–9. systems. Journal of Information Science 2006; 32: 198–208. 41 Willett W, Heer J, Agrawala M. Scented Widgets: improving 67 Scheff TJ. Toward a sociological model of consensus. American navigation cues with embedded visualizations. IEEE Transactions Sociological Review 1967; 32: 32–46. on Visualization and Computer Graphics 2007; 13: 1129–1136. 68 Hastie R. Experimental evidence on group accuracy. In: Grofman 42 Clark HH. Pointing and placing. In: Kita S (Ed). Pointing where B and Owen G (eds). Decision Research, Vol. 2, JAI Press: Language, Culture, and Cognition Meet. Erlbaum: London, 2003; Greenwich, CT 1986; 129–157. 243–268. 69 Gigone D, Hastie R. The common knowledge effect: information 43 Hill WC, Hollan JD. Deixis and the future of visualization sharing and group judgment. Journal of Personality and Social excellence. IEEE Visualization (San Diego, CA) IEEE Computer Psychology 1993; 65: 959–974. Society: Washington, DC, 2007; 314–319. 70 Surowiecki J. The Wisdom of Crowds. Random House: New York, 44 Becker RA, Cleveland WS. Brushing scatterplots. Technometrics 2004. 1987; 29: 127–142. 71 Stasser G, Titus W. Pooling of unshared information in group 45 Martin AR, Ward MO. High dimensional brushing for interactive decision making: biased information sampling during discussion. exploration of multivariate data. IEEE Visualization (Atlanta, GA) Journal of Personality and Social Psychology 1985; 57: 67–78. IEEE Computer Society: Washington, DC, 1995; 271–278. 72 Eccles R, Kapler T, Harper R, Wright W. Stories in geotime. IEEE 46 Ahlberg C, Shneiderman B. Visual information seeking: tight Symposium on Visual Analytics Science and Technology (Sacramento, coupling of dynamic query filters with starfield displays. ACM CA) IEEE Computer Society: Washington, DC, 2007. Information Visualization


