- 快召唤伙伴们来围观吧
- 微博 QQ QQ空间 贴吧
- 文档嵌入链接
- 复制
- 微信扫一扫分享
- 已成功复制到剪贴板
HDD_vs_SSD
展开查看详情
1 .HDD vs. SATA SSDs in the Data center October 2018 NVM SOLUTIONS GROUP 1
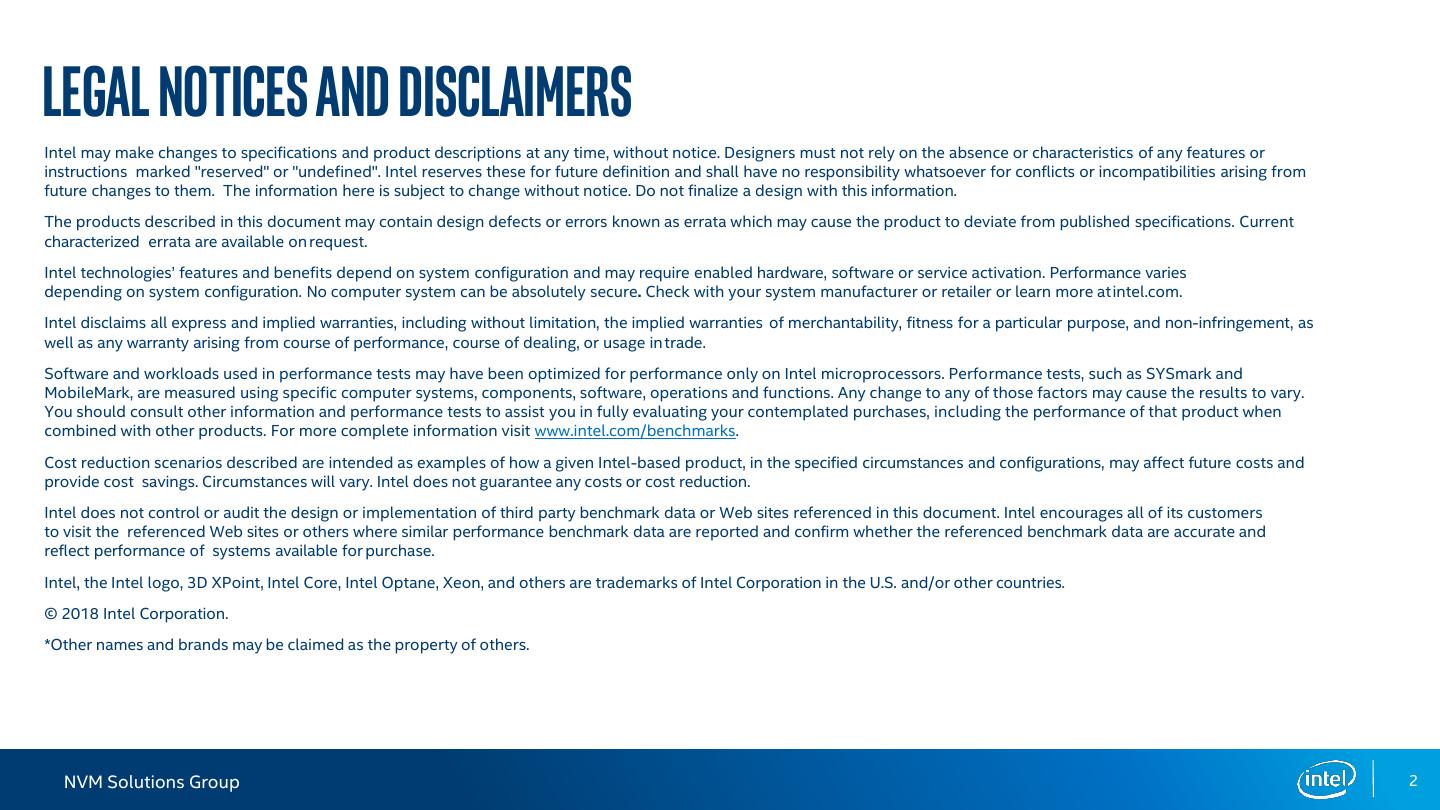
2 .Legal Notices and Disclaimers Intel may make changes to specifications and product descriptions at any time, without notice. Designers must not rely on the absence or characteristics of any features or instructions marked "reserved" or "undefined". Intel reserves these for future definition and shall have no responsibility whatsoever for conflicts or incompatibilities arising from future changes to them. The information here is subject to change without notice. Do not finalize a design with this information. The products described in this document may contain design defects or errors known as errata which may cause the product to deviate from published specifications. Current characterized errata are available on request. Intel technologies’ features and benefits depend on system configuration and may require enabled hardware, software or service activation. Performance varies depending on system configuration. No computer system can be absolutely secure. Check with your system manufacturer or retailer or learn more atintel.com. Intel disclaims all express and implied warranties, including without limitation, the implied warranties of merchantability, fitness for a particular purpose, and non-infringement, as well as any warranty arising from course of performance, course of dealing, or usage in trade. Software and workloads used in performance tests may have been optimized for performance only on Intel microprocessors. Performance tests, such as SYSmark and MobileMark, are measured using specific computer systems, components, software, operations and functions. Any change to any of those factors may cause the results to vary. You should consult other information and performance tests to assist you in fully evaluating your contemplated purchases, including the performance of that product when combined with other products. For more complete information visit www.intel.com/benchmarks. Cost reduction scenarios described are intended as examples of how a given Intel-based product, in the specified circumstances and configurations, may affect future costs and provide cost savings. Circumstances will vary. Intel does not guarantee any costs or cost reduction. Intel does not control or audit the design or implementation of third party benchmark data or Web sites referenced in this document. Intel encourages all of its customers to visit the referenced Web sites or others where similar performance benchmark data are reported and confirm whether the referenced benchmark data are accurate and reflect performance of systems available for purchase. Intel, the Intel logo, 3D XPoint, Intel Core, Intel Optane, Xeon, and others are trademarks of Intel Corporation in the U.S. and/or other countries. © 2018 Intel Corporation. *Other names and brands may be claimed as the property of others. NVM Solutions Group 2
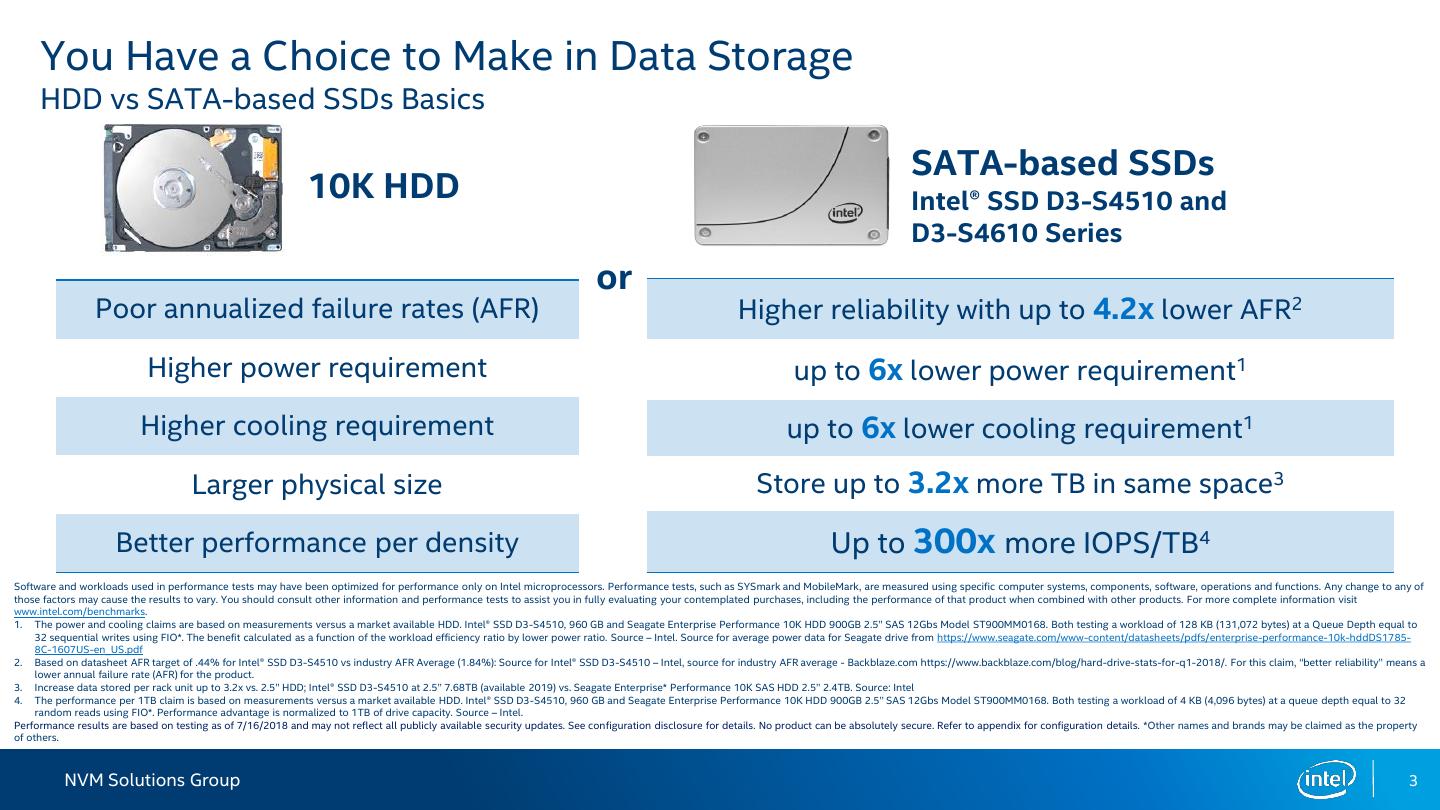
3 . You Have a Choice to Make in Data Storage HDD vs SATA-based SSDs Basics SATA-based SSDs 10K HDD Intel® SSD D3-S4510 and D3-S4610 Series or Poor annualized failure rates (AFR) Higher reliability with up to 4.2x lower AFR2 Higher power requirement up to 6x lower power requirement1 Higher cooling requirement up to 6x lower cooling requirement1 Larger physical size Store up to 3.2x more TB in same space3 Better performance per density Up to 300x more IOPS/TB4 Software and workloads used in performance tests may have been optimized for performance only on Intel microprocessors. Performance tests, such as SYSmark and MobileMark, are measured using specific computer systems, components, software, operations and functions. Any change to any of those factors may cause the results to vary. You should consult other information and performance tests to assist you in fully evaluating your contemplated purchases, including the performance of that product when combined with other products. For more complete information visit www.intel.com/benchmarks. 1. The power and cooling claims are based on measurements versus a market available HDD. Intel® SSD D3-S4510, 960 GB and Seagate Enterprise Performance 10K HDD 900GB 2.5” SAS 12Gbs Model ST900MM0168. Both testing a workload of 128 KB (131,072 bytes) at a Queue Depth equal to 32 sequential writes using FIO*. The benefit calculated as a function of the workload efficiency ratio by lower power ratio. Source – Intel. Source for average power data for Seagate drive from https://www.seagate.com/www-content/datasheets/pdfs/enterprise-performance-10k-hddDS1785- 8C-1607US-en_US.pdf 2. Based on datasheet AFR target of .44% for Intel® SSD D3-S4510 vs industry AFR Average (1.84%): Source for Intel® SSD D3-S4510 – Intel, source for industry AFR average - Backblaze.com https://www.backblaze.com/blog/hard-drive-stats-for-q1-2018/. For this claim, “better reliability” means a lower annual failure rate (AFR) for the product. 3. Increase data stored per rack unit up to 3.2x vs. 2.5” HDD; Intel® SSD D3-S4510 at 2.5” 7.68TB (available 2019) vs. Seagate Enterprise* Performance 10K SAS HDD 2.5” 2.4TB. Source: Intel 4. The performance per 1TB claim is based on measurements versus a market available HDD. Intel® SSD D3-S4510, 960 GB and Seagate Enterprise Performance 10K HDD 900GB 2.5” SAS 12Gbs Model ST900MM0168. Both testing a workload of 4 KB (4,096 bytes) at a queue depth equal to 32 random reads using FIO*. Performance advantage is normalized to 1TB of drive capacity. Source – Intel. Performance results are based on testing as of 7/16/2018 and may not reflect all publicly available security updates. See configuration disclosure for details. No product can be absolutely secure. Refer to appendix for configuration details. *Other names and brands may be claimed as the property of others. NVM Solutions Group 3
4 .Factors Affecting Data Center Storage Decisions Reliability Performance Operating Costs Price Transaction Failure Rates Power Throughput Data Read HDD SSD Cooling Protection Performance Health Write IOPs Rack Space Tracking TCO - Total Cost of Ownership NVM SOLUTIONS GROUP 4
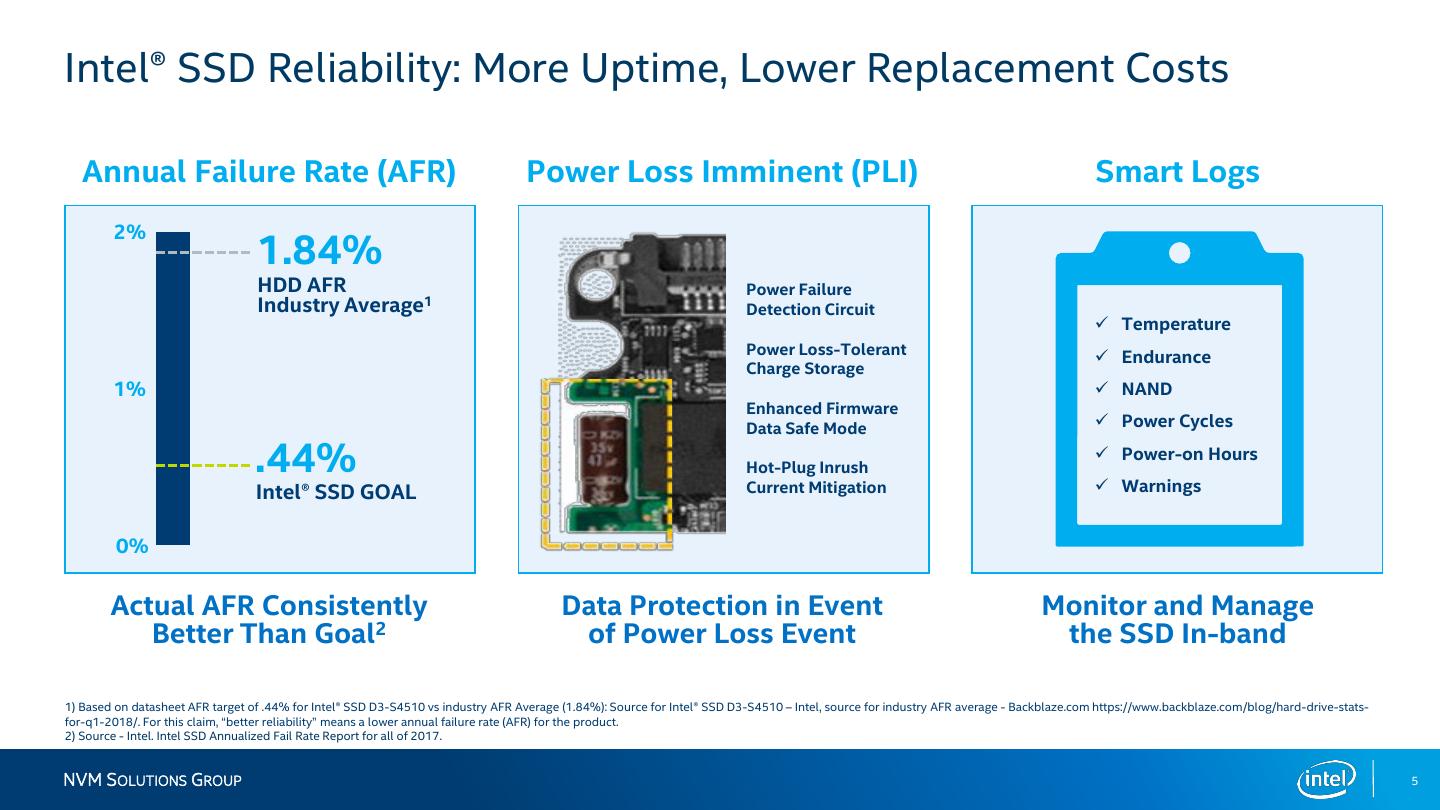
5 .Intel® SSD Reliability: More Uptime, Lower Replacement Costs Annual Failure Rate (AFR) Power Loss Imminent (PLI) Smart Logs 2% 1.84% HDD AFR Power Failure Industry Average1 Detection Circuit ✓ Temperature Power Loss-Tolerant ✓ Endurance Charge Storage 1% ✓ NAND Enhanced Firmware Data Safe Mode ✓ Power Cycles .44% Hot-Plug Inrush ✓ Power-on Hours ✓ Warnings Intel® SSD GOAL Current Mitigation 0% Actual AFR Consistently Data Protection in Event Monitor and Manage Better Than Goal2 of Power Loss Event the SSD In-band 1) Based on datasheet AFR target of .44% for Intel® SSD D3-S4510 vs industry AFR Average (1.84%): Source for Intel® SSD D3-S4510 – Intel, source for industry AFR average - Backblaze.com https://www.backblaze.com/blog/hard-drive-stats- for-q1-2018/. For this claim, “better reliability” means a lower annual failure rate (AFR) for the product. 2) Source - Intel. Intel SSD Annualized Fail Rate Report for all of 2017. NVM SOLUTIONS GROUP 5
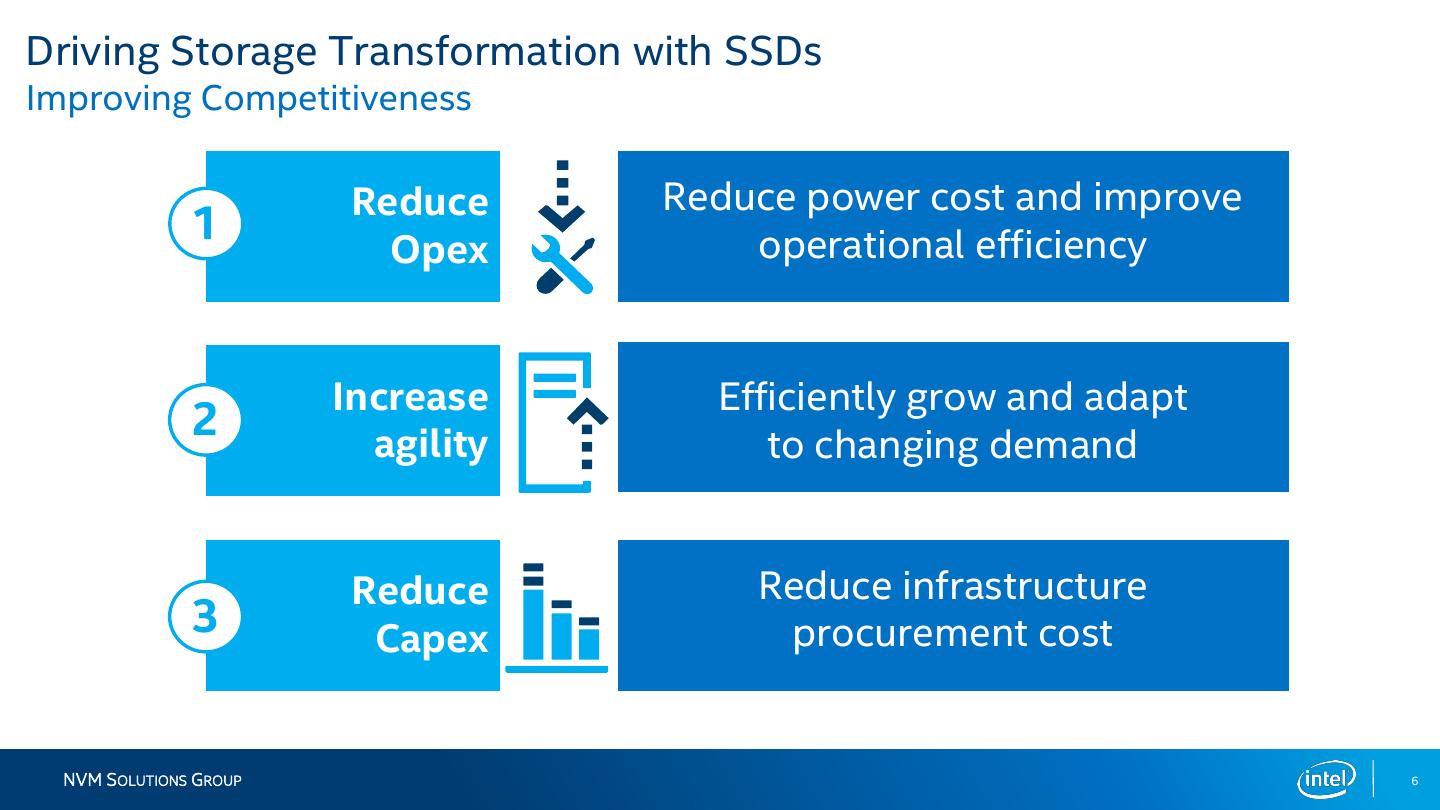
6 .Driving Storage Transformation with SSDs Improving Competitiveness Reduce Reduce power cost and improve 1 Opex operational efficiency Increase Efficiently grow and adapt 2 agility to changing demand Reduce Reduce infrastructure 3 Capex procurement cost NVM SOLUTIONS GROUP 6
7 .NVM Solutions Group 7
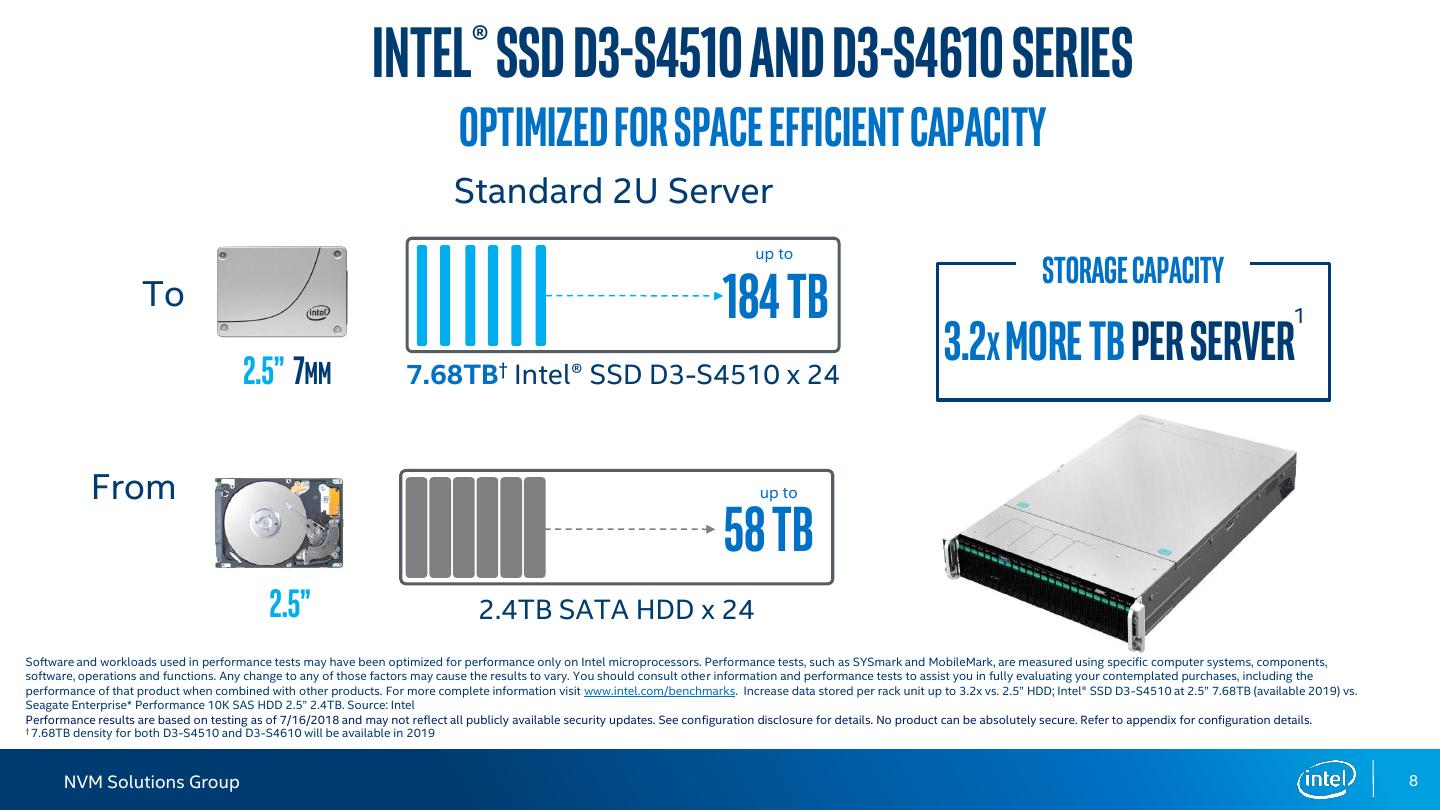
8 . Intel® SSD D3-S4510 and D3-S4610 Series Optimized for space efficient capacity Standard 2U Server up to Storage Capacity To 184 TB 1 2.5” 7mm 7.68TB† Intel® SSD D3-S4510 x 24 3.2x more tB per Server From up to 58 TB 2.5” 2.4TB SATA HDD x 24 Software and workloads used in performance tests may have been optimized for performance only on Intel microprocessors. Performance tests, such as SYSmark and MobileMark, are measured using specific computer systems, components, software, operations and functions. Any change to any of those factors may cause the results to vary. You should consult other information and performance tests to assist you in fully evaluating your contemplated purchases, including the performance of that product when combined with other products. For more complete information visit www.intel.com/benchmarks. Increase data stored per rack unit up to 3.2x vs. 2.5” HDD; Intel® SSD D3-S4510 at 2.5” 7.68TB (available 2019) vs. Seagate Enterprise* Performance 10K SAS HDD 2.5” 2.4TB. Source: Intel Performance results are based on testing as of 7/16/2018 and may not reflect all publicly available security updates. See configuration disclosure for details. No product can be absolutely secure. Refer to appendix for configuration details. † 7.68TB density for both D3-S4510 and D3-S4610 will be available in 2019 NVM Solutions Group 8
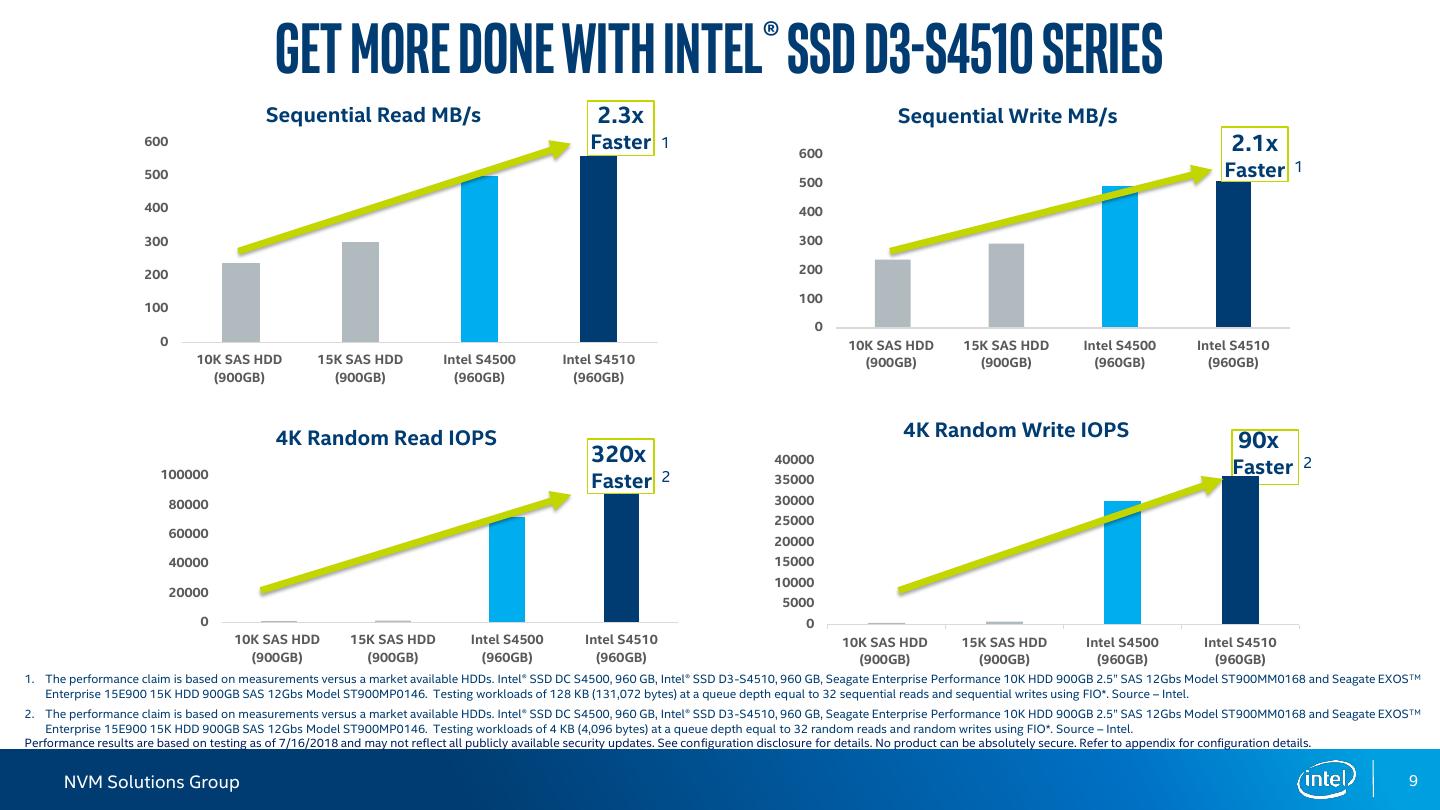
9 . Get More Done with Intel® SSD D3-S4510 Series Sequential Read MB/s 2.3x Sequential Write MB/s 600 Faster 1 600 2.1x 500 Faster 1 500 400 400 300 300 200 200 100 100 0 0 10K SAS HDD 15K SAS HDD Intel S4500 Intel S4510 10K SAS HDD 15K SAS HDD Intel S4500 Intel S4510 (900GB) (900GB) (960GB) (960GB) (900GB) (900GB) (960GB) (960GB) 4K Random Read IOPS 4K Random Write IOPS 90x 320x 40000 Faster 2 100000 2 Faster 35000 80000 30000 25000 60000 20000 40000 15000 10000 20000 5000 0 0 10K SAS HDD 15K SAS HDD Intel S4500 Intel S4510 10K SAS HDD 15K SAS HDD Intel S4500 Intel S4510 (900GB) (900GB) (960GB) (960GB) (900GB) (900GB) (960GB) (960GB) 1. The performance claim is based on measurements versus a market available HDDs. Intel® SSD DC S4500, 960 GB, Intel® SSD D3-S4510, 960 GB, Seagate Enterprise Performance 10K HDD 900GB 2.5” SAS 12Gbs Model ST900MM0168 and Seagate EXOS TM Enterprise 15E900 15K HDD 900GB SAS 12Gbs Model ST900MP0146. Testing workloads of 128 KB (131,072 bytes) at a queue depth equal to 32 sequential reads and sequential writes using FIO*. Source – Intel. 2. The performance claim is based on measurements versus a market available HDDs. Intel® SSD DC S4500, 960 GB, Intel® SSD D3-S4510, 960 GB, Seagate Enterprise Performance 10K HDD 900GB 2.5” SAS 12Gbs Model ST900MM0168 and Seagate EXOS TM Enterprise 15E900 15K HDD 900GB SAS 12Gbs Model ST900MP0146. Testing workloads of 4 KB (4,096 bytes) at a queue depth equal to 32 random reads and random writes using FIO*. Source – Intel. Performance results are based on testing as of 7/16/2018 and may not reflect all publicly available security updates. See configuration disclosure for details. No product can be absolutely secure. Refer to appendix for configuration details. NVM Solutions Group 9
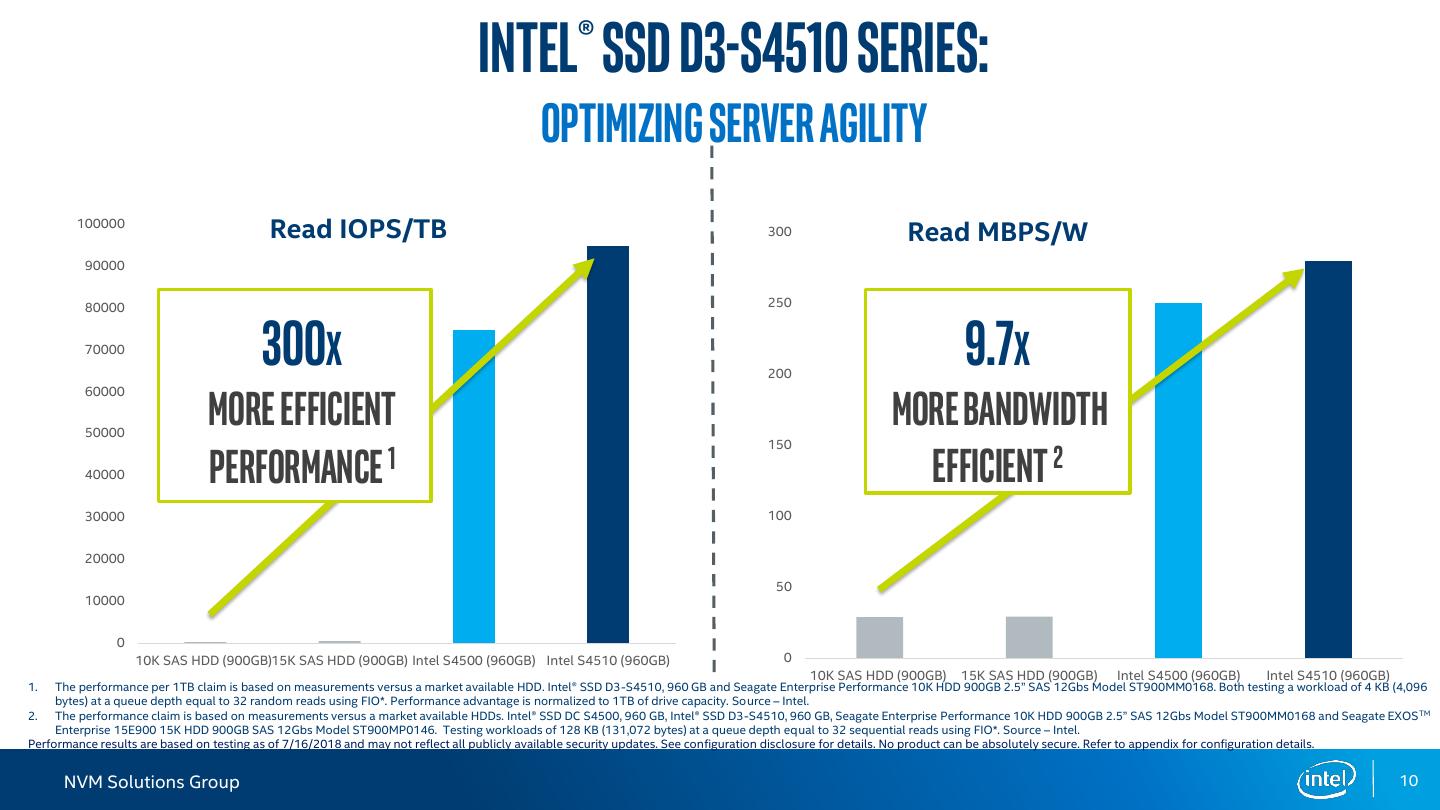
10 . Intel® SSD D3-S4510 Series: Optimizing server agility 100000 Read IOPS/TB 300 Read MBPS/W 90000 80000 250 70000 300X 200 9.7X more efficient more Bandwidth 60000 50000 150 40000 Performance 1 Efficient 2 30000 100 20000 50 10000 0 10K SAS HDD (900GB)15K SAS HDD (900GB) Intel S4500 (960GB) Intel S4510 (960GB) 0 10K SAS HDD (900GB) 15K SAS HDD (900GB) Intel S4500 (960GB) Intel S4510 (960GB) 1. The performance per 1TB claim is based on measurements versus a market available HDD. Intel® SSD D3-S4510, 960 GB and Seagate Enterprise Performance 10K HDD 900GB 2.5” SAS 12Gbs Model ST900MM0168. Both testing a workload of 4 KB (4,096 bytes) at a queue depth equal to 32 random reads using FIO*. Performance advantage is normalized to 1TB of drive capacity. Source – Intel. 2. The performance claim is based on measurements versus a market available HDDs. Intel® SSD DC S4500, 960 GB, Intel® SSD D3-S4510, 960 GB, Seagate Enterprise Performance 10K HDD 900GB 2.5” SAS 12Gbs Model ST900MM0168 and Seagate EXOS TM Enterprise 15E900 15K HDD 900GB SAS 12Gbs Model ST900MP0146. Testing workloads of 128 KB (131,072 bytes) at a queue depth equal to 32 sequential reads using FIO*. Source – Intel. Performance results are based on testing as of 7/16/2018 and may not reflect all publicly available security updates. See configuration disclosure for details. No product can be absolutely secure. Refer to appendix for configuration details. NVM Solutions Group 10
11 .Appendix – Configuration Details Software and workloads used in performance tests may have been optimized for performance only on Intel microprocessors. Performance tests, such as SYSmark and MobileMark, are measured using specific computer systems, components, software, operations and functions. Any change to any of those factors may cause the results to vary. You should consult other information and performance tests to assist you in fully evaluating your contemplated purchases, including the performance of that product when combined with other products. For more complete information visit www.intel.com/benchmarks. Intel technologies’ features and benefits depend on system configuration and may require enabled hardware, software or service activation. Performance varies depending on system configuration. No computer system can be absolutely secure. Check with your system manufacturer or retailer or learn more at intel.com. System configuration for performance tests: Motherboard- H270N-WIFI-CF (Gigabyte Technology Co.); CPU- model name Intel ® Core™ i7-17700 CPU @ 3600Hz; - BIOS version- F8d (American Megatrends Inc.); amount of DRAM- Mem total – 8052144KB; OS version – CentOS 7.5; Kernel version – 4.17; FIO version – 3.1. Performance testing for Intel® SSD DC S4500, Intel® SSD D3-S4510, Intel® SSD DC S4600, Intel® SSD D3-S4610, Seagate Enterprise Performance 10K HDD 900GB 2.5” SAS 12Gbs Model ST900MM0168 and Seagate EXOSTM Enterprise 15E900 15K HDD 900GB SAS 12Gbs Model ST900MP0146 was performed on 7/16/2018. NVM Solutions Group 11


