- 快召唤伙伴们来围观吧
- 微博 QQ QQ空间 贴吧
- 文档嵌入链接
- 复制
- 微信扫一扫分享
- 已成功复制到剪贴板
mixture models
展开查看详情
1 .Mixture Models Mixture Models Jia Li Department of Statistics The Pennsylvania State University Email: jiali@stat.psu.edu http://www.stat.psu.edu/∼jiali Jia Li http://www.stat.psu.edu/∼jiali
2 .Mixture Models Clustering by Mixture Models General background on clustering Example method: k-means Mixture model based clustering Model estimation Jia Li http://www.stat.psu.edu/∼jiali
3 .Mixture Models Clustering A basic tool in data mining/pattern recognition: Divide a set of data into groups. Samples in one cluster are close and clusters are far apart. Jia Li http://www.stat.psu.edu/∼jiali
4 .Mixture Models Motivations: Discover classes of data in an unsupervised way (unsupervised learning). Efficient representation of data: fast retrieval, data complexity reduction. Various engineering purposes: tightly linked with pattern recognition. Jia Li http://www.stat.psu.edu/∼jiali
5 .Mixture Models Approaches to Clustering Represent samples by feature vectors. Define a distance measure to assess the closeness between data. “Closeness” can be measured in many ways. Define distance based on various norms. For gene expression levels in a set of micro-array data, “closeness” between genes may be measured by the Euclidean distance between the gene profile vectors, or by correlation. Jia Li http://www.stat.psu.edu/∼jiali
6 .Mixture Models Approaches: Define an objective function to assess the quality of clustering and optimize the objective function (purely computational). Clustering can be performed based merely on pair-wise distances. How each sample is represented does not come into the picture. Statistical model based clustering. Jia Li http://www.stat.psu.edu/∼jiali
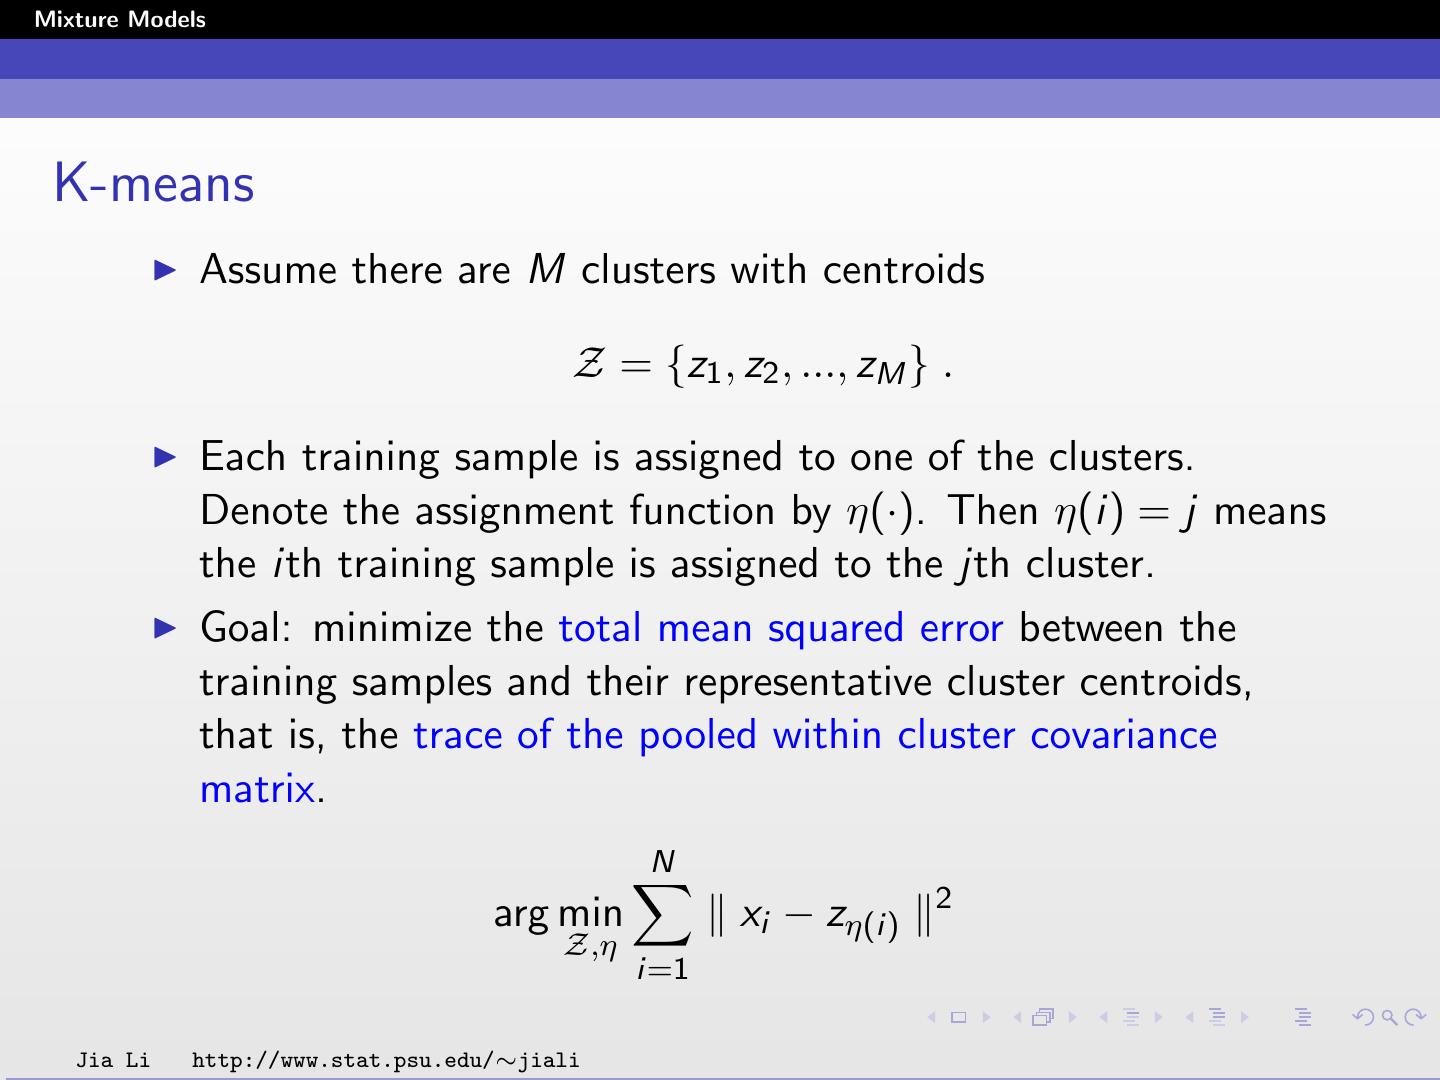
7 .Mixture Models K-means Assume there are M clusters with centroids Z = {z1 , z2 , ..., zM } . Each training sample is assigned to one of the clusters. Denote the assignment function by η(·). Then η(i) = j means the ith training sample is assigned to the jth cluster. Goal: minimize the total mean squared error between the training samples and their representative cluster centroids, that is, the trace of the pooled within cluster covariance matrix. N 2 arg min xi − zη(i) Z,η i=1 Jia Li http://www.stat.psu.edu/∼jiali
8 .Mixture Models Denote the objective function by N 2 L(Z, η) = xi − zη(i) . i=1 Intuition: training samples are tightly clustered around the centroids. Hence, the centroids serve as a compact representation for the training data. Jia Li http://www.stat.psu.edu/∼jiali
9 .Mixture Models Necessary Conditions If Z is fixed, the optimal assignment function η(·) should follow the nearest neighbor rule, that is, η(i) = arg minj∈{1,2,...,M} xi − zj . If η(·) is fixed, the cluster centroid zj should be the average of all the samples assigned to the jth cluster: i:η(i)=j xi zj = . Nj Nj is the number of samples assigned to cluster j. Jia Li http://www.stat.psu.edu/∼jiali
10 .Mixture Models The Algorithm Based on the necessary conditions, the k-means algorithm alternates the two steps: For a fixed set of centroids, optimize η(·) by assigning each sample to its closest centroid using Euclidean distance. Update the centroids by computing the average of all the samples assigned to it. The algorithm converges since after each iteration, the objective function decreases (non-increasing). Usually converges fast. Stopping criterion: the ratio between the decrease and the objective function is below a threshold. Jia Li http://www.stat.psu.edu/∼jiali
11 .Mixture Models Mixture Model-based Clustering Each cluster is mathematically represented by a parametric distribution. Examples: Gaussian (continuous), Poisson (discrete). The entire data set is modeled by a mixture of these distributions. An individual distribution used to model a specific cluster is often referred to as a component distribution. Jia Li http://www.stat.psu.edu/∼jiali
12 .Mixture Models Suppose there are K components (clusters). Each component is a Gaussian distribution parameterized by µk , Σk . Denote the data by X , X ∈ Rd . The density of component k is fk (x) = φ(x | µk , Σk ) 1 −(x − µk )t Σ−1 k (x − µk ) = exp( ). (2π)d |Σk | 2 The prior probability (weight) of component k is ak . The mixture density is: K K f (x) = ak fk (x) = ak φ(x | µk , Σk ) . k=1 k=1 Jia Li http://www.stat.psu.edu/∼jiali
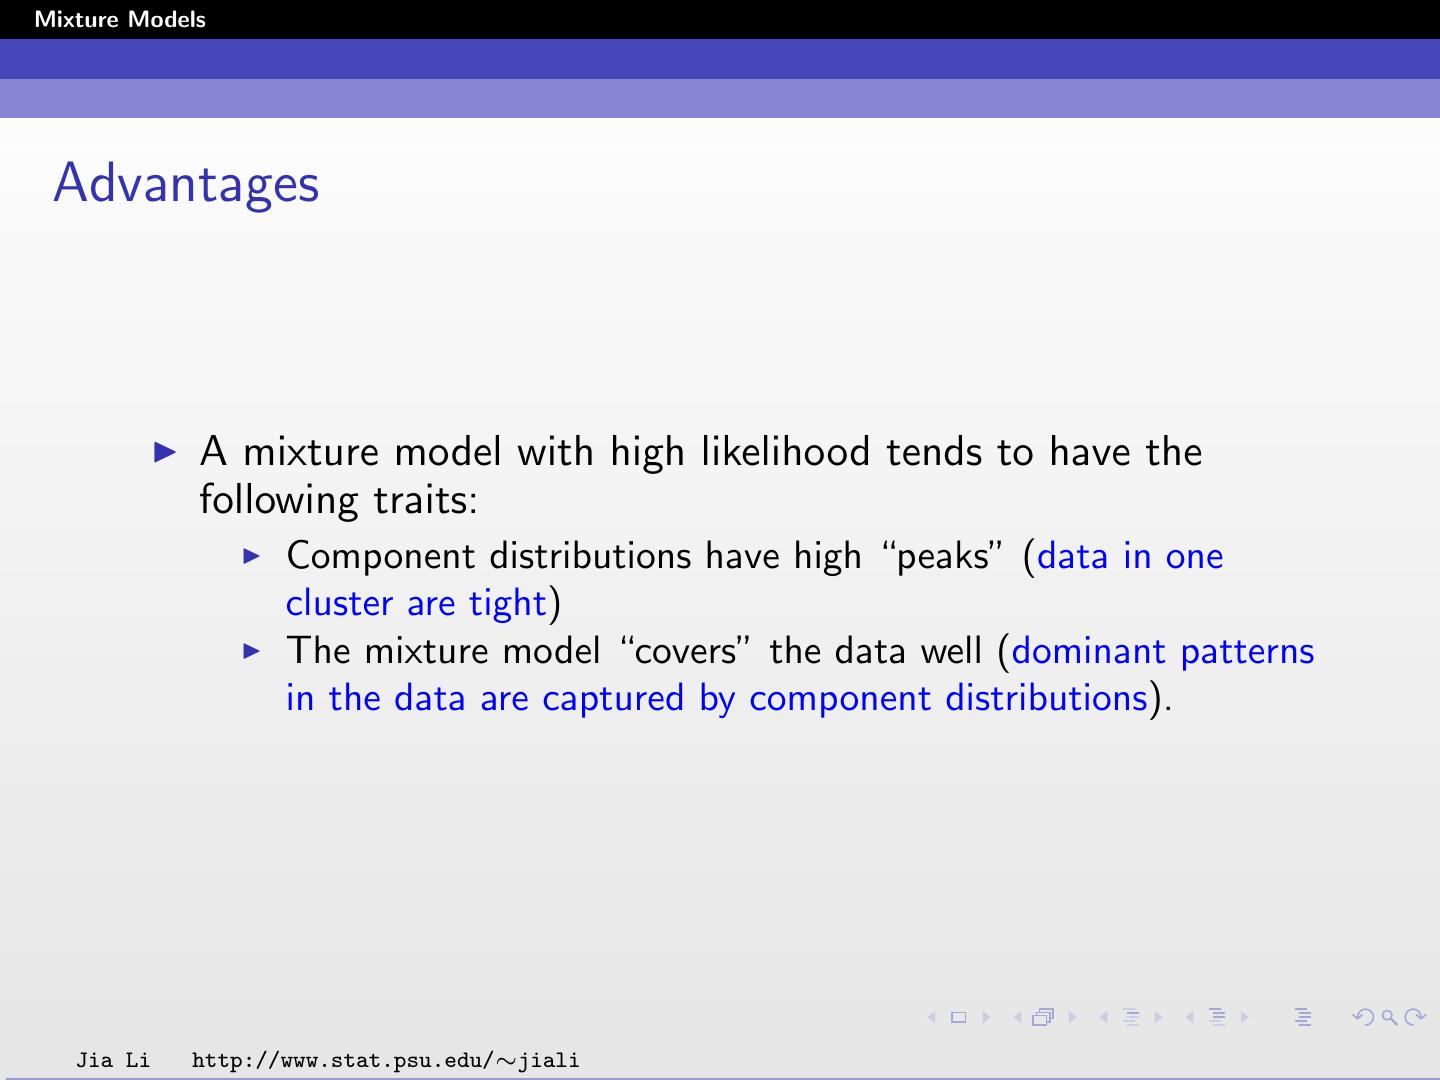
13 .Mixture Models Advantages A mixture model with high likelihood tends to have the following traits: Component distributions have high “peaks” (data in one cluster are tight) The mixture model “covers” the data well (dominant patterns in the data are captured by component distributions). Jia Li http://www.stat.psu.edu/∼jiali
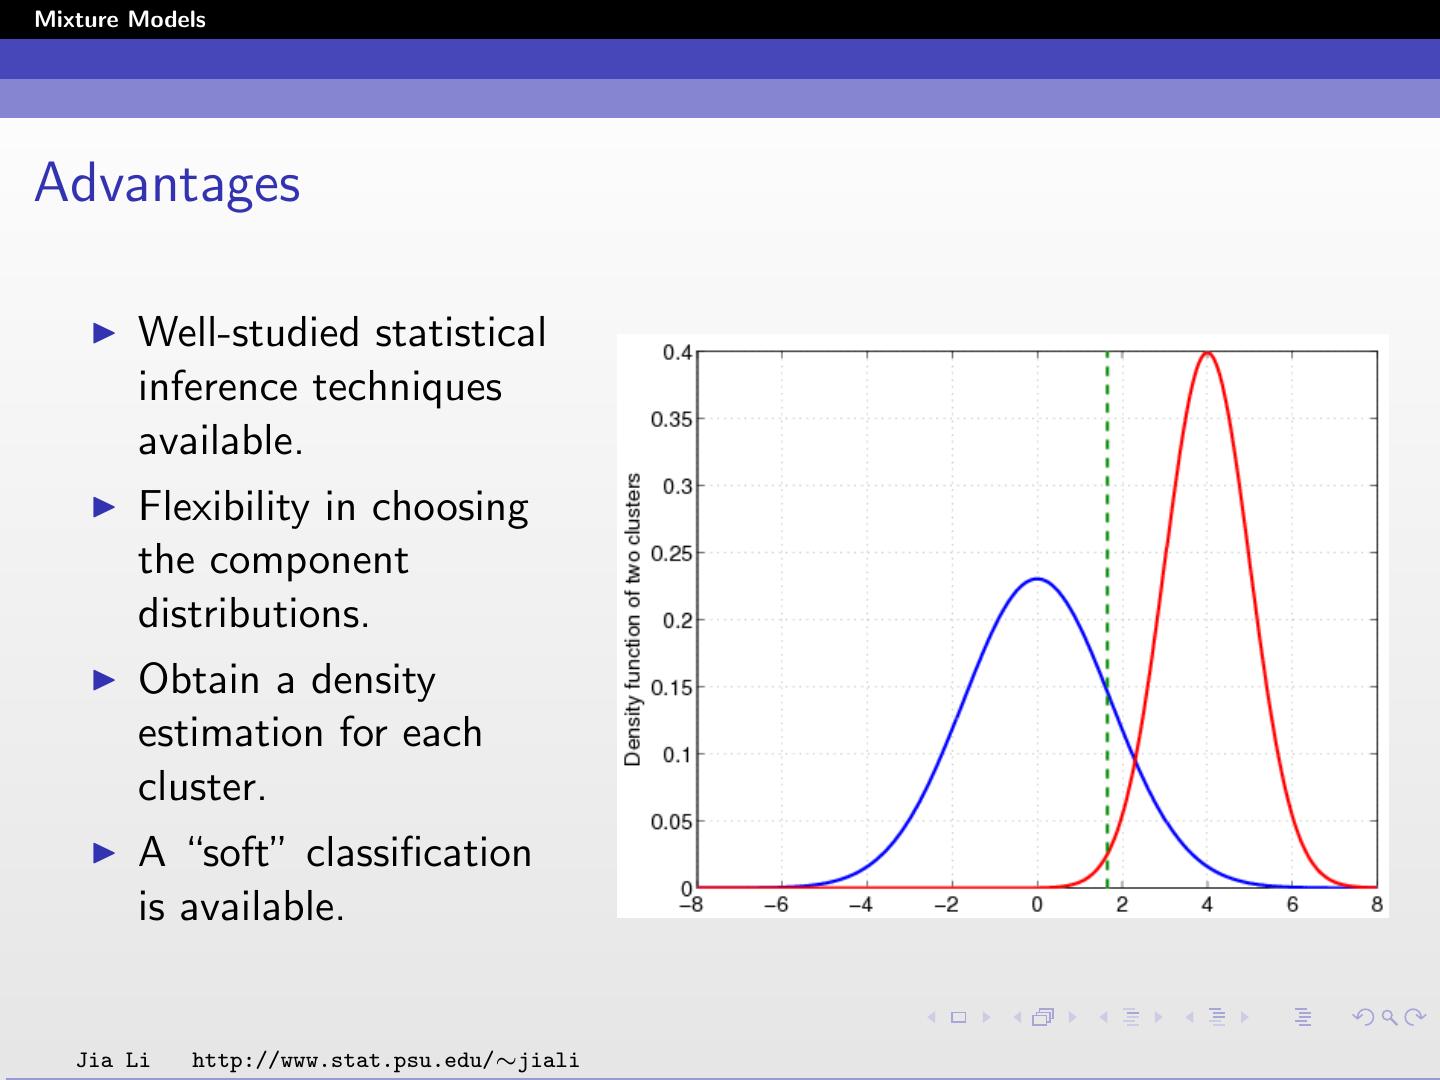
14 .Mixture Models Advantages Well-studied statistical inference techniques available. Flexibility in choosing the component distributions. Obtain a density estimation for each cluster. A “soft” classification is available. Jia Li http://www.stat.psu.edu/∼jiali
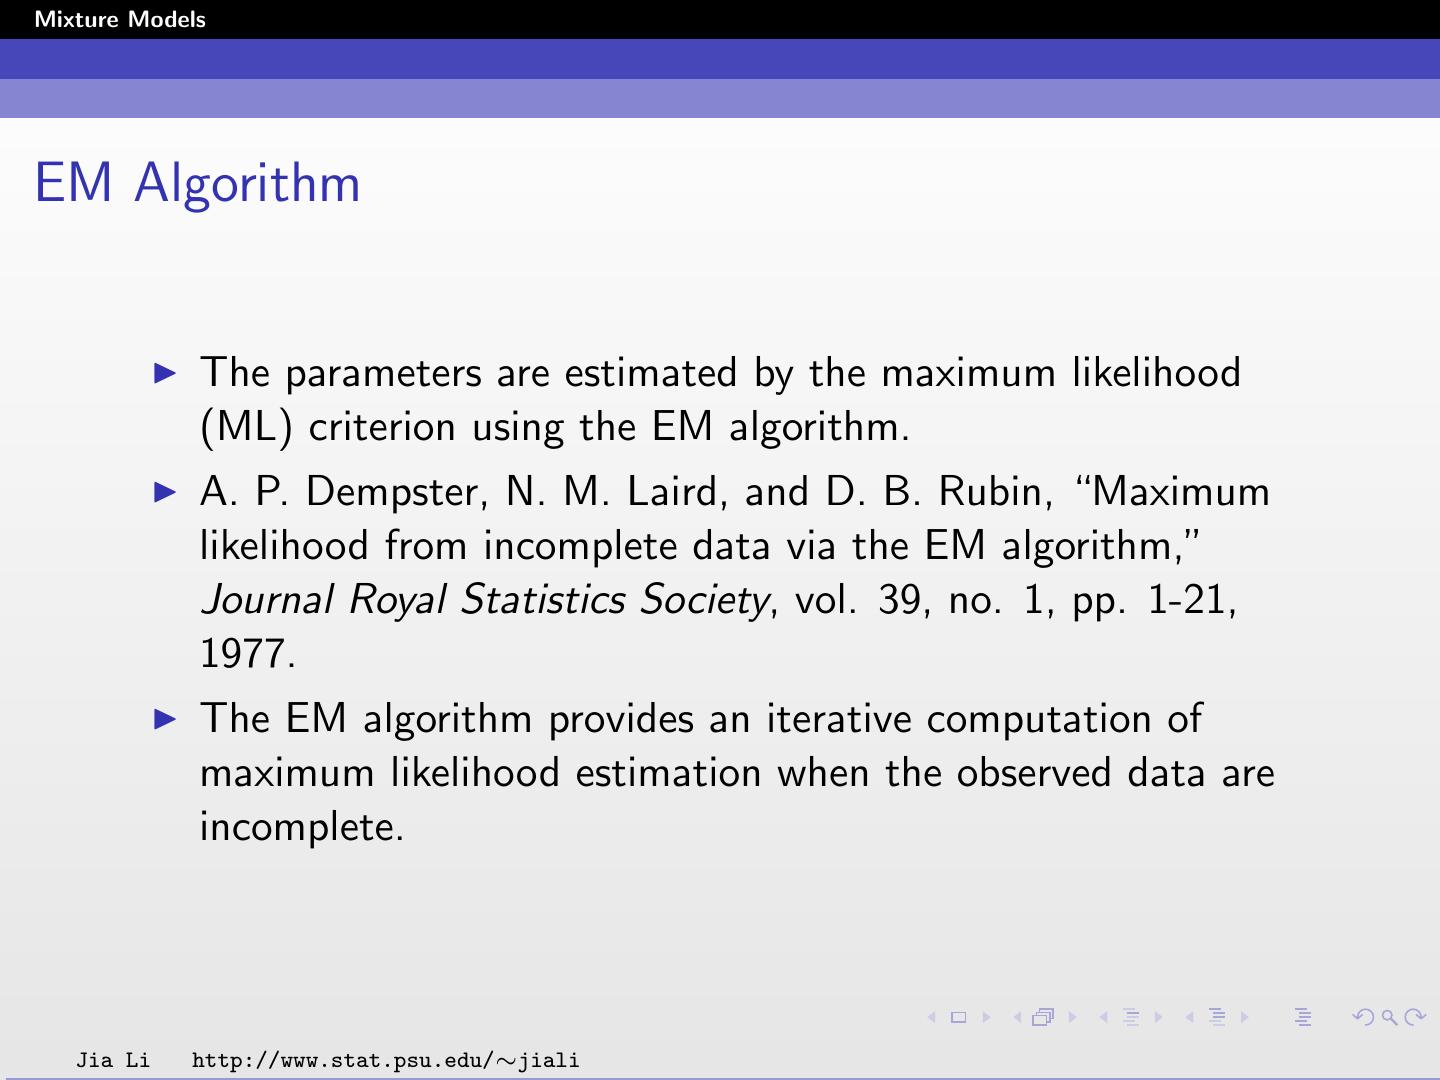
15 .Mixture Models EM Algorithm The parameters are estimated by the maximum likelihood (ML) criterion using the EM algorithm. A. P. Dempster, N. M. Laird, and D. B. Rubin, “Maximum likelihood from incomplete data via the EM algorithm,” Journal Royal Statistics Society, vol. 39, no. 1, pp. 1-21, 1977. The EM algorithm provides an iterative computation of maximum likelihood estimation when the observed data are incomplete. Jia Li http://www.stat.psu.edu/∼jiali
16 .Mixture Models Incompleteness can be conceptual. We need to estimate the distribution of X , in sample space X , but we can only observe X indirectly through Y , in sample space Y. In many cases, there is a mapping x → y (x) from X to Y, and x is only known to lie in a subset of X , denoted by X (y ), which is determined by the equation y = y (x). The distribution of X is parameterized by a family of distributions f (x | θ), with parameters θ ∈ Ω, on x. The distribution of y , g (y | θ) is g (y | θ) = f (x | θ)dx . X (y ) Jia Li http://www.stat.psu.edu/∼jiali
17 .Mixture Models The EM algorithm aims at finding a θ that maximizes g (y | θ) given an observed y . Introduce the function Q(θ | θ) = E (log f (x | θ ) | y , θ) , that is, the expected value of log f (x | θ ) according to the conditional distribution of x given y and parameter θ. The expectation is assumed to exist for all pairs (θ , θ). In particular, it is assumed that f (x | θ) > 0 for θ ∈ Ω. EM Iteration: E-step: Compute Q(θ | θ(p) ). M-step: Choose θ(p+1) to be a value of θ ∈ Ω that maximizes Q(θ | θ(p) ). Jia Li http://www.stat.psu.edu/∼jiali
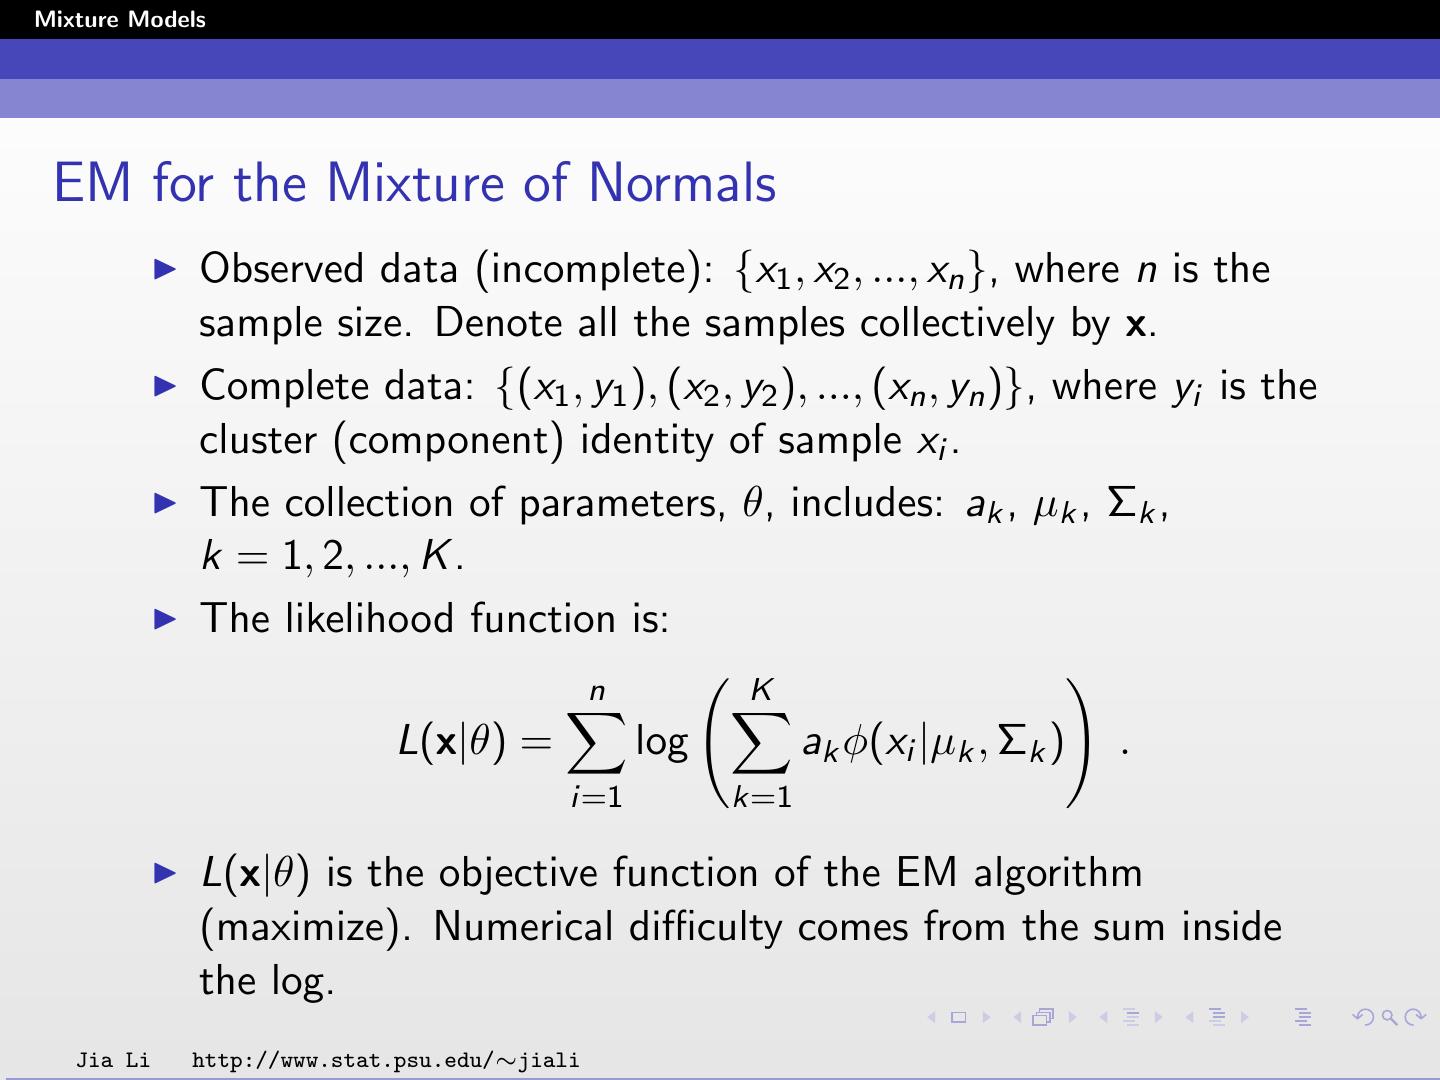
18 .Mixture Models EM for the Mixture of Normals Observed data (incomplete): {x1 , x2 , ..., xn }, where n is the sample size. Denote all the samples collectively by x. Complete data: {(x1 , y1 ), (x2 , y2 ), ..., (xn , yn )}, where yi is the cluster (component) identity of sample xi . The collection of parameters, θ, includes: ak , µk , Σk , k = 1, 2, ..., K . The likelihood function is: n K L(x|θ) = log ak φ(xi |µk , Σk ) . i=1 k=1 L(x|θ) is the objective function of the EM algorithm (maximize). Numerical difficulty comes from the sum inside the log. Jia Li http://www.stat.psu.edu/∼jiali
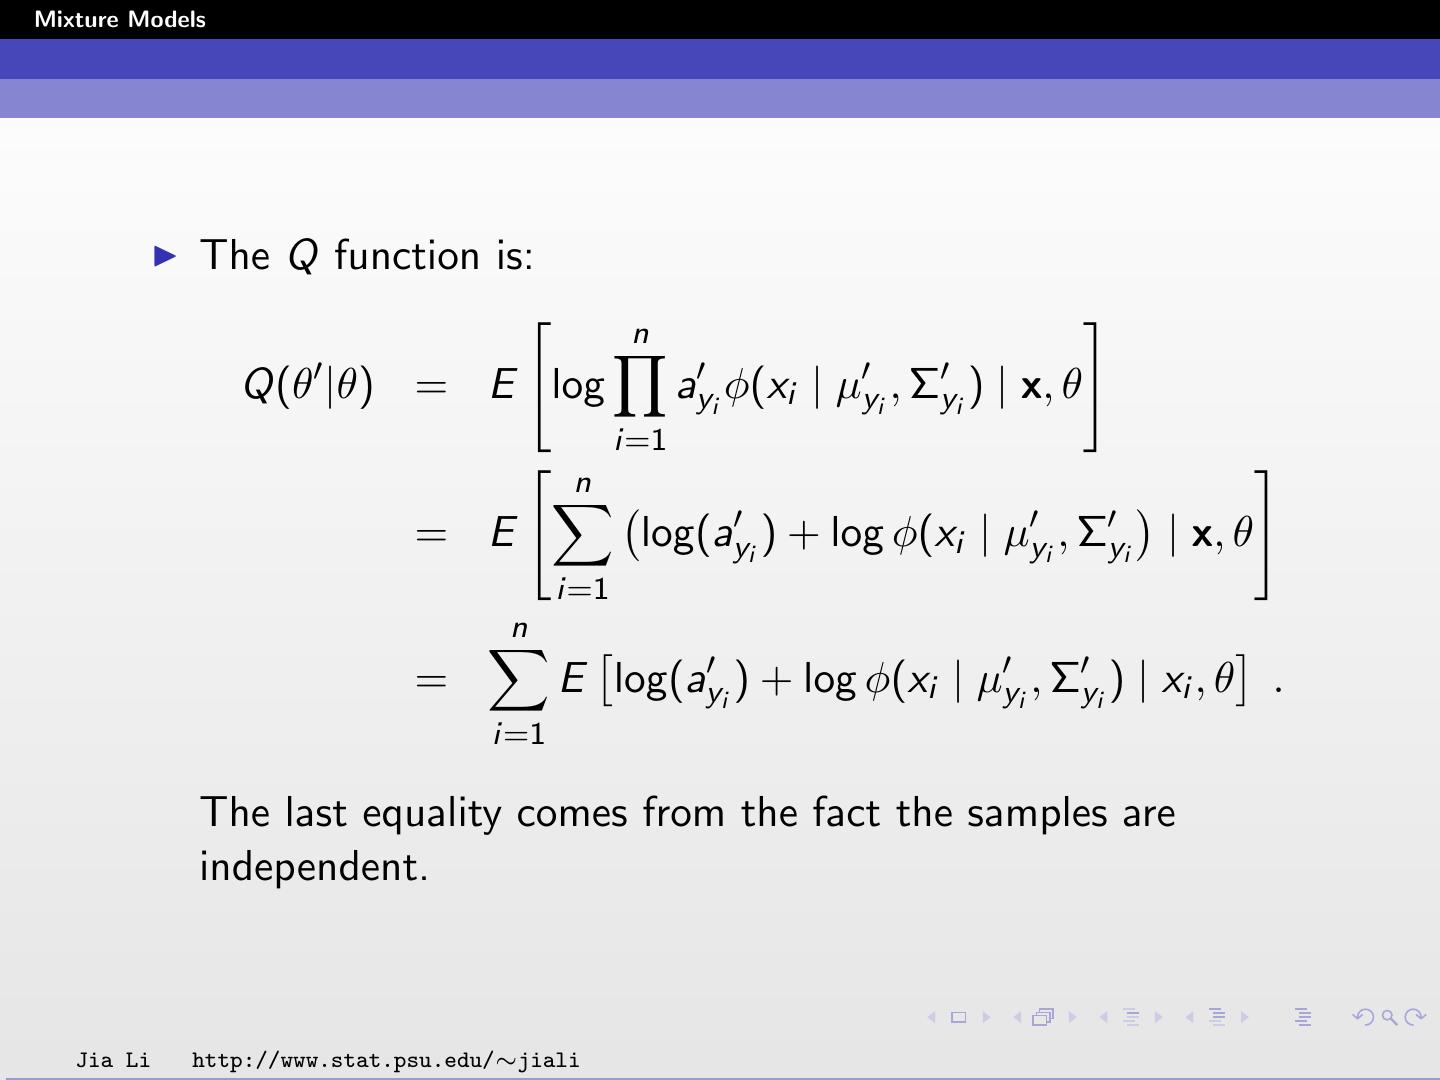
19 .Mixture Models The Q function is: n Q(θ |θ) = E log ayi φ(xi | µyi , Σyi ) | x, θ i=1 n = E log(ayi ) + log φ(xi | µyi , Σyi | x, θ i=1 n = E log(ayi ) + log φ(xi | µyi , Σyi ) | xi , θ . i=1 The last equality comes from the fact the samples are independent. Jia Li http://www.stat.psu.edu/∼jiali
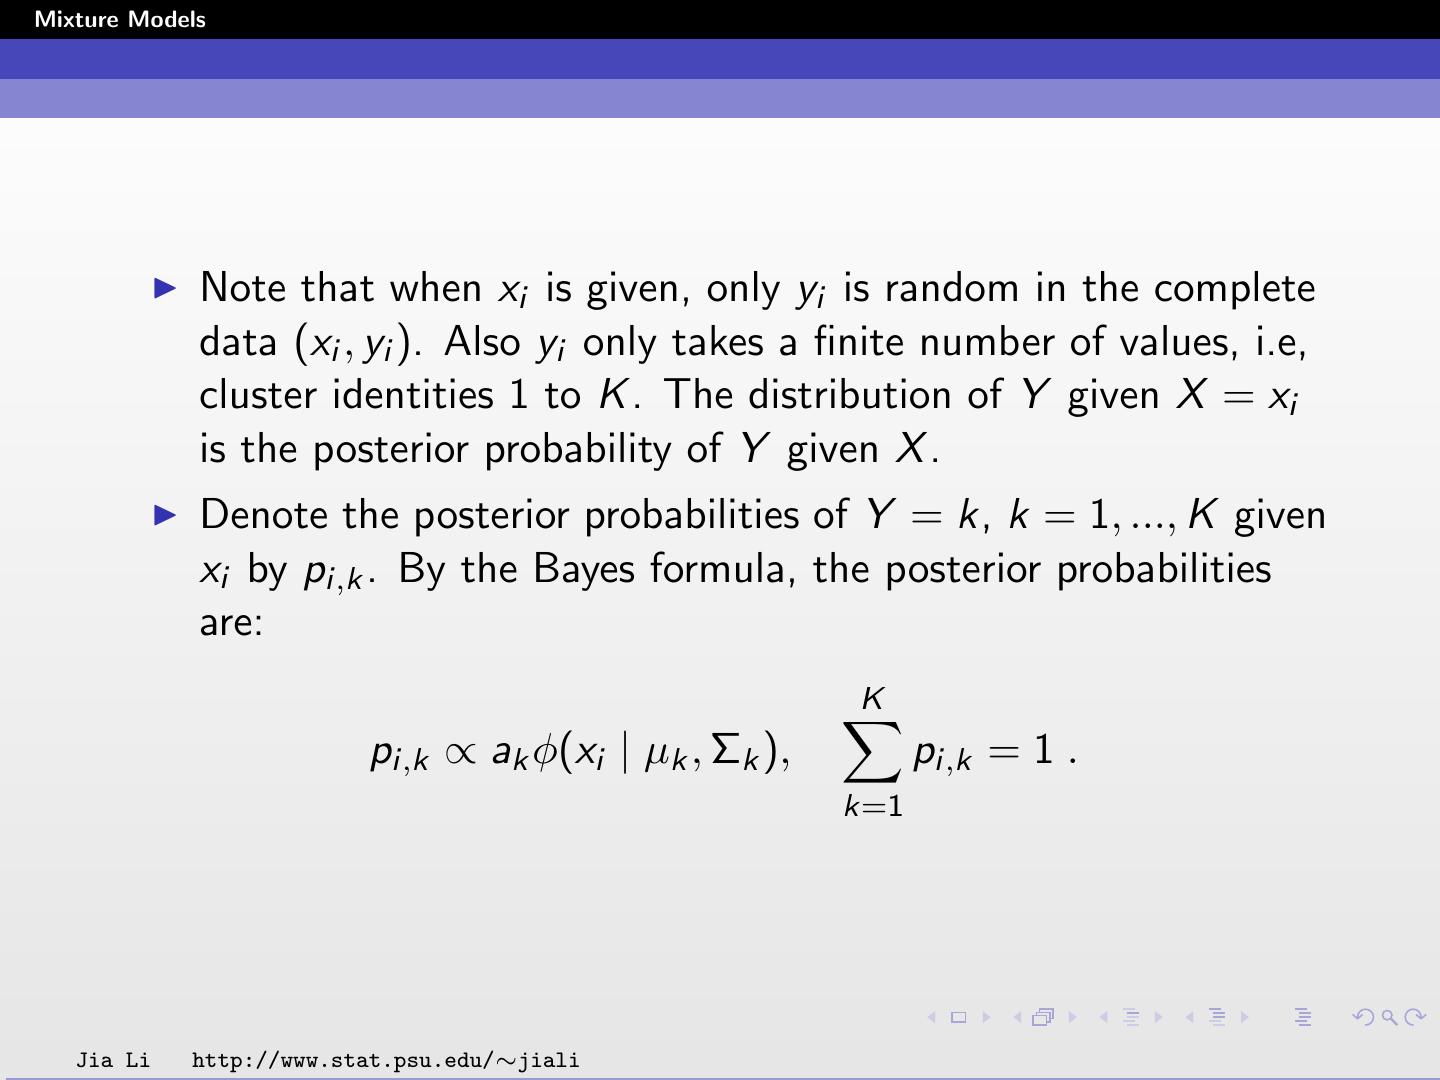
20 .Mixture Models Note that when xi is given, only yi is random in the complete data (xi , yi ). Also yi only takes a finite number of values, i.e, cluster identities 1 to K . The distribution of Y given X = xi is the posterior probability of Y given X . Denote the posterior probabilities of Y = k, k = 1, ..., K given xi by pi,k . By the Bayes formula, the posterior probabilities are: K pi,k ∝ ak φ(xi | µk , Σk ), pi,k = 1 . k=1 Jia Li http://www.stat.psu.edu/∼jiali
21 .Mixture Models Then each summand in Q(θ |θ) is E log(ayi ) + log φ(xi | µyi , Σyi ) | xi , θ K K = pi,k log ak + pi,k log φ(xi | µk , Σk ) . k=1 k=1 Note that we cannot see the direct effect of θ in the above equation, but pi,k are computed using θ, i.e, the current parameters. θ includes the updated parameters. Jia Li http://www.stat.psu.edu/∼jiali
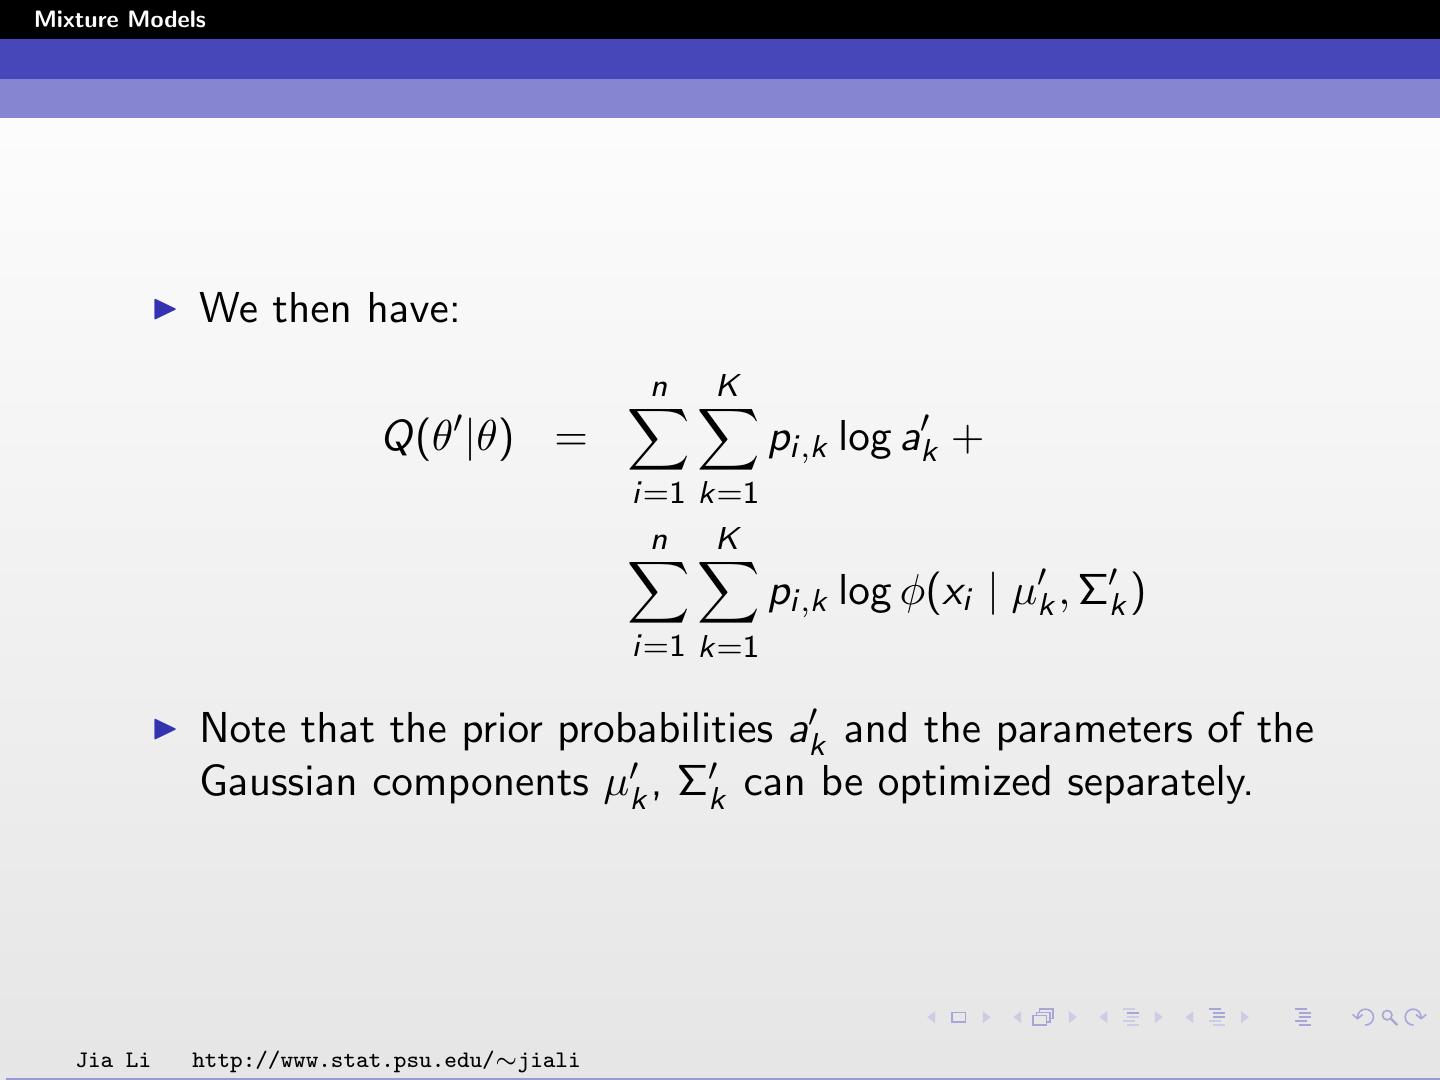
22 .Mixture Models We then have: n K Q(θ |θ) = pi,k log ak + i=1 k=1 n K pi,k log φ(xi | µk , Σk ) i=1 k=1 Note that the prior probabilities ak and the parameters of the Gaussian components µk , Σk can be optimized separately. Jia Li http://www.stat.psu.edu/∼jiali
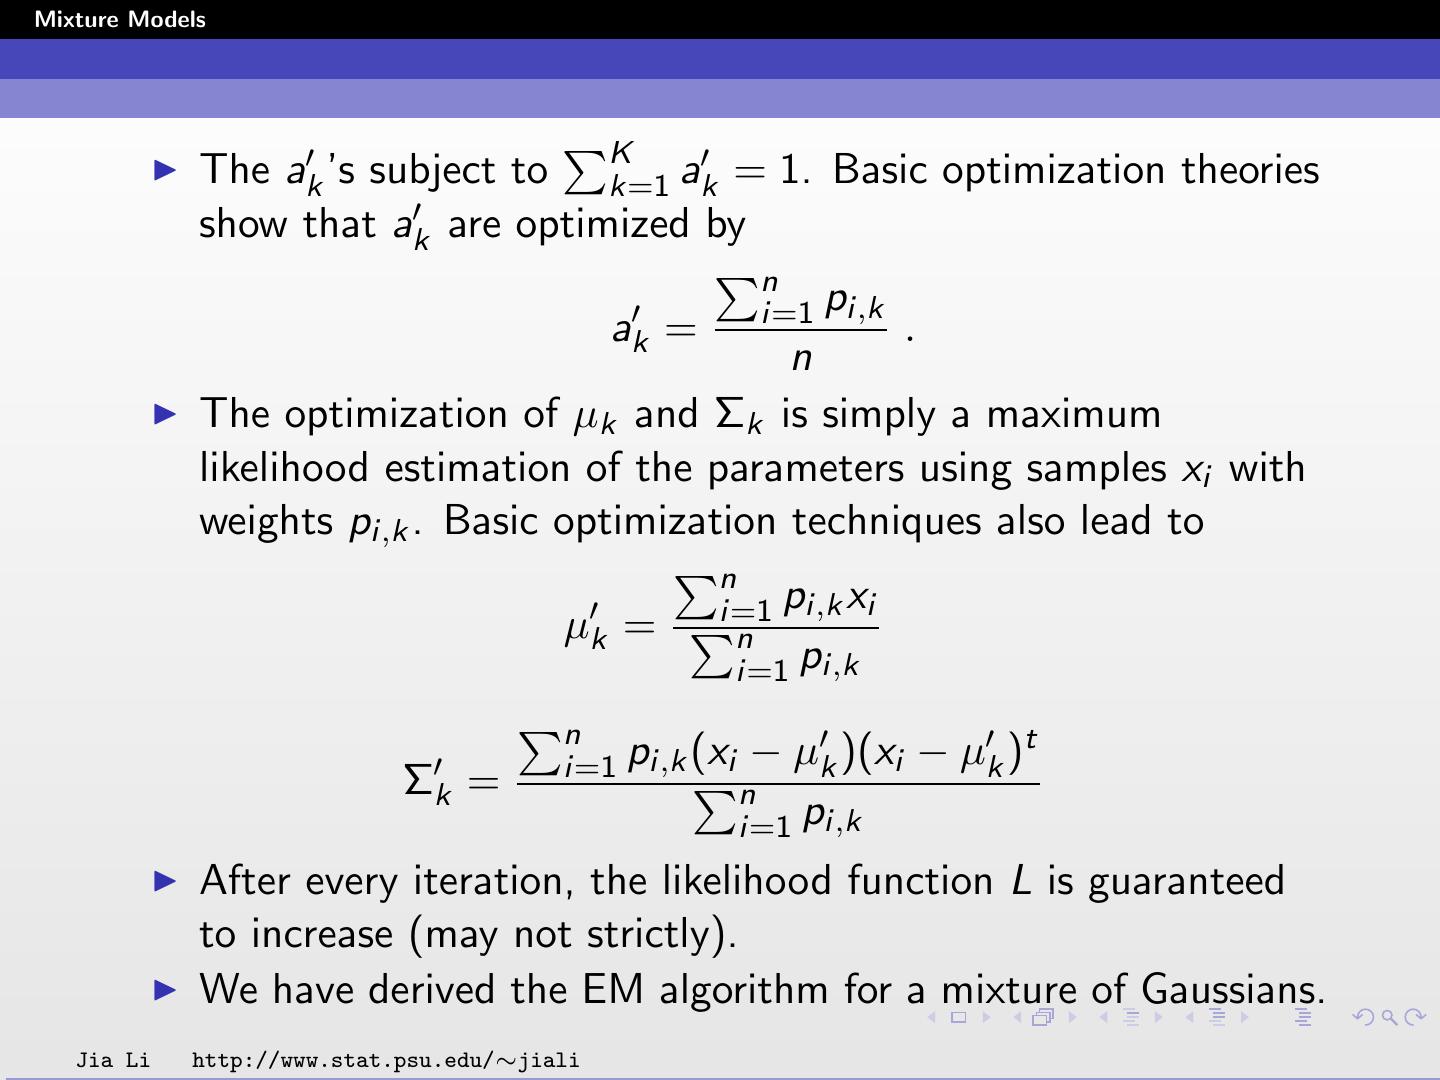
23 .Mixture Models The ak ’s subject to Kk=1 ak = 1. Basic optimization theories show that ak are optimized by n i=1 pi,k ak = . n The optimization of µk and Σk is simply a maximum likelihood estimation of the parameters using samples xi with weights pi,k . Basic optimization techniques also lead to n i=1 pi,k xi µk = n i=1 pi,k n i=1 pi,k (xi − µk )(xi − µk )t Σk = n i=1 pi,k After every iteration, the likelihood function L is guaranteed to increase (may not strictly). We have derived the EM algorithm for a mixture of Gaussians. Jia Li http://www.stat.psu.edu/∼jiali
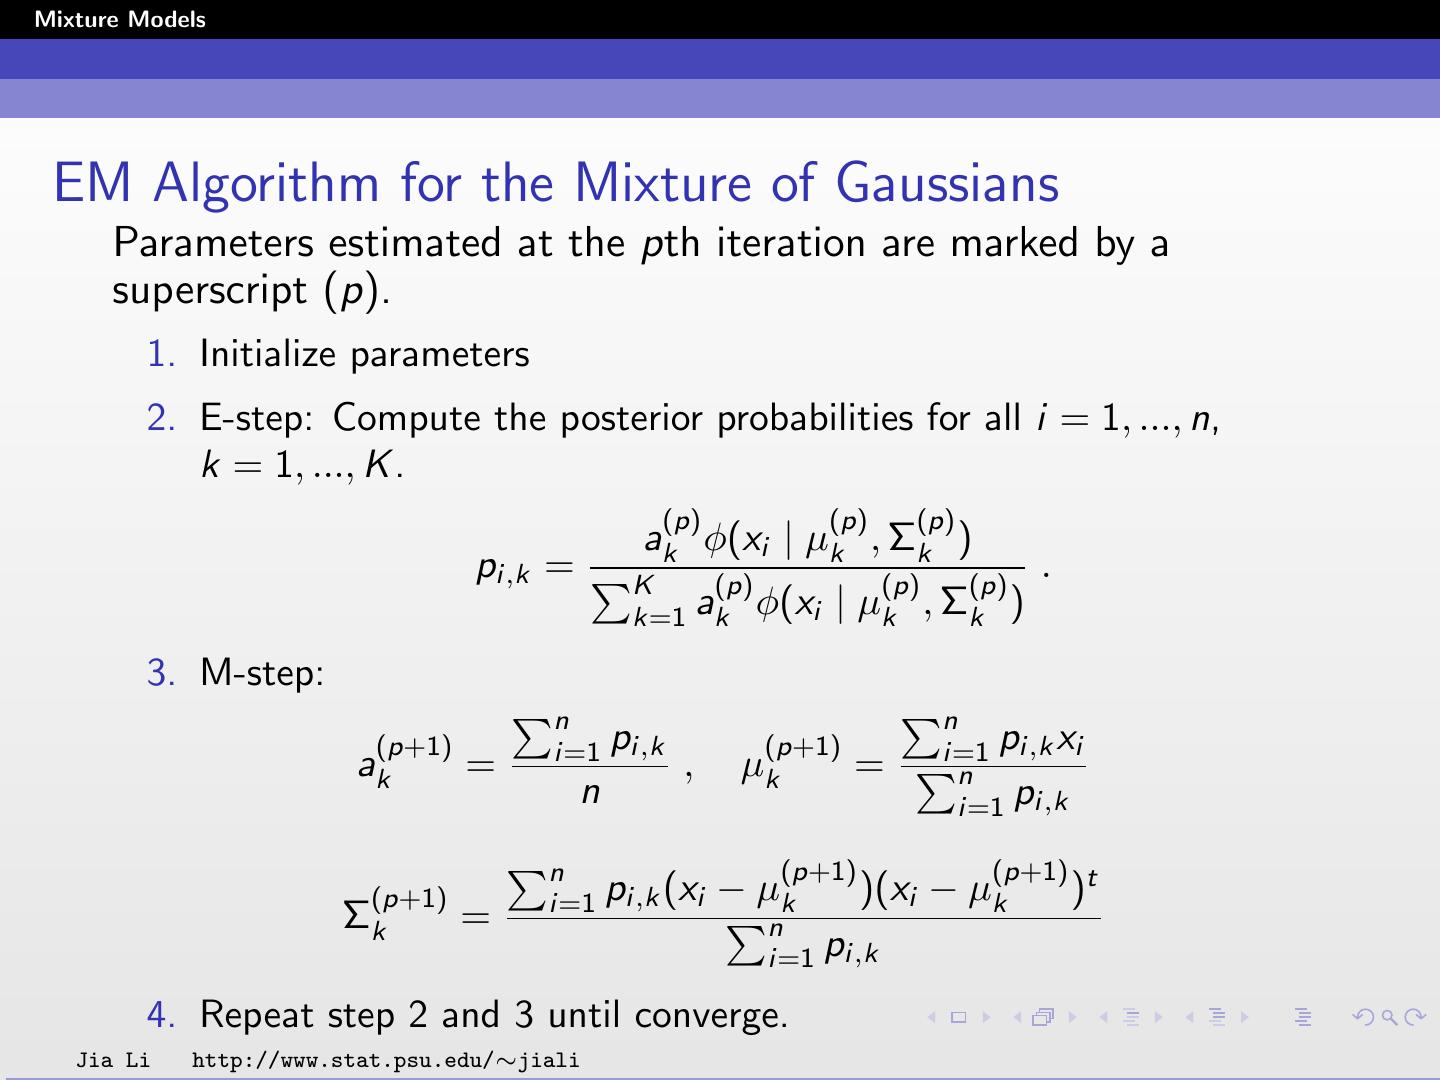
24 .Mixture Models EM Algorithm for the Mixture of Gaussians Parameters estimated at the pth iteration are marked by a superscript (p). 1. Initialize parameters 2. E-step: Compute the posterior probabilities for all i = 1, ..., n, k = 1, ..., K . (p) (p) (p) ak φ(xi | µk , Σk ) pi,k = K (p) (p) (p) . k=1 ak φ(xi | µk , Σk ) 3. M-step: n n (p+1) i=1 pi,k (p+1) i=1 pi,k xi ak = , µk = n n i=1 pi,k n (p+1) (p+1) t (p+1) i=1 pi,k (xi − µk )(xi − µk ) Σk = n i=1 pi,k 4. Repeat step 2 and 3 until converge. Jia Li http://www.stat.psu.edu/∼jiali
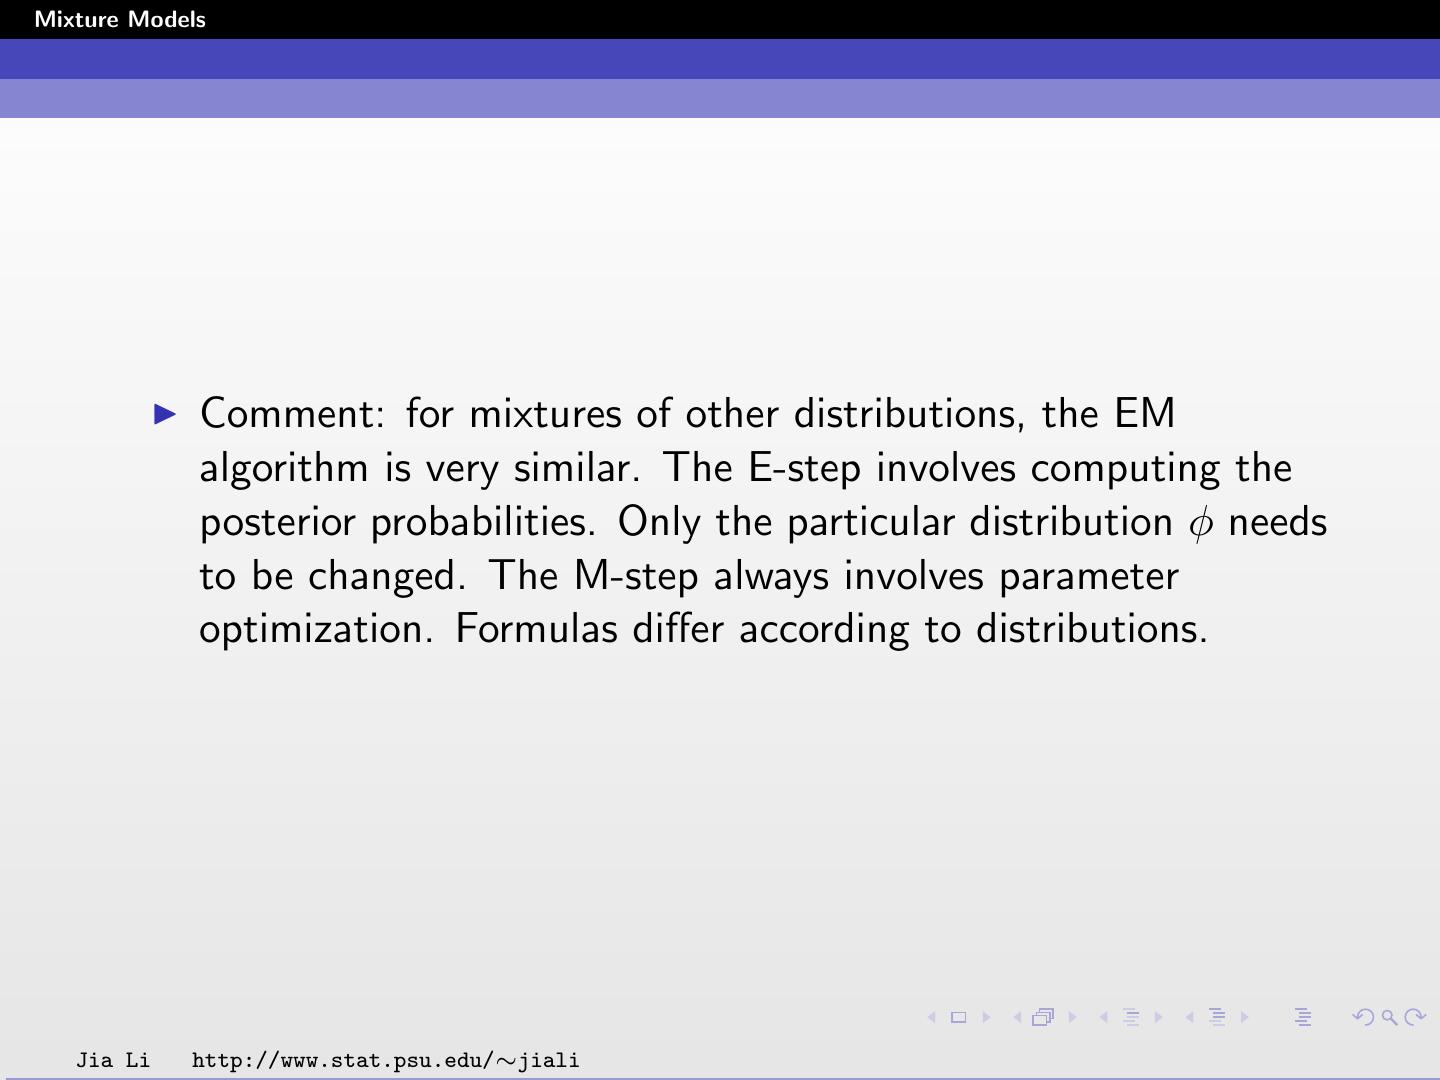
25 .Mixture Models Comment: for mixtures of other distributions, the EM algorithm is very similar. The E-step involves computing the posterior probabilities. Only the particular distribution φ needs to be changed. The M-step always involves parameter optimization. Formulas differ according to distributions. Jia Li http://www.stat.psu.edu/∼jiali
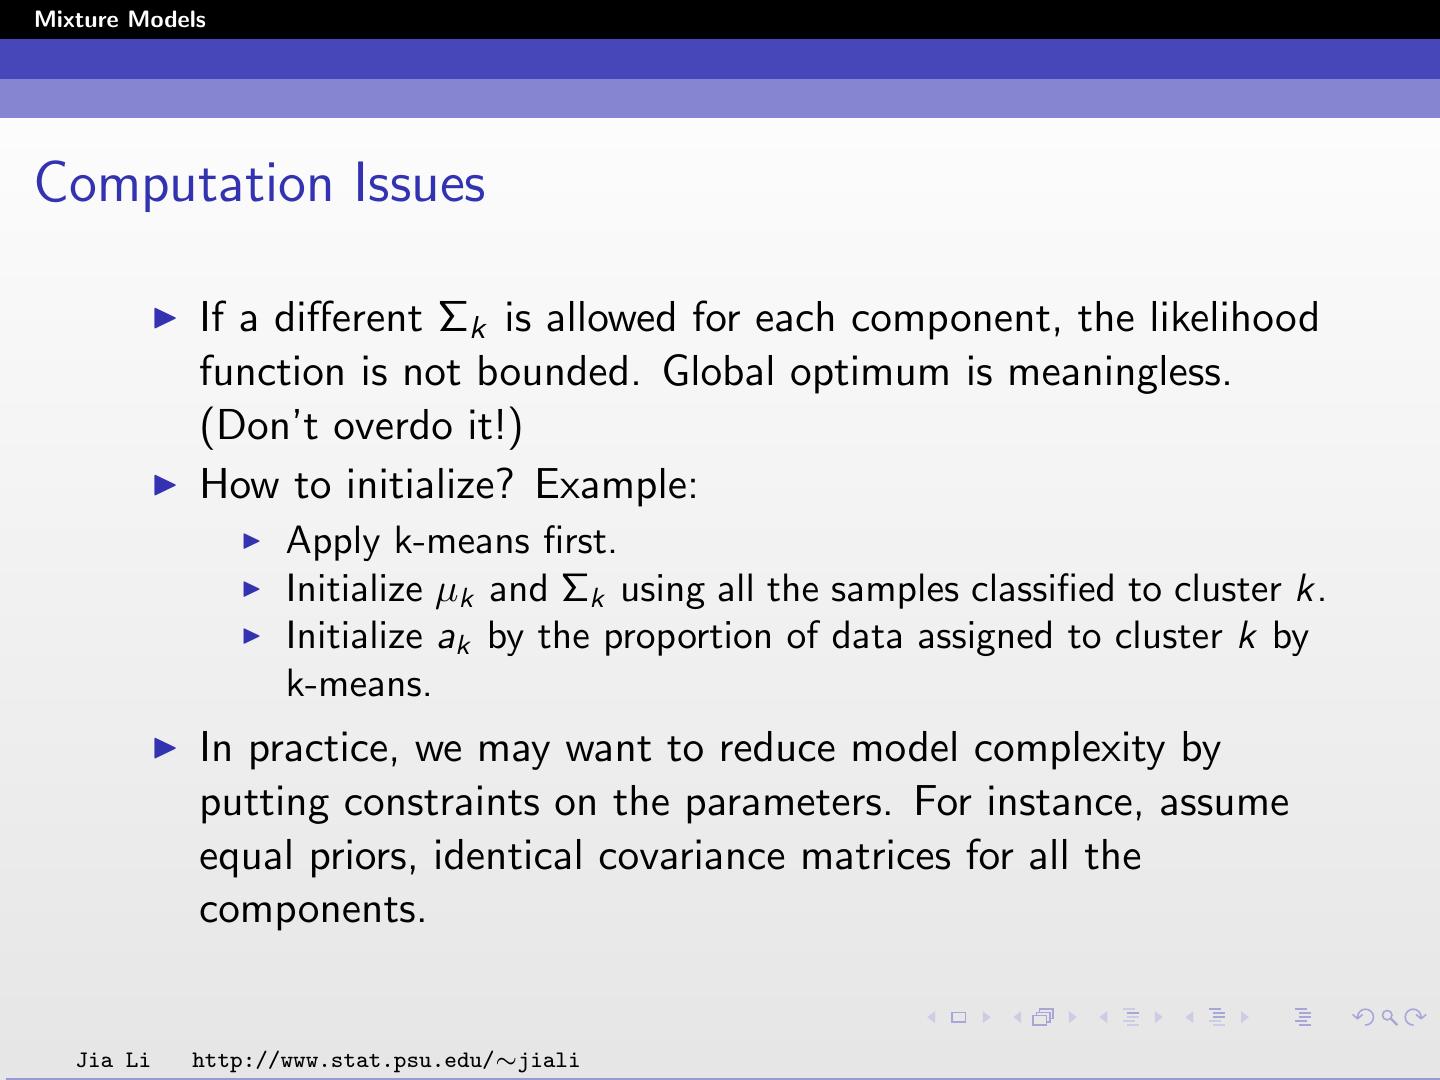
26 .Mixture Models Computation Issues If a different Σk is allowed for each component, the likelihood function is not bounded. Global optimum is meaningless. (Don’t overdo it!) How to initialize? Example: Apply k-means first. Initialize µk and Σk using all the samples classified to cluster k. Initialize ak by the proportion of data assigned to cluster k by k-means. In practice, we may want to reduce model complexity by putting constraints on the parameters. For instance, assume equal priors, identical covariance matrices for all the components. Jia Li http://www.stat.psu.edu/∼jiali
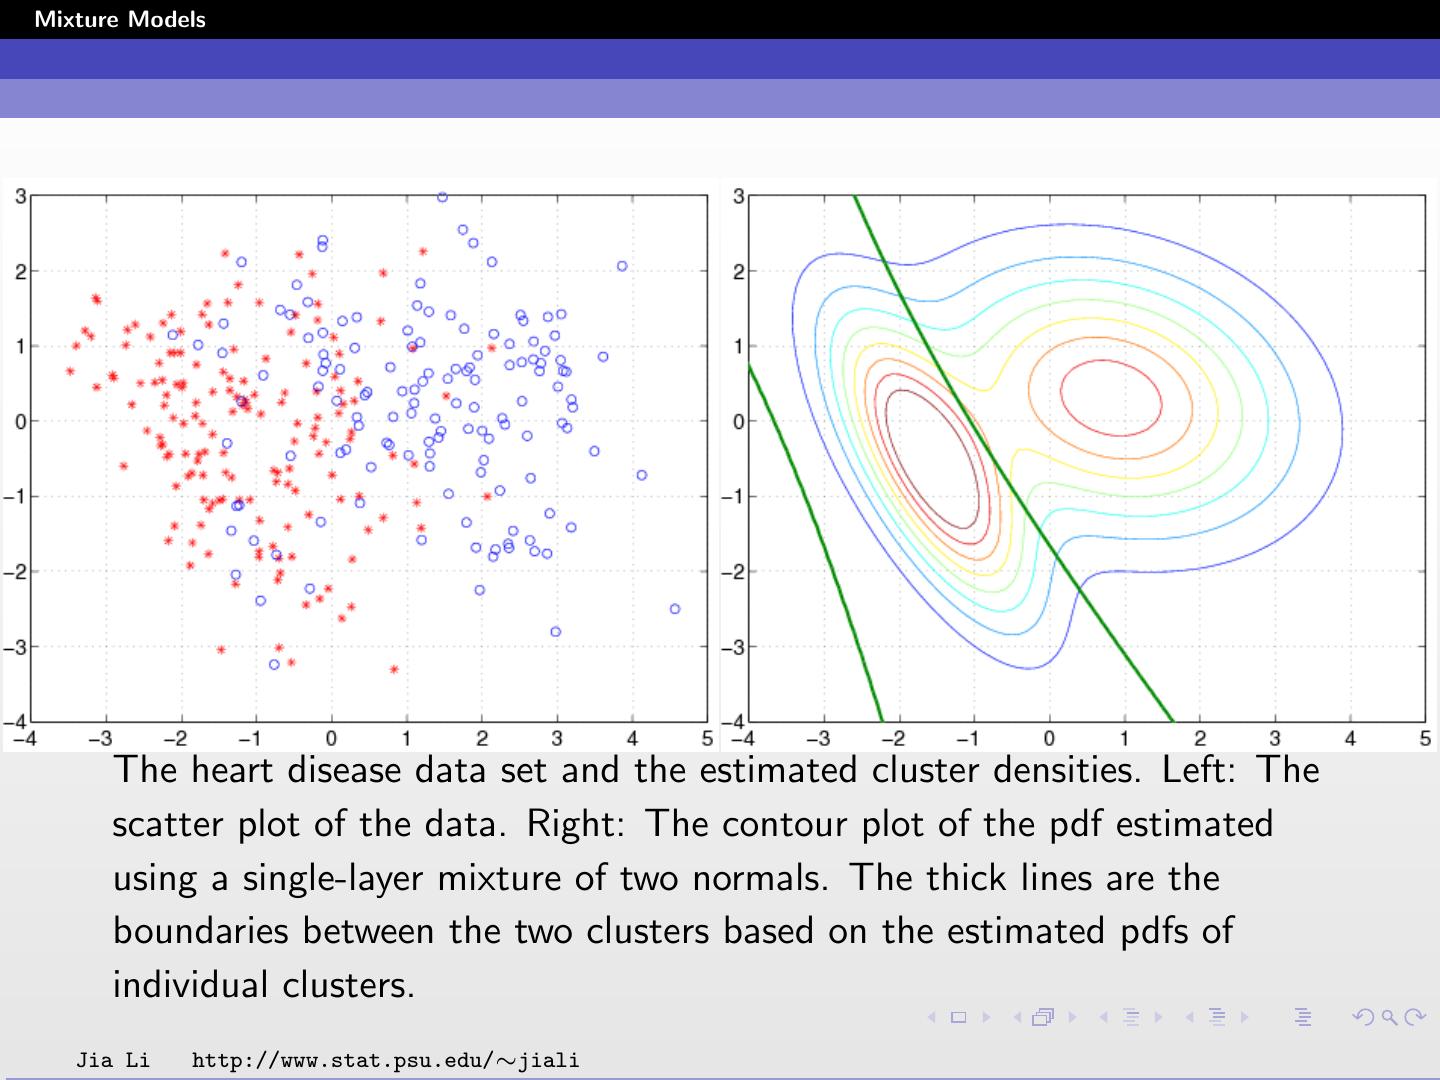
27 .Mixture Models Examples The heart disease data set is taken from the UCI machine learning database repository. There are 297 cases (samples) in the data set, of which 137 have heart diseases. Each sample contains 13 quantitative variables, including cholesterol, max heart rate, etc. We remove the mean of each variable and normalize it to yield unit variance. data are projected onto the plane spanned by the two most dominant principal component directions. A two-component Gaussian mixture is fit. Jia Li http://www.stat.psu.edu/∼jiali
28 .Mixture Models The heart disease data set and the estimated cluster densities. Left: The scatter plot of the data. Right: The contour plot of the pdf estimated using a single-layer mixture of two normals. The thick lines are the boundaries between the two clusters based on the estimated pdfs of individual clusters. Jia Li http://www.stat.psu.edu/∼jiali
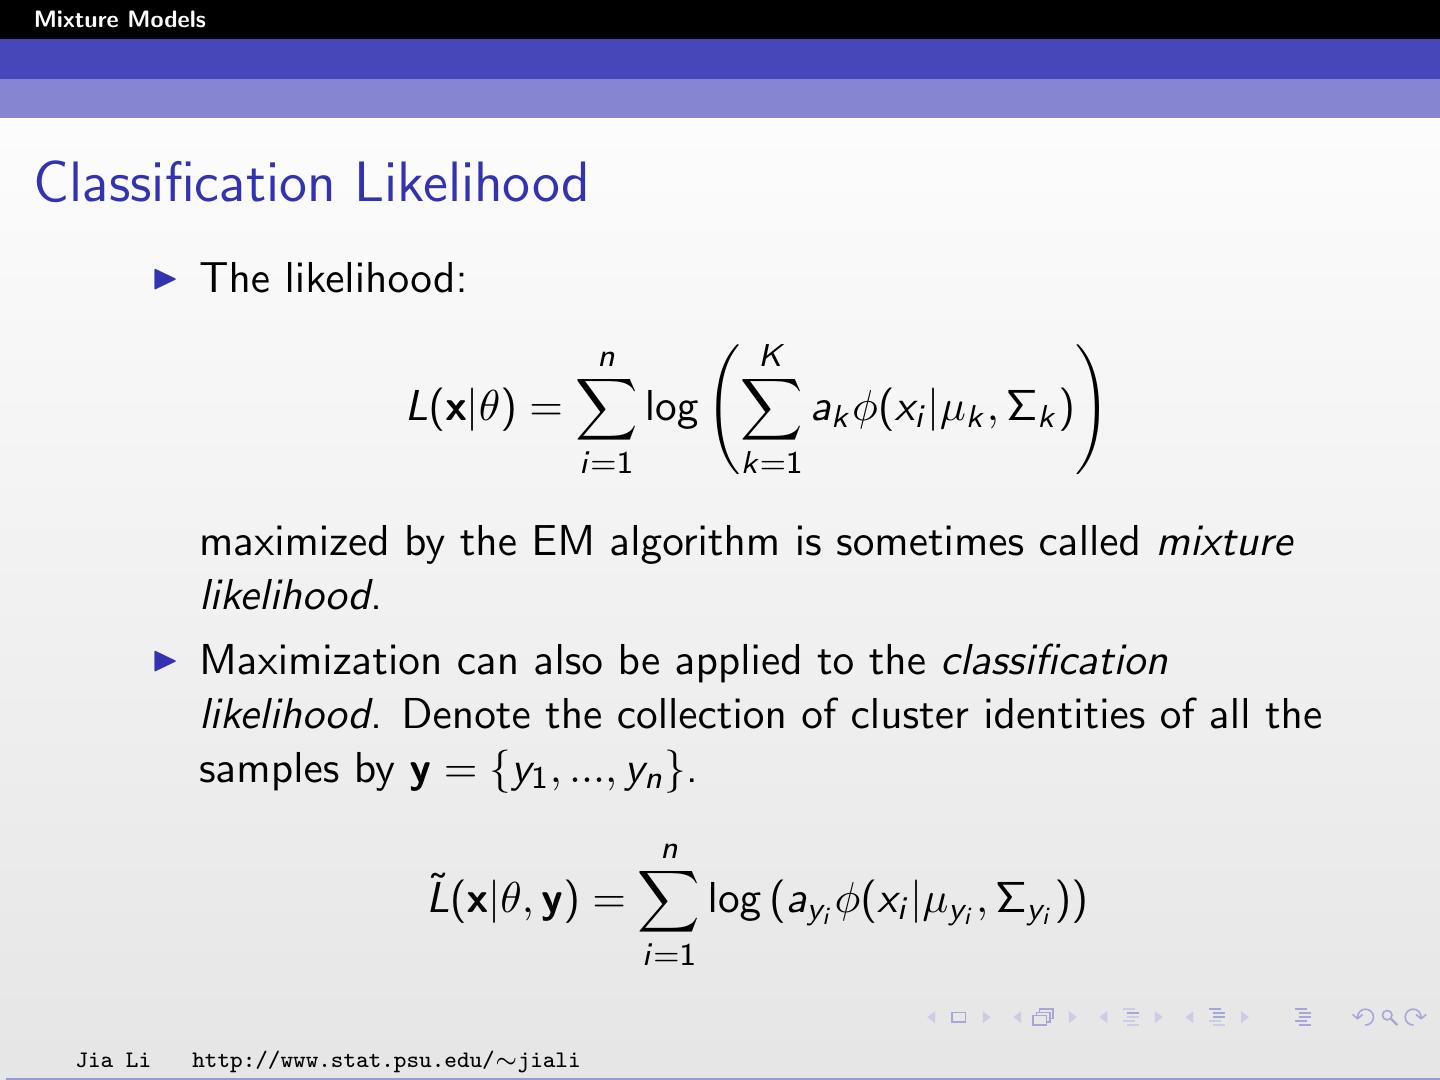
29 .Mixture Models Classification Likelihood The likelihood: n K L(x|θ) = log ak φ(xi |µk , Σk ) i=1 k=1 maximized by the EM algorithm is sometimes called mixture likelihood. Maximization can also be applied to the classification likelihood. Denote the collection of cluster identities of all the samples by y = {y1 , ..., yn }. n ˜ L(x|θ, y) = log (ayi φ(xi |µyi , Σyi )) i=1 Jia Li http://www.stat.psu.edu/∼jiali


