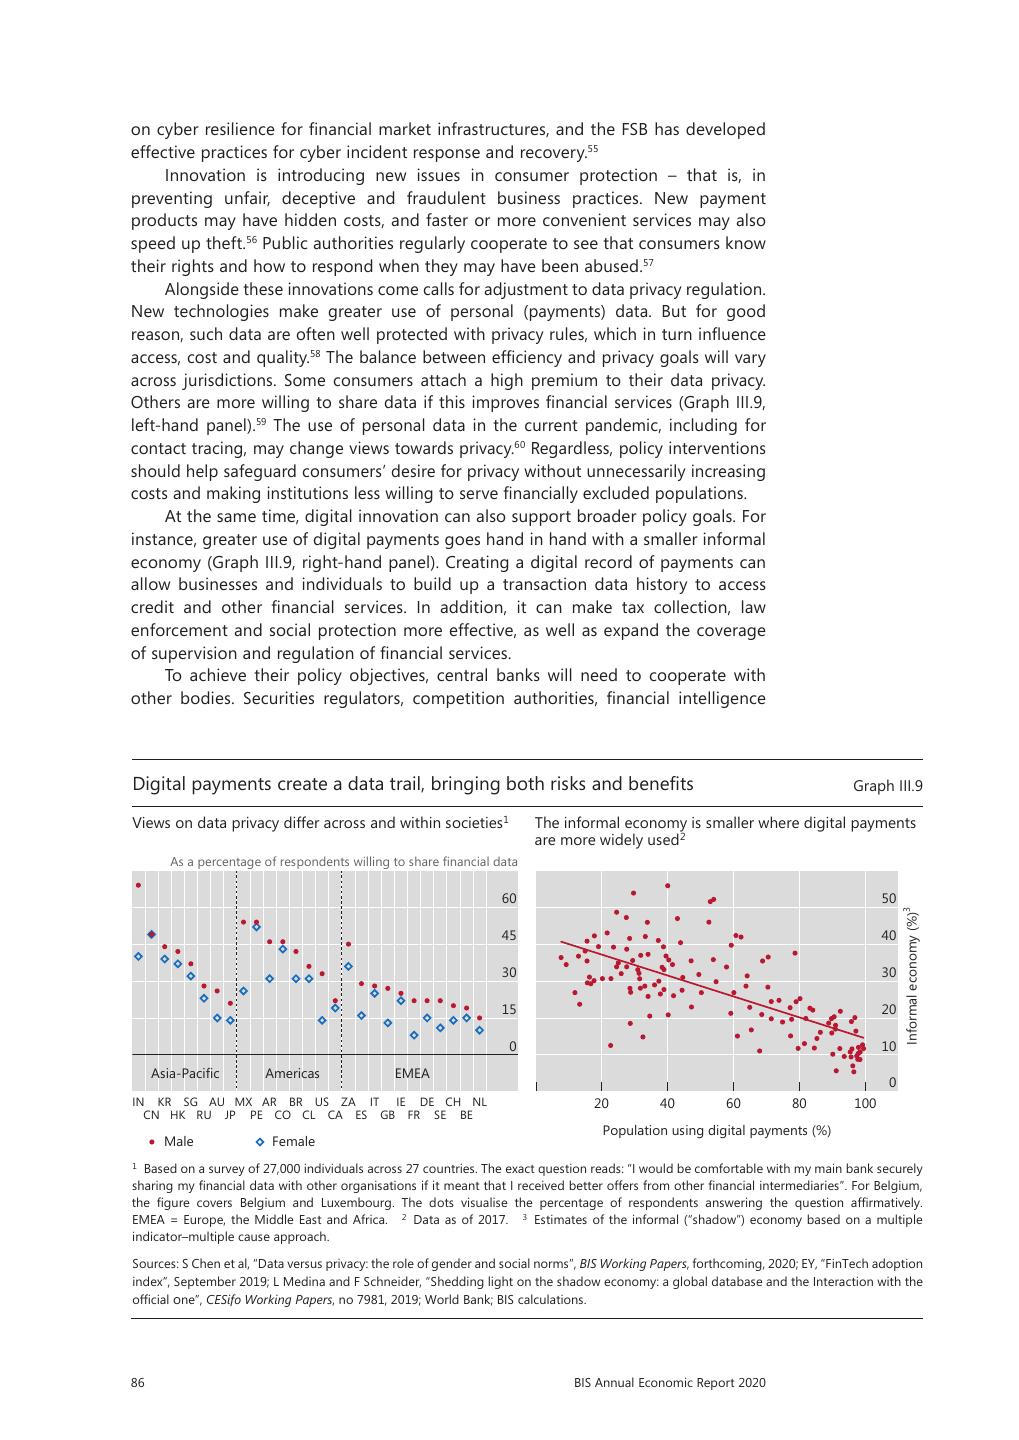
- 快召唤伙伴们来围观吧
- 微博 QQ QQ空间 贴吧
- 文档嵌入链接
- 复制
- 微信扫一扫分享
- 已成功复制到剪贴板
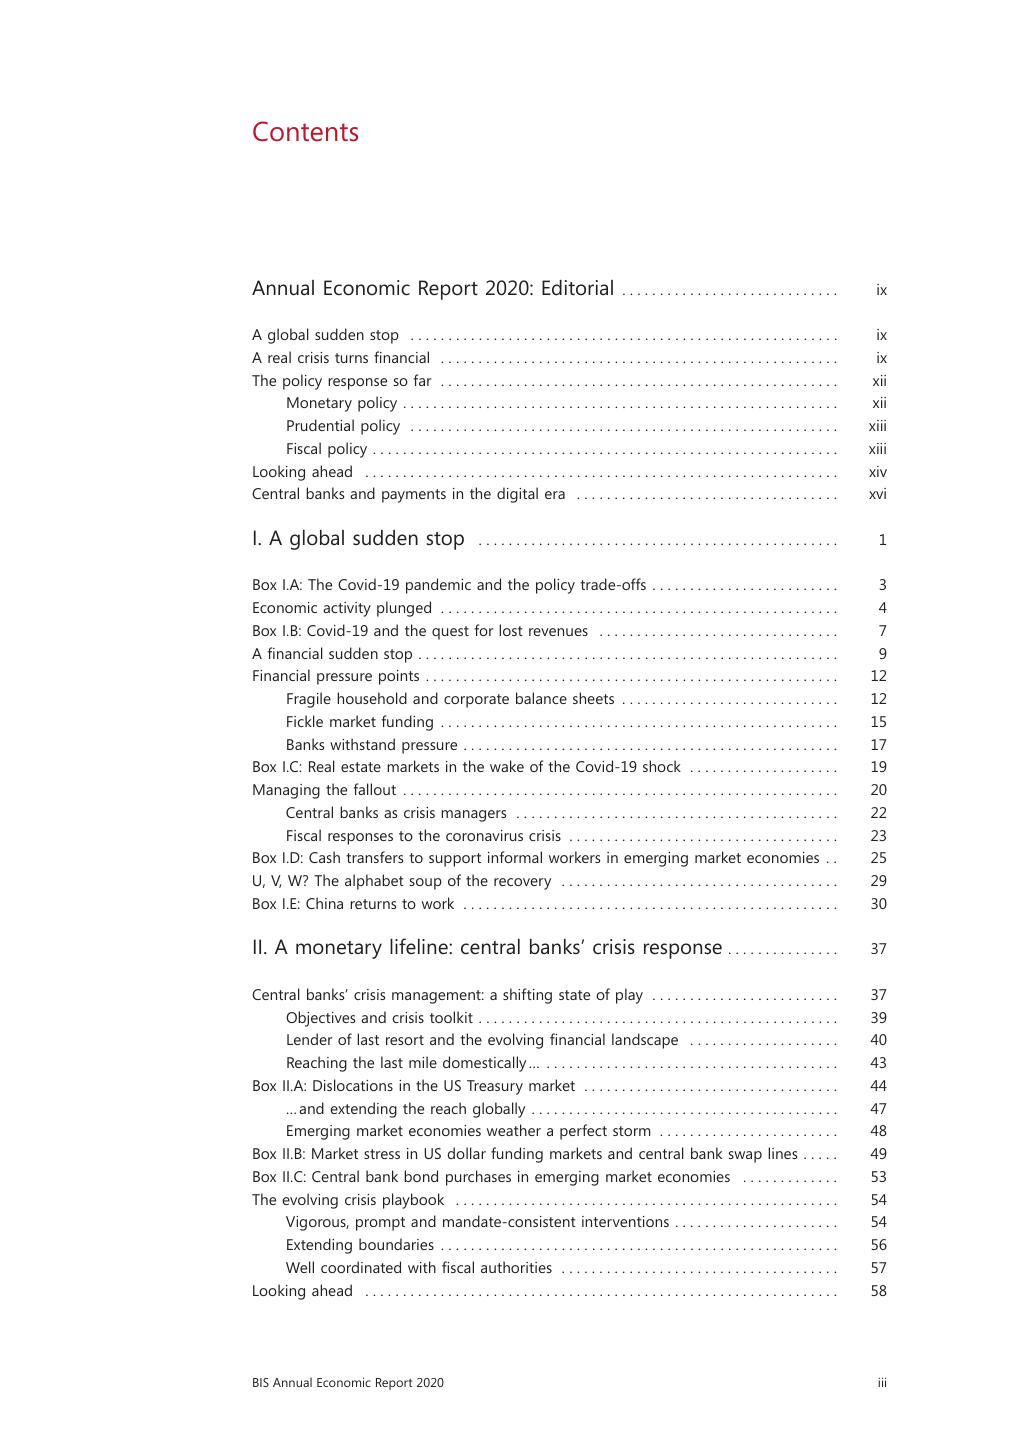
年度经济报告
年度经济报告
展开查看详情
1 . BIS Annual Economic Report June 2020
2 .每日免费获取报告 1、每日微信群内分享7+最新重磅报告; 2、每日分享当日华尔街日报、金融时报; 3、每周分享经济学人 4、行研报告均为公开版,权利归原作者 所有,起点财经仅分发做内部学习。 扫一扫二维码 关注公号 回复:研究报告 加入“起点财经”微信群
3 .© Bank for International Settlements 2020. All rights reserved. Limited extracts may be reproduced or translated provided the source is stated. www.bis.org email@bis.org Follow us
4 . BIS Annual Economic Report June 2020 Promoting global monetary and financial stability mRrNnPvNxP8O8Q7NmOoOoMoOkPqQqPeRoOpO8OrQsMvPmNmOMYnQpR
5 .This publication is available on the BIS website (www.bis.org/publ/arpdf/ar2020e.htm). © Bank for International Settlements 2020. All rights reserved. Limited extracts may be reproduced or translated provided the source is stated. ISSN 2616-9428 (print) ISSN 2616-9436 (online) ISBN 978-92-9259-392-6 (print) ISBN 978-92-9259-393-3 (online)
6 .Contents Annual Economic Report 2020: Editorial . . . . . . . . . . . . . . . . . . . . . . . . . . . . . ix A global sudden stop . . . . . . . . . . . . . . . . . . . . . . . . . . . . . . . . . . . . . . . . . . . . . . . . . . . . . . . . . ix A real crisis turns financial . . . . . . . . . . . . . . . . . . . . . . . . . . . . . . . . . . . . . . . . . . . . . . . . . . . . . ix The policy response so far . . . . . . . . . . . . . . . . . . . . . . . . . . . . . . . . . . . . . . . . . . . . . . . . . . . . . xii Monetary policy . . . . . . . . . . . . . . . . . . . . . . . . . . . . . . . . . . . . . . . . . . . . . . . . . . . . . . . . . . xii Prudential policy . . . . . . . . . . . . . . . . . . . . . . . . . . . . . . . . . . . . . . . . . . . . . . . . . . . . . . . . . xiii Fiscal policy . . . . . . . . . . . . . . . . . . . . . . . . . . . . . . . . . . . . . . . . . . . . . . . . . . . . . . . . . . . . . . xiii Looking ahead . . . . . . . . . . . . . . . . . . . . . . . . . . . . . . . . . . . . . . . . . . . . . . . . . . . . . . . . . . . . . . . xiv Central banks and payments in the digital era . . . . . . . . . . . . . . . . . . . . . . . . . . . . . . . . . . . xvi I. A global sudden stop . . . . . . . . . . . . . . . . . . . . . . . . . . . . . . . . . . . . . . . . . . . . . . . . 1 Box I.A: The Covid-19 pandemic and the policy trade-offs . . . . . . . . . . . . . . . . . . . . . . . . . 3 Economic activity plunged . . . . . . . . . . . . . . . . . . . . . . . . . . . . . . . . . . . . . . . . . . . . . . . . . . . . . 4 Box I.B: Covid-19 and the quest for lost revenues . . . . . . . . . . . . . . . . . . . . . . . . . . . . . . . . 7 A financial sudden stop . . . . . . . . . . . . . . . . . . . . . . . . . . . . . . . . . . . . . . . . . . . . . . . . . . . . . . . . 9 Financial pressure points . . . . . . . . . . . . . . . . . . . . . . . . . . . . . . . . . . . . . . . . . . . . . . . . . . . . . . . 12 Fragile household and corporate balance sheets . . . . . . . . . . . . . . . . . . . . . . . . . . . . . 12 Fickle market funding . . . . . . . . . . . . . . . . . . . . . . . . . . . . . . . . . . . . . . . . . . . . . . . . . . . . . 15 Banks withstand pressure . . . . . . . . . . . . . . . . . . . . . . . . . . . . . . . . . . . . . . . . . . . . . . . . . . 17 Box I.C: Real estate markets in the wake of the Covid-19 shock . . . . . . . . . . . . . . . . . . . . 19 Managing the fallout . . . . . . . . . . . . . . . . . . . . . . . . . . . . . . . . . . . . . . . . . . . . . . . . . . . . . . . . . . 20 Central banks as crisis managers . . . . . . . . . . . . . . . . . . . . . . . . . . . . . . . . . . . . . . . . . . . 22 Fiscal responses to the coronavirus crisis . . . . . . . . . . . . . . . . . . . . . . . . . . . . . . . . . . . . 23 Box I.D: Cash transfers to support informal workers in emerging market economies . . 25 U, V, W? The alphabet soup of the recovery . . . . . . . . . . . . . . . . . . . . . . . . . . . . . . . . . . . . . 29 Box I.E: China returns to work . . . . . . . . . . . . . . . . . . . . . . . . . . . . . . . . . . . . . . . . . . . . . . . . . . 30 II. A monetary lifeline: central banks’ crisis response . . . . . . . . . . . . . . . 37 Central banks’ crisis management: a shifting state of play . . . . . . . . . . . . . . . . . . . . . . . . . 37 Objectives and crisis toolkit . . . . . . . . . . . . . . . . . . . . . . . . . . . . . . . . . . . . . . . . . . . . . . . . 39 Lender of last resort and the evolving financial landscape . . . . . . . . . . . . . . . . . . . . 40 Reaching the last mile domestically … . . . . . . . . . . . . . . . . . . . . . . . . . . . . . . . . . . . . . . . 43 Box II.A: Dislocations in the US Treasury market . . . . . . . . . . . . . . . . . . . . . . . . . . . . . . . . . . 44 … and extending the reach globally . . . . . . . . . . . . . . . . . . . . . . . . . . . . . . . . . . . . . . . . . 47 Emerging market economies weather a perfect storm . . . . . . . . . . . . . . . . . . . . . . . . 48 Box II.B: Market stress in US dollar funding markets and central bank swap lines . . . . . 49 Box II.C: Central bank bond purchases in emerging market economies . . . . . . . . . . . . . 53 The evolving crisis playbook . . . . . . . . . . . . . . . . . . . . . . . . . . . . . . . . . . . . . . . . . . . . . . . . . . . 54 Vigorous, prompt and mandate-consistent interventions . . . . . . . . . . . . . . . . . . . . . . 54 Extending boundaries . . . . . . . . . . . . . . . . . . . . . . . . . . . . . . . . . . . . . . . . . . . . . . . . . . . . . 56 Well coordinated with fiscal authorities . . . . . . . . . . . . . . . . . . . . . . . . . . . . . . . . . . . . . 57 Looking ahead . . . . . . . . . . . . . . . . . . . . . . . . . . . . . . . . . . . . . . . . . . . . . . . . . . . . . . . . . . . . . . . 58 BIS Annual Economic Report 2020 iii
7 .Box II.D: How much additional lending could the release of bank capital buffers support? . . . . . . . . . . . . . . . . . . . . . . . . . . . . . . . . . . . . . . . . . . . . . . . . . . . . . . . . . . . . . . . . 59 Box II.E: Monetary financing: What is it (not)? And is it a step too far? . . . . . . . . . . . . . . 63 III. Central banks and payments in the digital era . . . . . . . . . . . . . . . . . . 67 Introduction . . . . . . . . . . . . . . . . . . . . . . . . . . . . . . . . . . . . . . . . . . . . . . . . . . . . . . . . . . . . . . . . . . 67 Money and payment systems: the foundation . . . . . . . . . . . . . . . . . . . . . . . . . . . . . . . . . . . . 68 Box III.A: The payment system, trust and central banks . . . . . . . . . . . . . . . . . . . . . . . . . . . . 70 Today’s payment systems: key facts . . . . . . . . . . . . . . . . . . . . . . . . . . . . . . . . . . . . . . . . . . . . . 70 Access, costs and quality . . . . . . . . . . . . . . . . . . . . . . . . . . . . . . . . . . . . . . . . . . . . . . . . . . 70 Box III.B: The payment system deconstructed . . . . . . . . . . . . . . . . . . . . . . . . . . . . . . . . . . . . 71 Box III.C: The evolution of wholesale payment systems . . . . . . . . . . . . . . . . . . . . . . . . . . . . 73 Industrial organisation: network effects in payments . . . . . . . . . . . . . . . . . . . . . . . . . . 75 Box III.D: Payments amid the Covid-19 pandemic . . . . . . . . . . . . . . . . . . . . . . . . . . . . . . . . . 76 Central bank policies to improve efficiency . . . . . . . . . . . . . . . . . . . . . . . . . . . . . . . . . . . . . . 79 As operator: providing public infrastructures . . . . . . . . . . . . . . . . . . . . . . . . . . . . . . . . 79 As catalyst: promoting interoperability . . . . . . . . . . . . . . . . . . . . . . . . . . . . . . . . . . . . . . 81 As overseer: guiding and regulating . . . . . . . . . . . . . . . . . . . . . . . . . . . . . . . . . . . . . . . . 83 Ensuring safety and integrity . . . . . . . . . . . . . . . . . . . . . . . . . . . . . . . . . . . . . . . . . . . . . . 85 CBDC: designing safe and open payments for the digital economy . . . . . . . . . . . . 87 Conclusion . . . . . . . . . . . . . . . . . . . . . . . . . . . . . . . . . . . . . . . . . . . . . . . . . . . . . . . . . . . . . . . . . . . 89 Box III.E: Designing retail CBDC: shaping the future of payments . . . . . . . . . . . . . . . . . . . 91 iv BIS Annual Economic Report 2020
8 .Graphs I.1 Covid-19 pandemic: the timeline . . . . . . . . . . . . . . . . . . . . . . . . . . . . . . . . . . . . . . . . . . 2 I.2 Containment measures hit economic activity . . . . . . . . . . . . . . . . . . . . . . . . . . . . . . . 5 I.3 Analysts expect a very deep recession in 2020 . . . . . . . . . . . . . . . . . . . . . . . . . . . . . . 5 I.4 Unemployment soars . . . . . . . . . . . . . . . . . . . . . . . . . . . . . . . . . . . . . . . . . . . . . . . . . . . . . 6 I.5 Staggered shutdowns and traffic bottlenecks disrupt global supply chains . . . . . 9 I.6 Oil prices drag down economic activity, exports and fiscal revenues . . . . . . . . . . . 10 I.7 Markets faced several weeks of high volatility as the pandemic worsened . . . . . . 11 I.8 A sudden stop in market funding . . . . . . . . . . . . . . . . . . . . . . . . . . . . . . . . . . . . . . . . . . 12 I.9 Deleveraging left households in better shape than in 2008 . . . . . . . . . . . . . . . . . . . 13 I.10 Corporate strength and vulnerability . . . . . . . . . . . . . . . . . . . . . . . . . . . . . . . . . . . . . . . 14 I.11 EMEs vulnerable to tightening in global financial conditions . . . . . . . . . . . . . . . . . . 15 I.12 Rating agencies downgrade corporates; investors withdraw funds . . . . . . . . . . . . . 16 I.13 Banks entered the Covid-19 crisis with significantly more capital than pre-GFC . 17 I.14 Banks under pressure . . . . . . . . . . . . . . . . . . . . . . . . . . . . . . . . . . . . . . . . . . . . . . . . . . . . 18 I.15 Swift and forceful response . . . . . . . . . . . . . . . . . . . . . . . . . . . . . . . . . . . . . . . . . . . . . . . 22 I.16 Pledged fiscal packages . . . . . . . . . . . . . . . . . . . . . . . . . . . . . . . . . . . . . . . . . . . . . . . . . . 27 I.17 Institutional factors and corporate vulnerabilities drive the fiscal response . . . . . 27 I.18 Fiscal space is tight in some places . . . . . . . . . . . . . . . . . . . . . . . . . . . . . . . . . . . . . . . . 28 I.19 Fiscal deficits and debt ratios will soar . . . . . . . . . . . . . . . . . . . . . . . . . . . . . . . . . . . . . 28 II.1 Swift and forceful response . . . . . . . . . . . . . . . . . . . . . . . . . . . . . . . . . . . . . . . . . . . . . . . 38 II.2 Post-Great Financial Crisis changes in financial structure and tensions in money market funds . . . . . . . . . . . . . . . . . . . . . . . . . . . . . . . . . . . . . . . . . . . . . . . . . . . . . . . . . . . . 41 II.3 Asset purchases alleviate strains . . . . . . . . . . . . . . . . . . . . . . . . . . . . . . . . . . . . . . . . . . . 42 II.4 Little divergence between policy and reference rates amid funding tensions . . . 43 II.5 Low profitability and price-to-book ratios hinder banks’ willingness to lend . . . . 46 II.6 Bank credit line buffers . . . . . . . . . . . . . . . . . . . . . . . . . . . . . . . . . . . . . . . . . . . . . . . . . . . 47 II.7 Global US dollar funding squeeze . . . . . . . . . . . . . . . . . . . . . . . . . . . . . . . . . . . . . . . . . 48 II.8 Perfect storm in emerging market economies . . . . . . . . . . . . . . . . . . . . . . . . . . . . . . . 51 II.9 Changing nature of foreign exposure . . . . . . . . . . . . . . . . . . . . . . . . . . . . . . . . . . . . . . 52 II.10 Central banks’ rapid crisis response . . . . . . . . . . . . . . . . . . . . . . . . . . . . . . . . . . . . . . . . 55 II.11 Near-term inflation risks tilted downwards and outlook more uncertain . . . . . . . 61 II.12 Growing central bank presence . . . . . . . . . . . . . . . . . . . . . . . . . . . . . . . . . . . . . . . . . . . . 62 III.1 Financial inclusion and access are improving, but gaps remain . . . . . . . . . . . . . . . . 72 III.2 Costs of payments are higher for some economies, users and instruments . . . . . 74 III.3 Two-sided markets as an open marketplace . . . . . . . . . . . . . . . . . . . . . . . . . . . . . . . . 77 III.4 Digital platforms differ from traditional networks . . . . . . . . . . . . . . . . . . . . . . . . . . . . 78 III.5 Digital technologies can help support inclusion and convenience . . . . . . . . . . . . . 80 III.6 Merger and acquisition (M&A) activity by selected global payment platforms . . 83 III.7 Mandating change: policy interventions can lower payment costs . . . . . . . . . . . . . 84 III.8 Interchange fees are significantly lower after policy action . . . . . . . . . . . . . . . . . . . 85 III.9 Digital payments create a data trail, bringing both risks and benefits . . . . . . . . . . 86 III.10 CBDC: an increasingly likely option . . . . . . . . . . . . . . . . . . . . . . . . . . . . . . . . . . . . . . . . 88 Tables I.1 Selected central bank and prudential measures . . . . . . . . . . . . . . . . . . . . . . . . . . . . . 23 I.2 Elements of fiscal packages . . . . . . . . . . . . . . . . . . . . . . . . . . . . . . . . . . . . . . . . . . . . . . . 24 BIS Annual Economic Report 2020 v
9 .This Report went to press on 19–26 June 2020 using data available up to 12 June 2020. Conventions used in the Annual Economic Report std dev standard deviation $ US dollar unless specified otherwise mn million bn billion (thousand million) trn trillion (thousand billion) % pts percentage points bp basis points lhs, rhs left-hand scale, right-hand scale sa seasonally adjusted saar seasonally adjusted annual rate mom month on month yoy year on year qoq quarter on quarter ... not available . not applicable – nil or negligible Components may not sum to totals because of rounding. The term “country” as used in this publication also covers territorial entities that are not states as understood by international law and practice but for which data are separately and independently maintained. vi BIS Annual Economic Report 2020
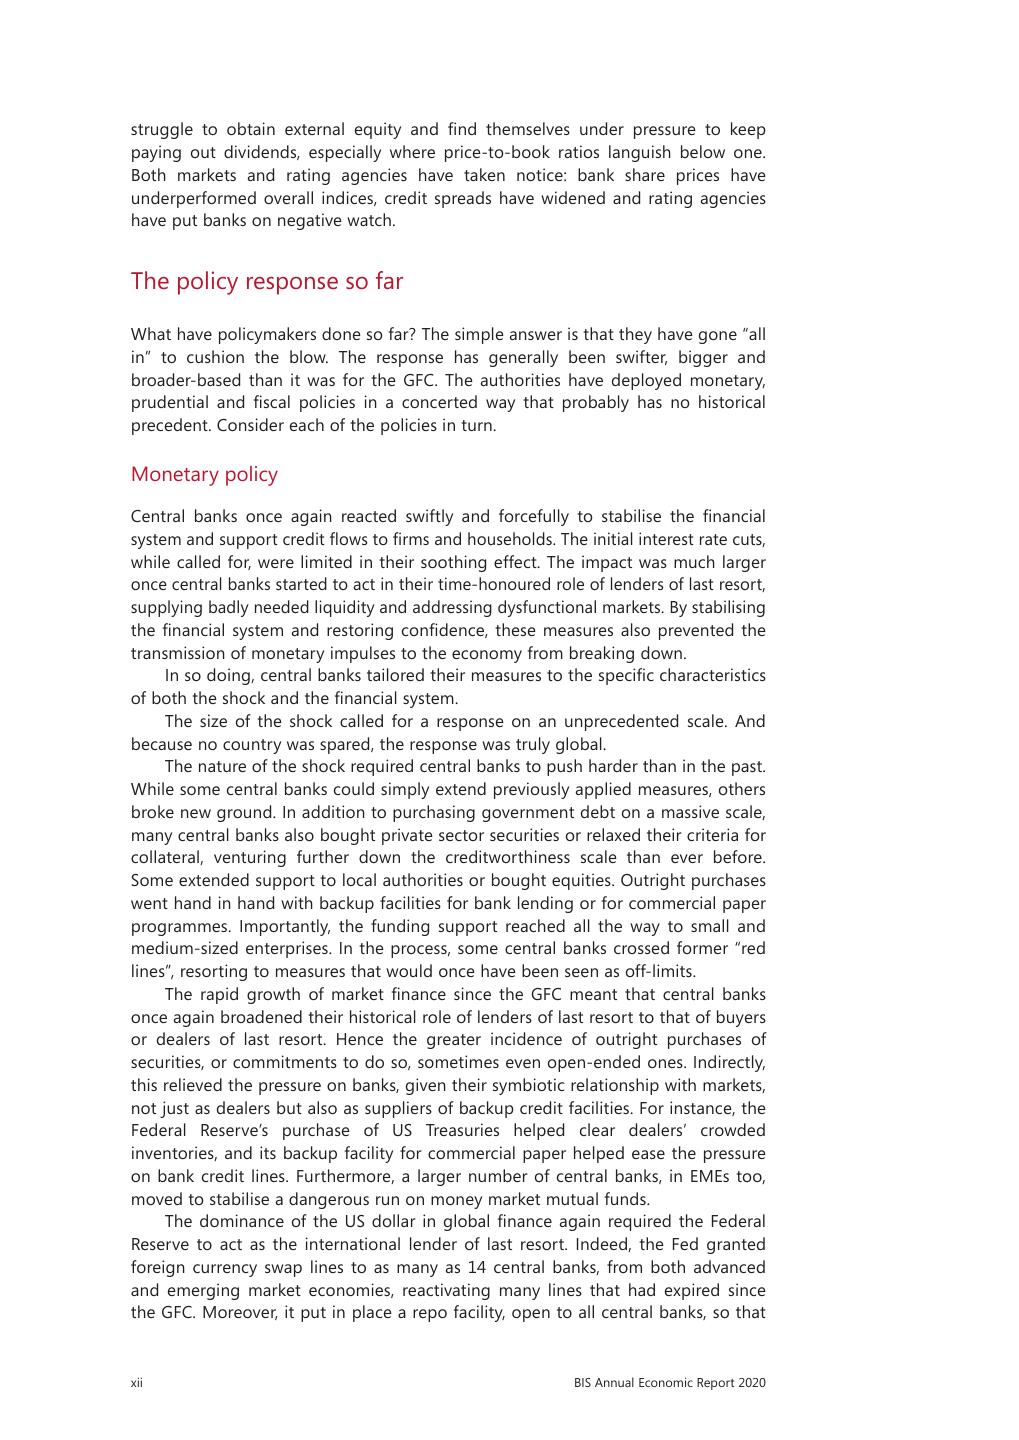
10 .Country codes AE United Arab Emirates GB United Kingdom NZ New Zealand AR Argentina GR Greece PA Panama AT Austria HK Hong Kong SAR PE Peru AU Australia HR Croatia PH Philippines BA Bosnia and HU Hungary PK Pakistan Herzegovina ID Indonesia PL Poland BE Belgium IE Ireland PT Portugal BG Bulgaria IL Israel QA Qatar BR Brazil IN India RO Romania CA Canada IS Iceland RU Russia CH Switzerland IT Italy RS Republic of Serbia CL Chile JP Japan SA Saudi Arabia CN China KR Korea SE Sweden CO Colombia KW Kuwait SG Singapore CY Republic of Cyprus KZ Kazakhstan SI Slovenia CZ Czech Republic LT Lithuania SK Slovakia DE Germany LU Luxembourg TH Thailand DK Denmark LV Latvia TR Turkey DO Dominican Republic LY Libya TW Chinese Taipei DZ Algeria MK North Macedonia US United States EA euro area MT Malta UY Uruguay EE Estonia MX Mexico VE Venezuela ES Spain MY Malaysia VN Vietnam EU European Union NG Nigeria ZA South Africa FI Finland NL Netherlands FR France NO Norway Currency codes AUD Australian dollar KRW Korean won BRL Brazilian real MXN Mexican peso CAD Canadian dollar NOK Norwegian krone CHF Swiss franc NZD New Zealand dollar CLP Chilean peso PEN Peruvian sol CNY (RMB) Chinese yuan (renminbi) PHP Philippine peso COP Colombian peso PLN Polish zloty CZK Czech koruna RUB Russian rouble EUR euro SEK Swedish krona GBP pound sterling THB Thai baht HUF Hungarian forint TRY Turkish lira IDR Indonesian rupiah USD US dollar INR Indian rupee ZAR South African rand JPY Japanese yen BIS Annual Economic Report 2020 vii
11 .Advanced economies (AEs): Australia, Canada, Denmark, the euro area, Japan, New Zealand, Norway, Sweden, Switzerland, the United Kingdom and the United States. Major AEs (G3): The euro area, Japan and the United States. Other AEs: Australia, Canada, Denmark, New Zealand, Norway, Sweden, Switzerland and the United Kingdom. Emerging market economies (EMEs): Argentina, Brazil, Chile, China, Chinese Taipei, Colombia, the Czech Republic, Hong Kong SAR, Hungary, India, Indonesia, Korea, Malaysia, Mexico, Peru, the Philippines, Poland, Russia, Saudi Arabia, Singapore, South Africa, Thailand and Turkey. Global: All AEs and EMEs, as listed. Commodity exporters (countries whose average share of commodities in export revenues in 2005–14 exceeded 40%): Argentina, Australia, Brazil, Canada, Chile, Colombia, Indonesia, New Zealand, Norway, Peru, Russia, Saudi Arabia and South Africa. Country aggregates used in graphs and tables may not cover all the countries listed, depending on data availability. viii BIS Annual Economic Report 2020
12 .Annual Economic Report 2020: Editorial A global sudden stop The past year has felt like an eternity. It is probably too early to tell, but future economic historians might consider the Covid-19 pandemic a defining moment of the 21st century. When, just over a decade ago, the Great Financial Crisis (GFC) hit the global economy, it was rightly considered such a moment. The pandemic’s legacy could be even deeper and longer-lasting. The economic impact of the coronavirus has been variously described as suspended animation, a hibernation or an induced coma for much of the global economy. These metaphors bring to mind two key features. First, this sudden stop has been extraordinarily abrupt. Economic activity has collapsed even more steeply than in the Great Depression, to even greater depths than those of the GFC. Many economies shrank by an annualised 25–40% in a single quarter, and some saw unemployment rates soar into the teens within a couple of months. Moreover, and unlike the GFC, the crisis has been truly global, sparing no country in the world. The collapse has elicited a monetary, a fiscal and, for the first time, a prudential response that exceeds in scale and scope the one to contain the GFC. And, again, central banks have acted as the first line of defence, pulling out all the stops in order to stabilise financial markets and the financial system more generally and to preserve the flow of credit to firms and households. Second – and this is what makes the crisis so unique – it is a policy-induced recession generated by repressing economic activity. It results from efforts to tackle a health emergency and to save lives through containment measures and social distancing – previously obscure terms that have thrust their way into our day-to- day vocabulary. This unprecedented configuration greatly heightens uncertainty about the economy’s future evolution. But, before turning to policy in detail, how has the economic crisis unfolded so far? In particular, what role have financial factors played? A real crisis turns financial The current economic crisis differs starkly from the GFC and previous financial crises. On this occasion, it was not the financial sector that toppled the real economy, but rather the real economy that has threatened to topple the financial sector, with potentially devastating knock-on effects as financial sector problems spill back onto the real economy. Non-financial firms were the first to take a hit, absorbing the full brunt of the blow as activity came to a halt. The real economy has sustained immense damage. Locking people down has crippled the supply side. It is impossible to produce goods and many services remotely, without a physical presence at the workplace. Technology facilitates working from home, but factories still need workers. Moreover, the impact has been even greater on the demand side. Consumption shrivels when people stay at home all day. Online shopping helps, but the range of goods one might want to buy is limited and that of feasible services minimal. Tourism cannot take place without travel. The widespread loss of jobs and reduced income naturally depress spending. BIS Annual Economic Report 2020 ix
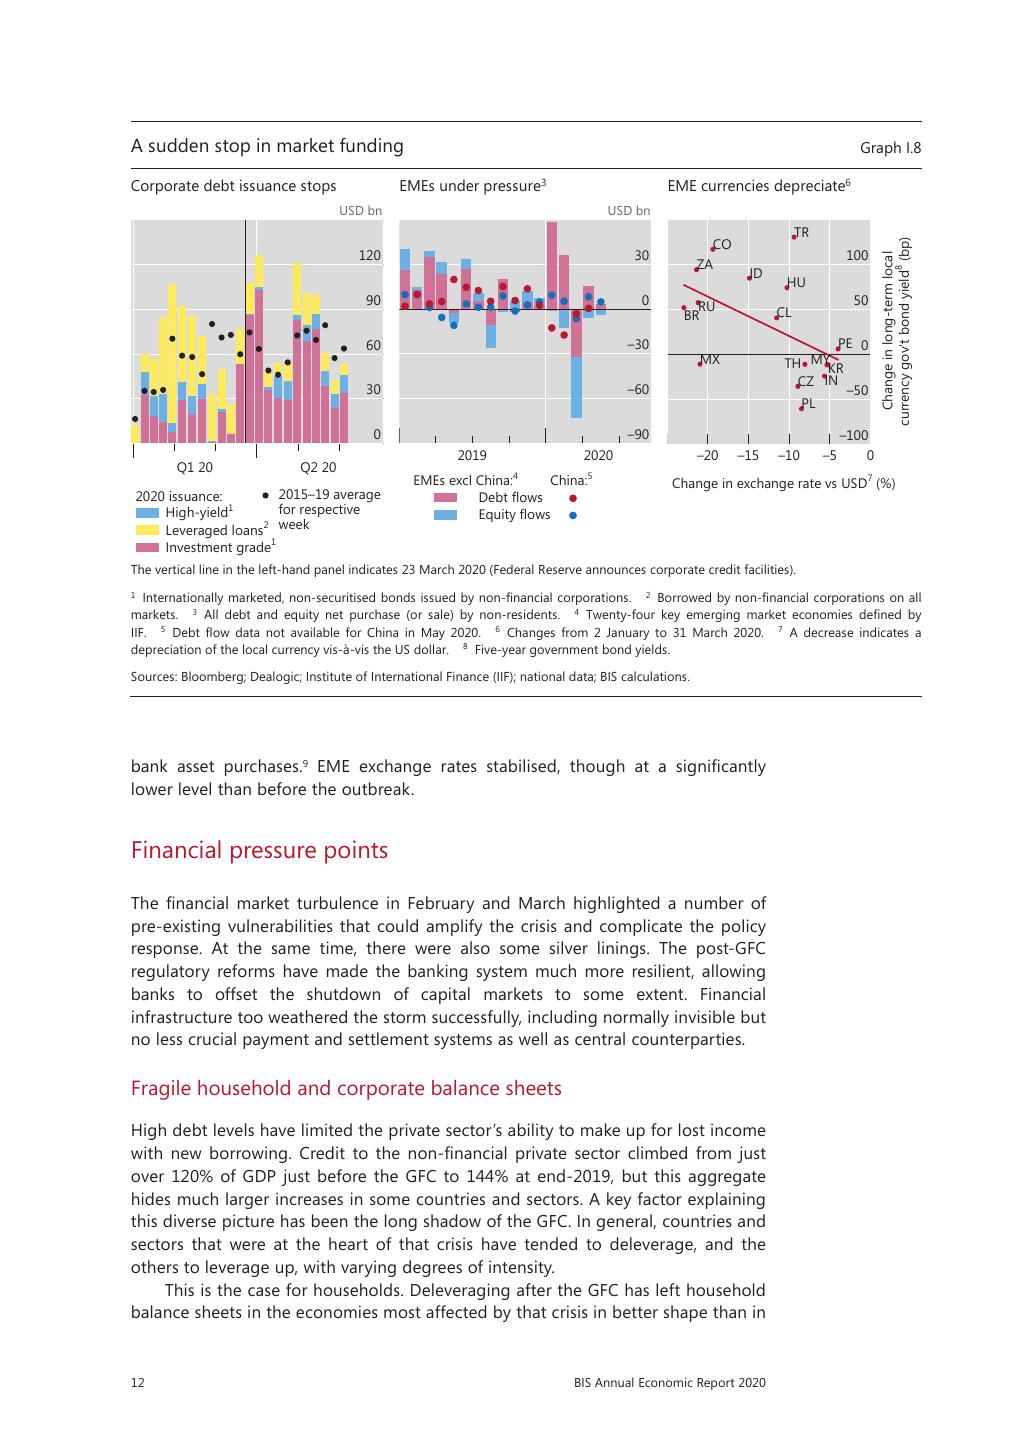
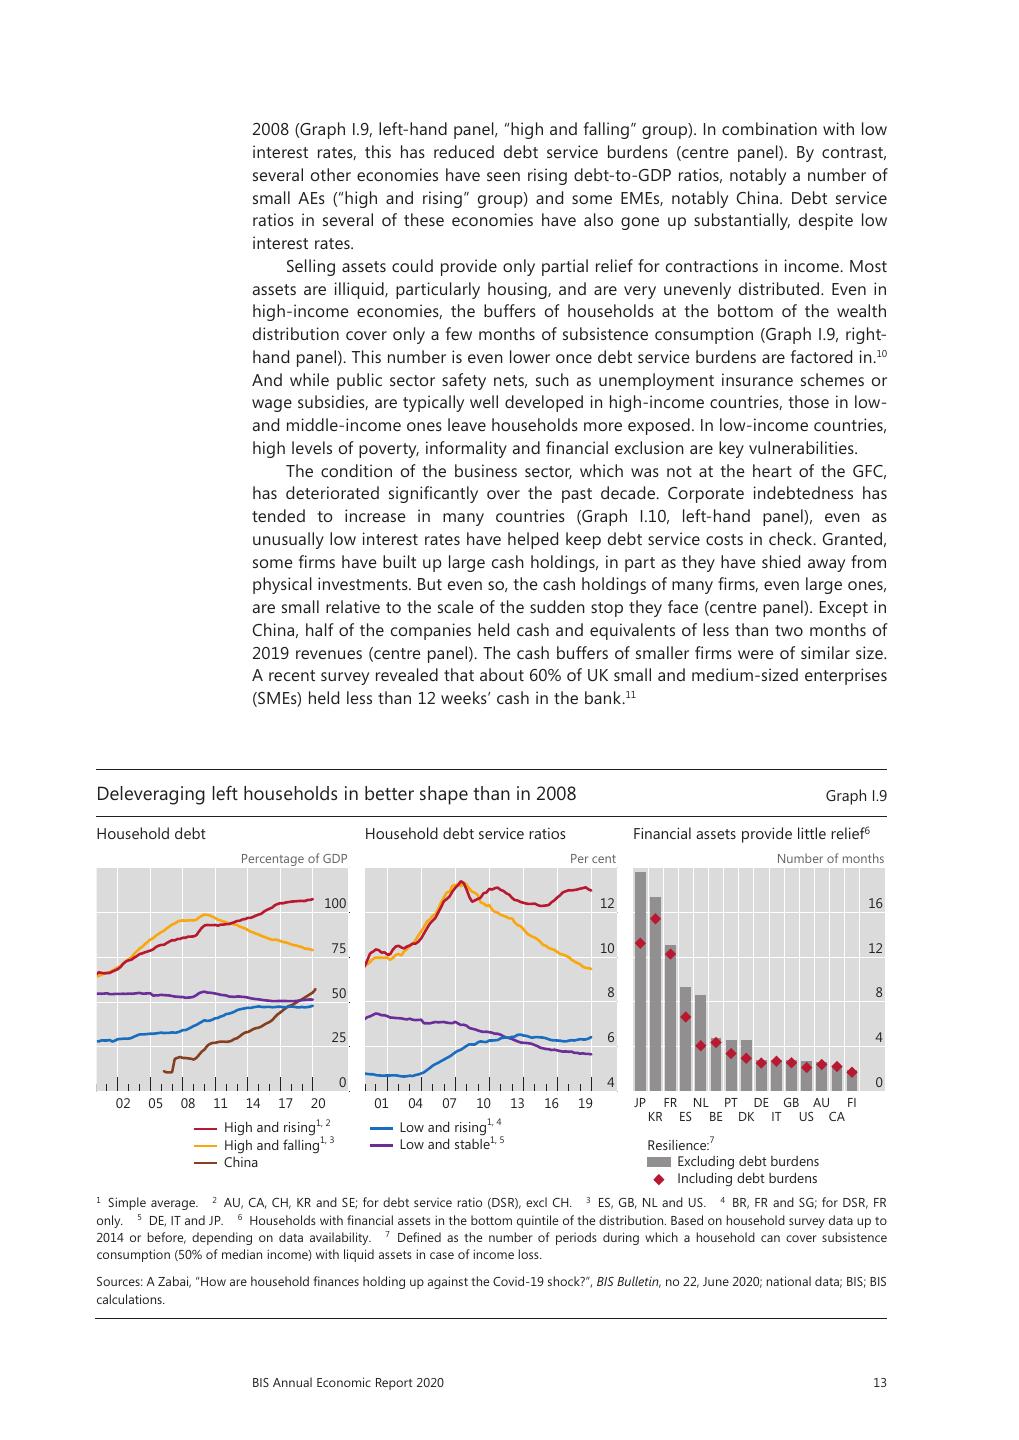
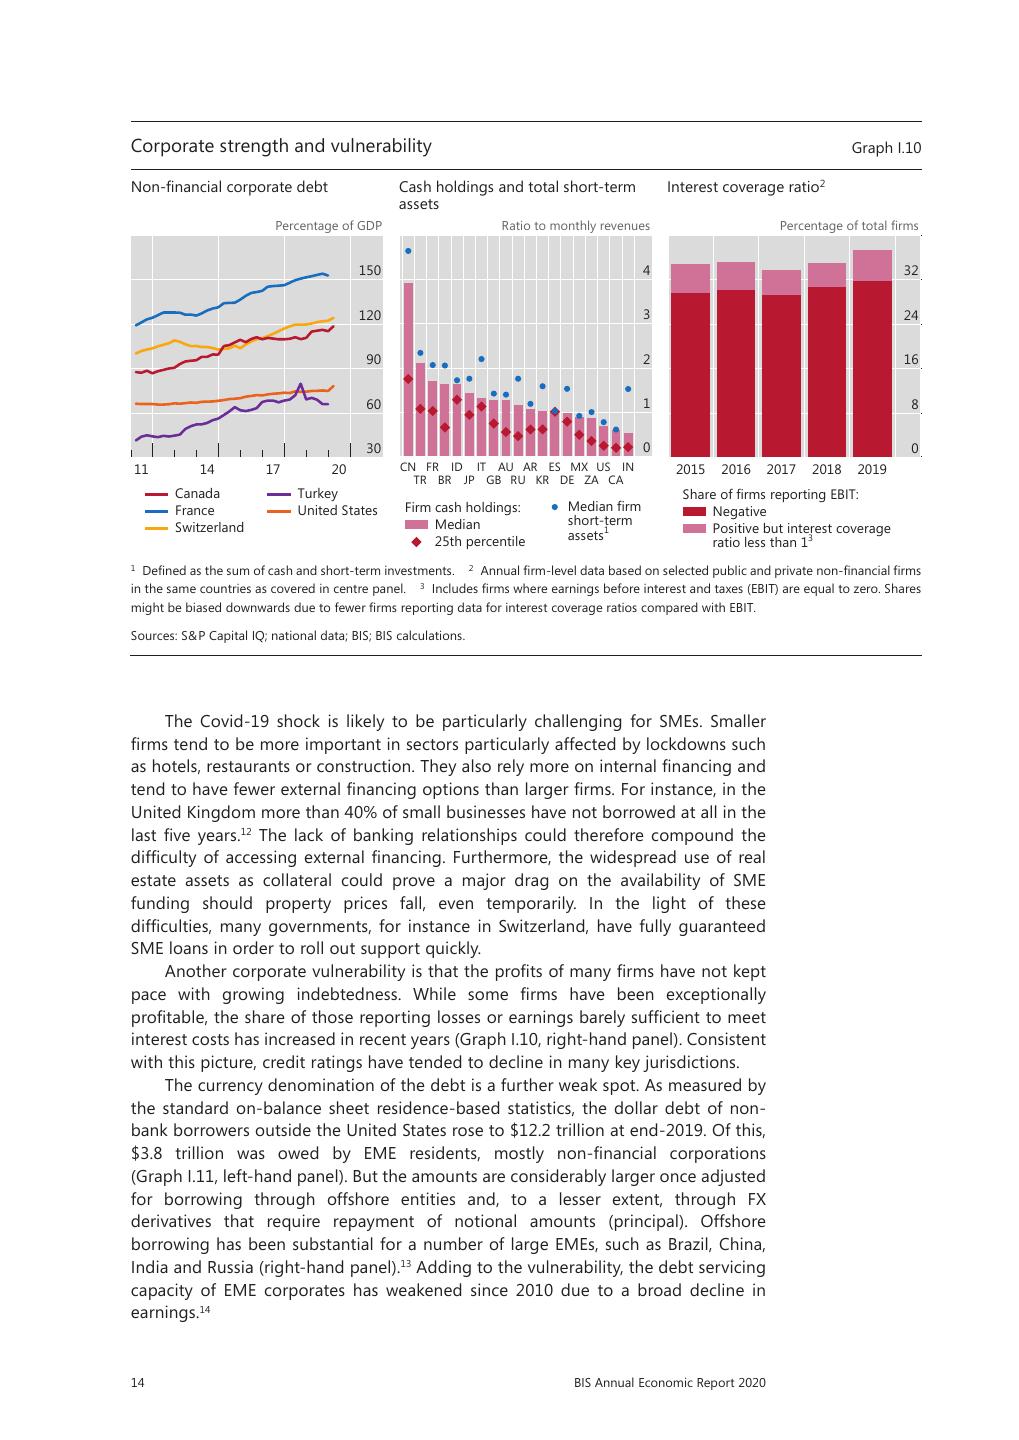
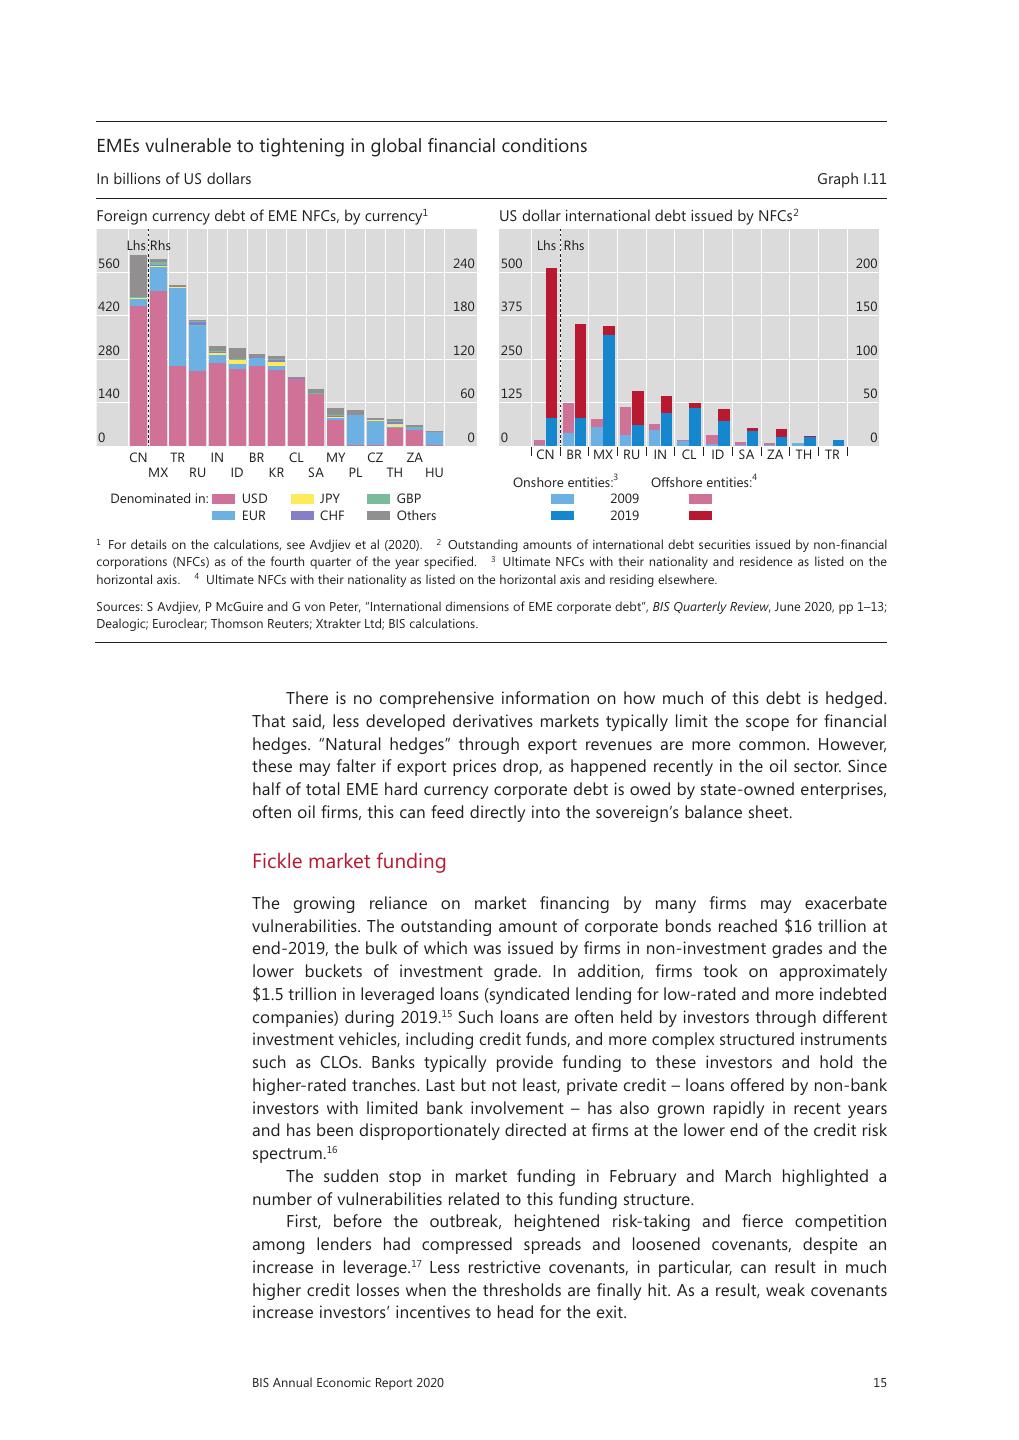
13 .In addition, investment has taken a hit from heightened uncertainly and supply disruptions, including those to global supply chains. It is as if, from one day to the next, once affluent societies dropped to the subsistence level. Of course, the lockdowns did not affect all countries and sectors to the same extent. The timing and stringency of the measures differ. At one end of the spectrum, China was the first to implement tough containment measures. At the other end, as the virus spread around the world, countries such as Sweden and, more hesitantly, the United States took a milder approach, at least initially. That said, the high degree of openness of economies nowadays has reduced, through trade, any local differences in the impact of the lockdowns – a reminder of how integrated the global economy has become. The structure of production differs. For instance, as demand in China and worldwide ground to a halt, commodity exporters suffered the most. Oil producers were hit hardest, as the collapse of demand coincided with that of the oil cartel, leading to an unprecedented oil glut. Despite a renewed, albeit fragile, agreement among suppliers, by mid-April the oil price measured in nominal terms had reached its lowest level since 1986; in inflation-adjusted terms, it had fallen by around half. Indeed, at one point, the imbalance between supply and demand was so large that the price of WTI futures for near-term delivery turned negative. Countries specialising in sectors such as tourism saw larger drops in output. And so did countries at the heart of global supply chains. Finally, countries also differ in terms of their exposure to financial factors and structural weaknesses. In this respect, emerging market economies (EMEs) stand to lose more. They have already faced huge pressure, with more no doubt to come. EMEs have experienced a triple sudden stop: in domestic economic activity, in capital flows and, for many, in commodity exports and remittances. Above all, they have faced this storm with much more limited fiscal space than most of their advanced economy peers. For many of them, poorer health systems and large informal sectors have further complicated the policy trade-offs. Regardless of financial conditions, the shock would have been enormous. But, while not at the origin of the shock, the financial sector has played an important dual role. It has acted as a key transmission channel for the shock back onto the real economy, although central banks have been quick to neutralise this impact (see below). And, less appreciated, it has also helped shape initial conditions, heightening the economy’s sensitivity to the shock. Consider each aspect in turn. Given their forward-looking nature, global financial markets reacted faster than the real economy. True, when problems appeared to be confined to East Asia, markets hardly moved: in fact, by end-January, equity prices had reached a historical peak. But when news about the surprisingly rapid spread of the virus in Europe hit the wires in late February, equity markets buckled, volatilities spiked and bond yields bottomed. While, at the outset, markets functioned rather well, they continued to dance to the tune of the virus and became increasingly disorderly. Spreads soared on corporate and EME debt securities, which had largely been spared in the first phase. In March, a flight to safety turned into a scramble for cash, in which even gold and US Treasury securities were dumped to meet margin calls. It was precisely at this point that markets threatened to freeze entirely. While the US dollar markets, both on- and offshore, stood at the epicentre, other markets too were roiled to varying degrees. Just like a virus, the crisis has been evolving. In some respects, the success of central banks in calming markets and shoring up confidence has even helped spark some market exuberance: at the time of writing, equity prices and corporate spreads in particular seem to have decoupled from the weaker real economy. Even x BIS Annual Economic Report 2020
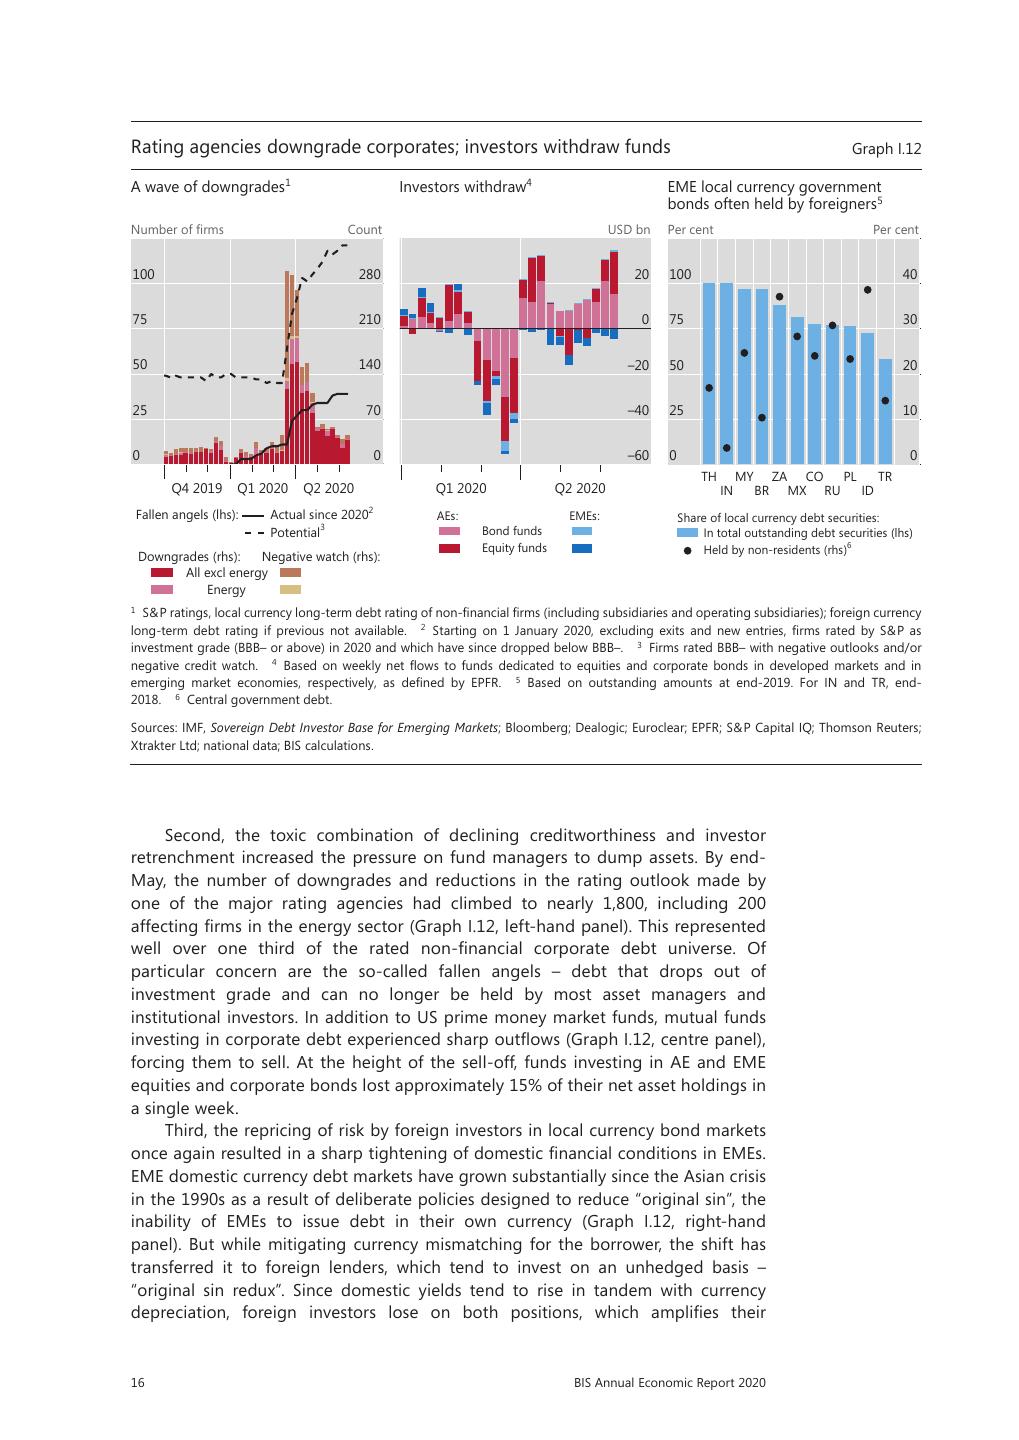
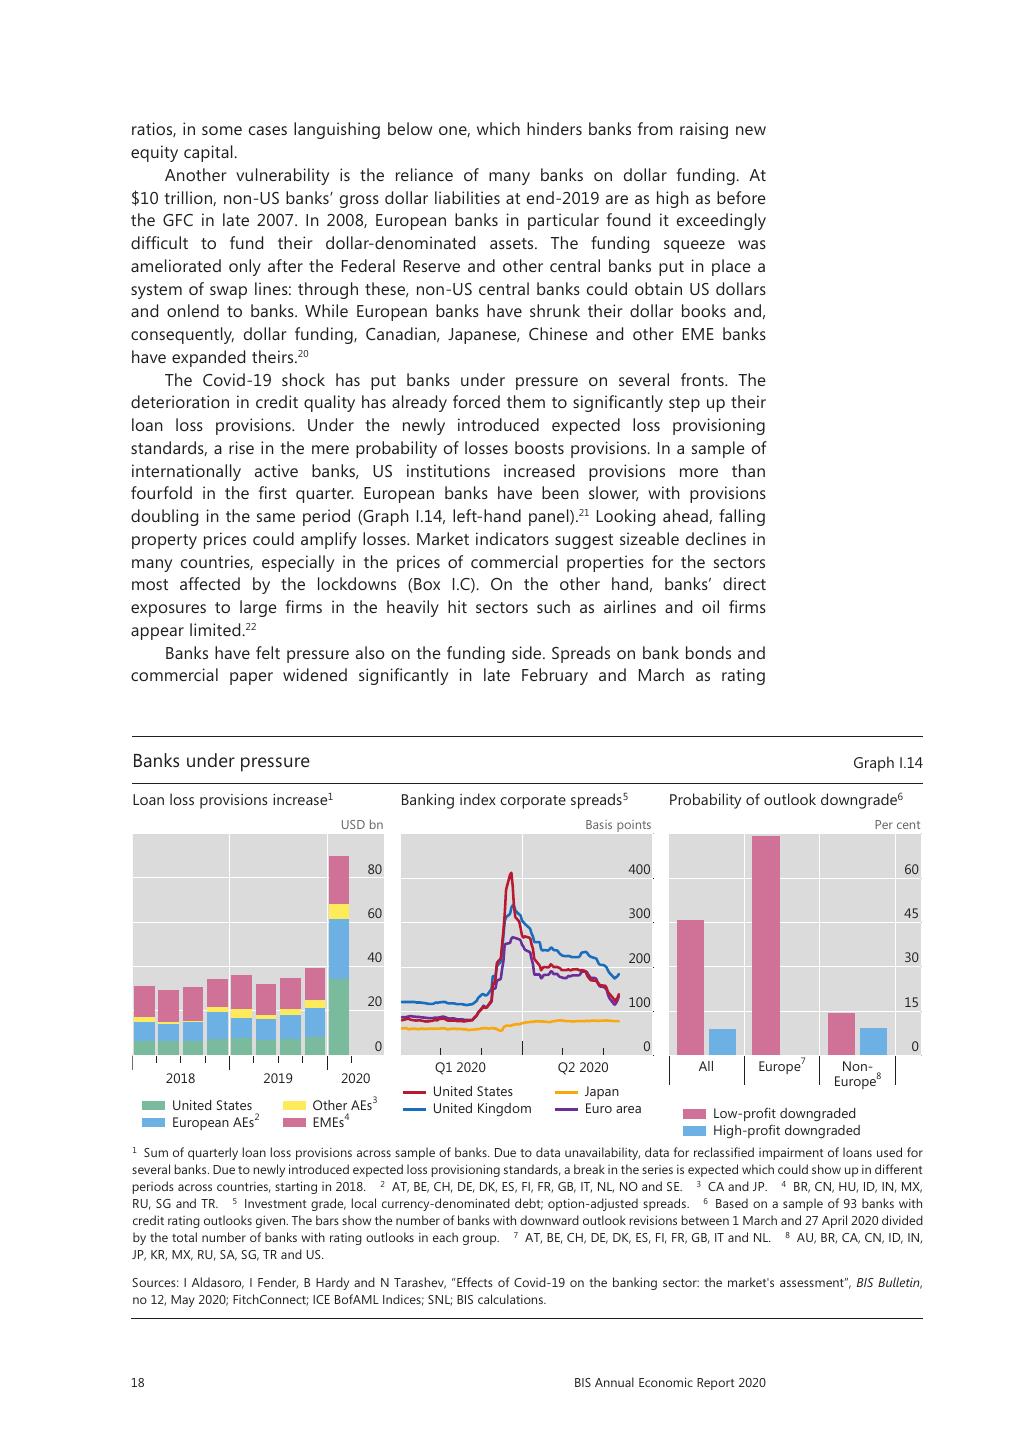
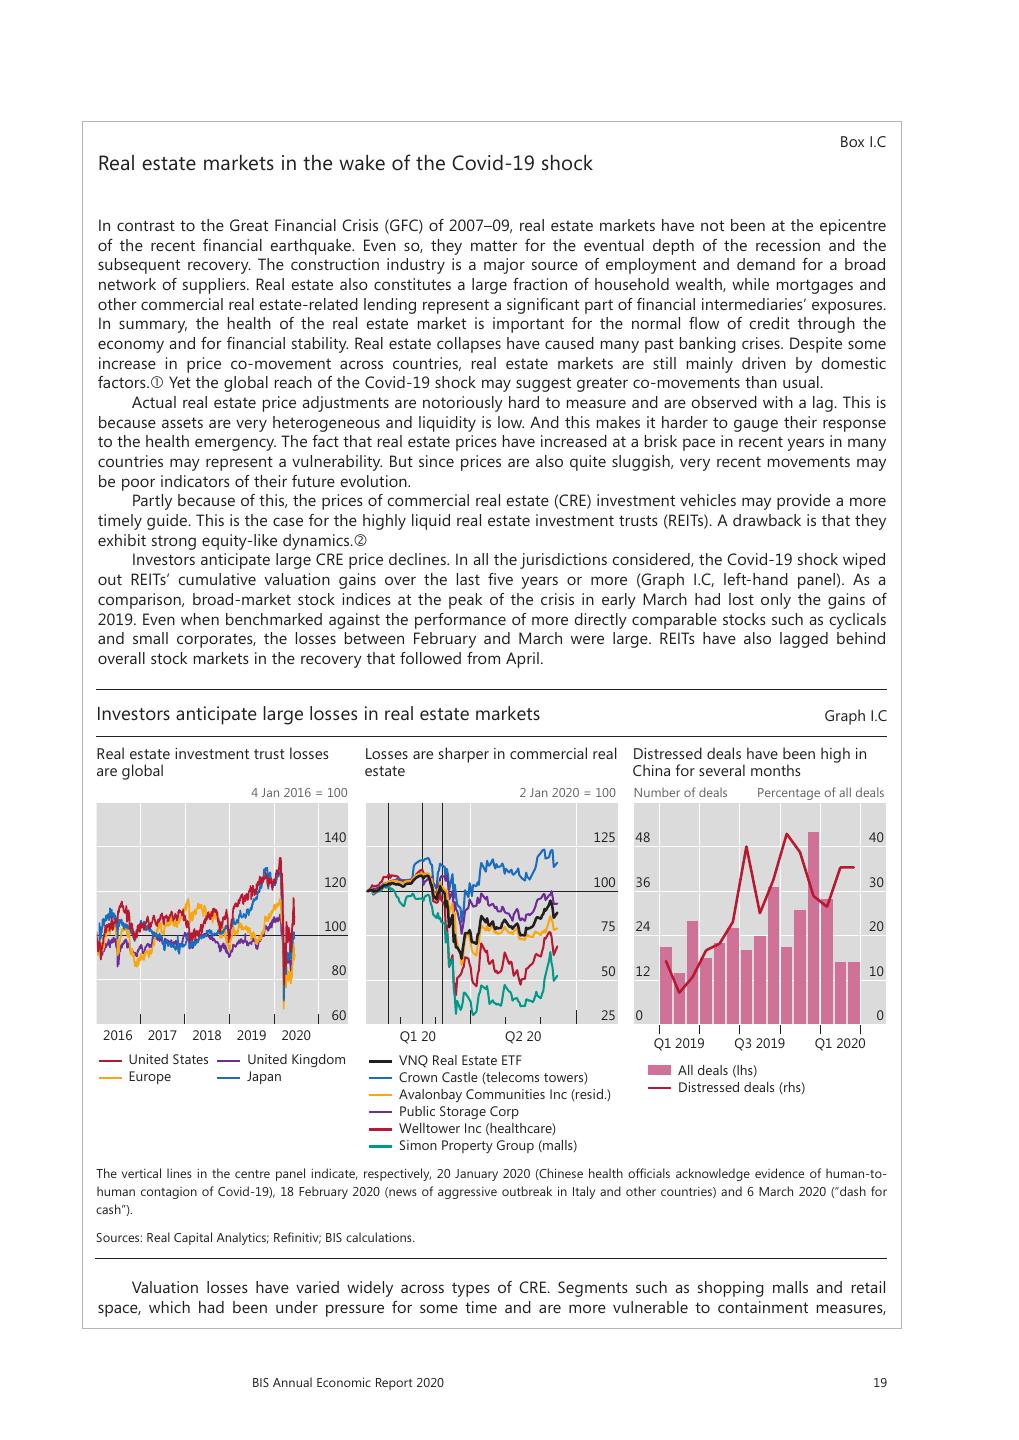
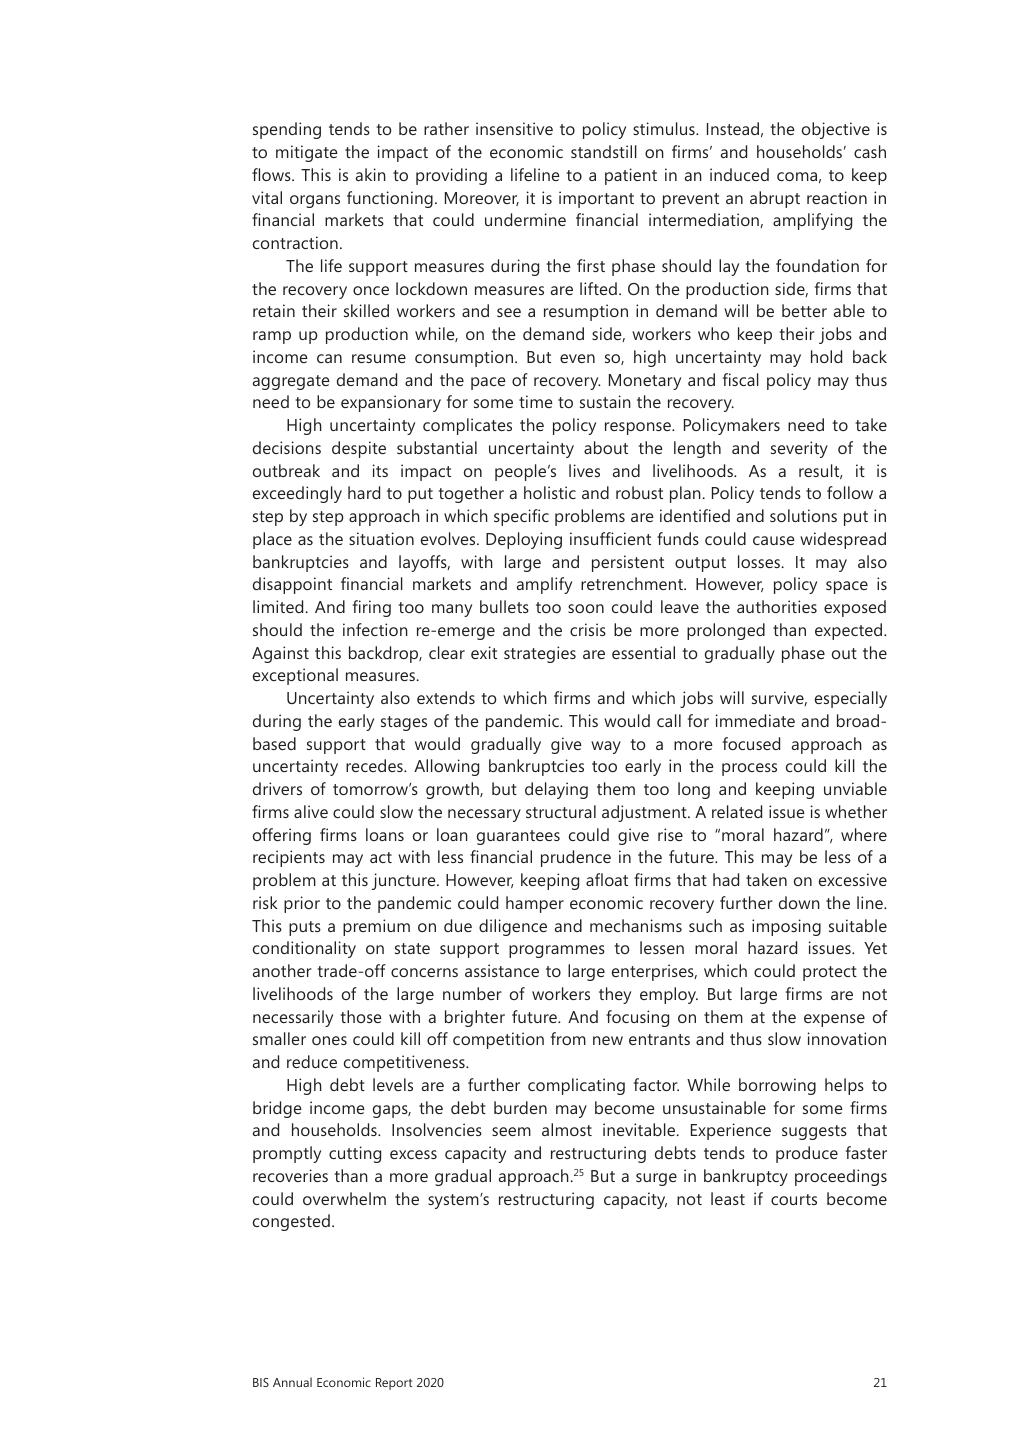
14 .so, underlying financial fragilities remain: this feels more like a truce than a peace settlement. And more fundamentally, what first appeared to be a liquidity problem, more amenable to central bank remedies, is morphing into a threat to solvency. A wave of downgrades has started, alongside concerns that losses might cause widespread defaults. Equally important has been the role of financial factors in shaping initial conditions. After slowly building up, partly on the back of unusually low and persistent interest rates post-GFC, financial vulnerabilities have exacerbated the impact of the shock on economic activity – and may continue to do so as the crisis unfolds. These vulnerabilities can be summed up as overstretched financial markets and high non-bank leverage. First, aggressive risk-taking prevailed in financial markets before the pandemic. Valuations were frothy. Credit risk showed clear signs of underpricing in both advanced and emerging market economies. For instance, credit spreads were on the narrow side in the United States and even more so in the euro area. Moreover, as is typical in such cases, market liquidity was fragile. This was reflected in the popularity of illiquid investments financed through short-term funding, investment funds and other such vehicles; or in widespread relative value “arbitrage” trades by hedge funds that ended up causing turmoil in the US Treasuries market. Second, and closely related, non-bank leverage was high. Corporate debt was elevated in many advanced and emerging market economies. Examples are leveraged loans, collateralised loan obligations and, much underappreciated, private credit – a form of financing for smaller and typically riskier firms that is a locus for highly illiquid investments, almost as large as the leveraged loan market and just as overstretched. Corporate debt levels burgeoned while credit quality deteriorated, as reflected in the rising share of debt rated BBB, just one notch above non-investment grade (“junk”). Household debt was high in several countries less affected by the GFC, typically “small” open advanced economies such as Canada, Australia and the Nordics as well as a number of EMEs, including Korea. Moreover, sovereign debt loomed large in several advanced economies and, above all, in EMEs, partly as a result of the policy response to the GFC. Finally, there was a strong increase in offshore US dollar borrowing, both on- and off-balance sheet, notably via FX swaps. So far, these vulnerabilities have manifested themselves in various ways. These include the outsize initial market reaction to the first concerns about the virus; the liquidity squeeze on firms and the broad swathe of rating downgrades; the aggravated tensions in US dollar funding markets; and the sudden stop in capital flows to EMEs. But should the crisis not let up, we could see broader strains emerging among households and sovereigns too. Indeed, rating agencies have already started to downgrade some sovereigns or put them on a negative outlook. A silver lining in this sobering picture is the state of the banking system. In contrast to the GFC, the pandemic found banks much better capitalised and more liquid, thanks largely to the post-crisis financial reforms coupled with a more subdued expansion. Indeed, as discussed further below, policymakers have looked at banks as part of the solution rather than as part of the problem. Huge drawdowns on credit lines have stretched banks’ balance sheets, but not by enough to force them into sharply cutting other lending. Banks have so far absorbed shocks rather than amplified them. In fact, the strains have shown most in the non-bank financial sector, which has grown in leaps and bounds post-GFC and was at the centre of the financial storm. Nevertheless, banks face challenges. This real-life stress test is more severe than the scenarios supervisors adopted in their pre-crisis solvency exercises. One challenge is chronically weak profitability in a number of banking systems, most notably in the euro area and Japan. Profits are important: they form the first line of defence against losses and determine how fast banks can bounce back when they BIS Annual Economic Report 2020 xi
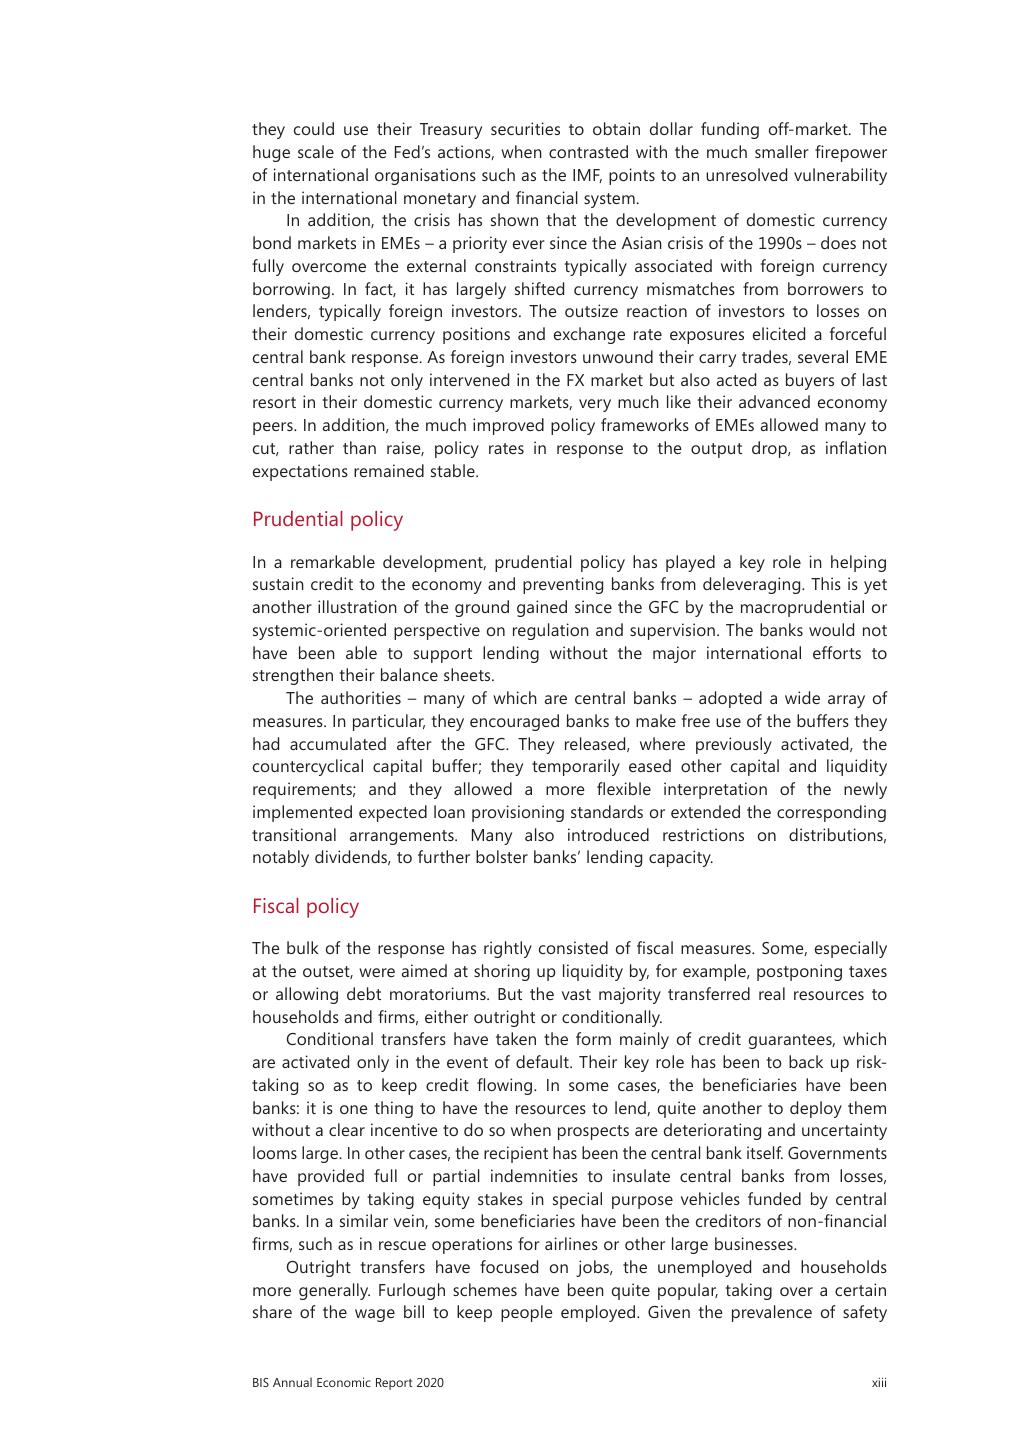
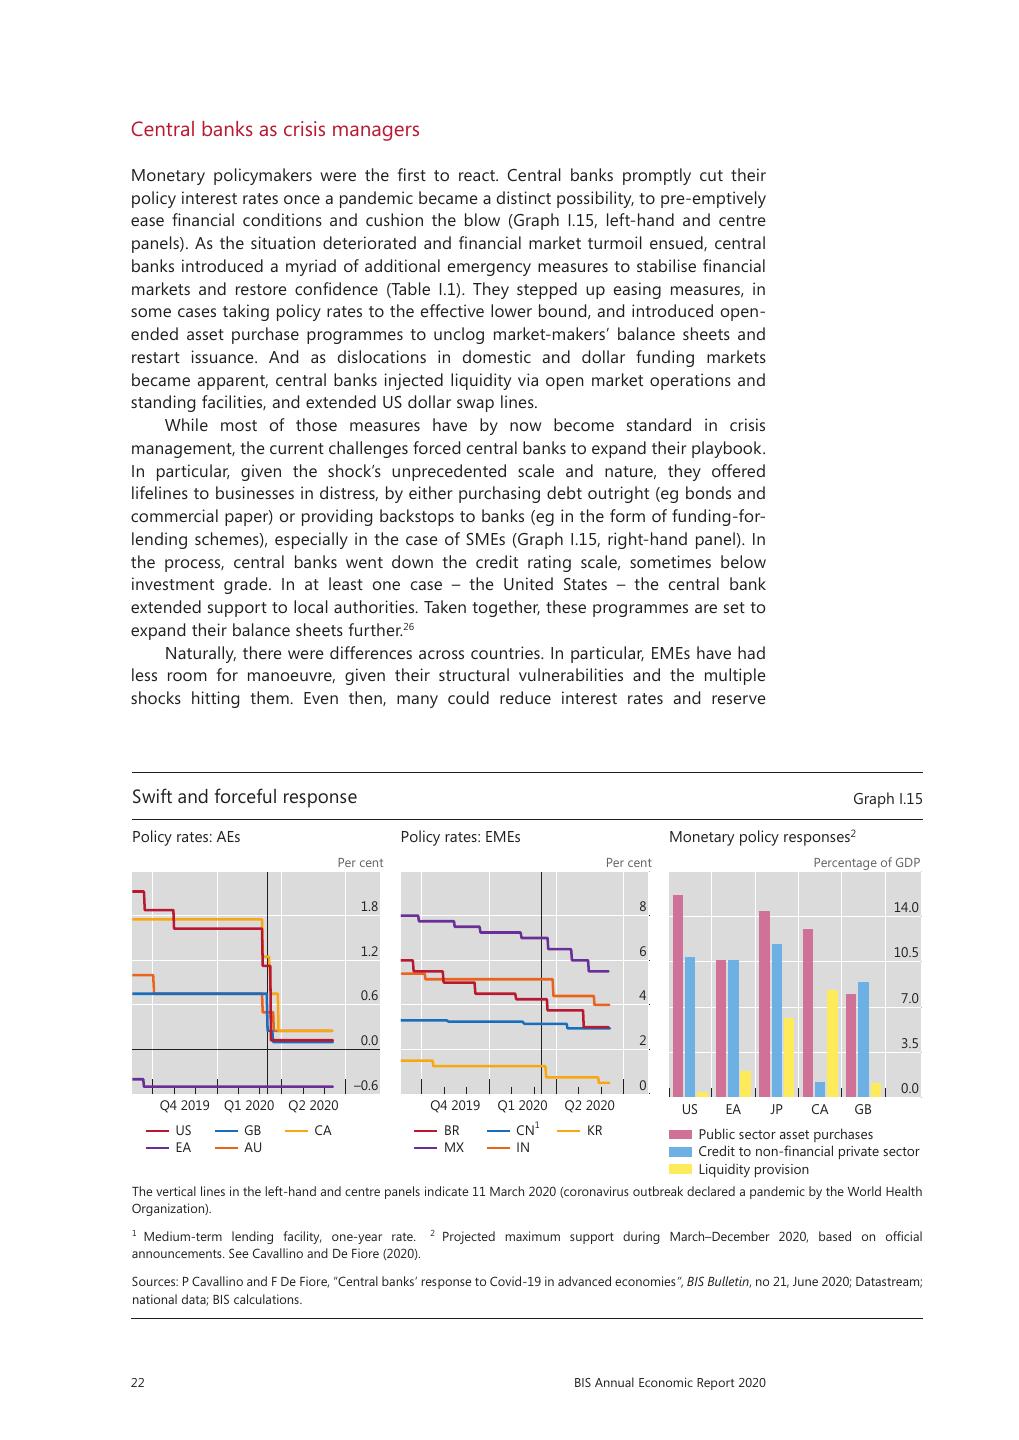
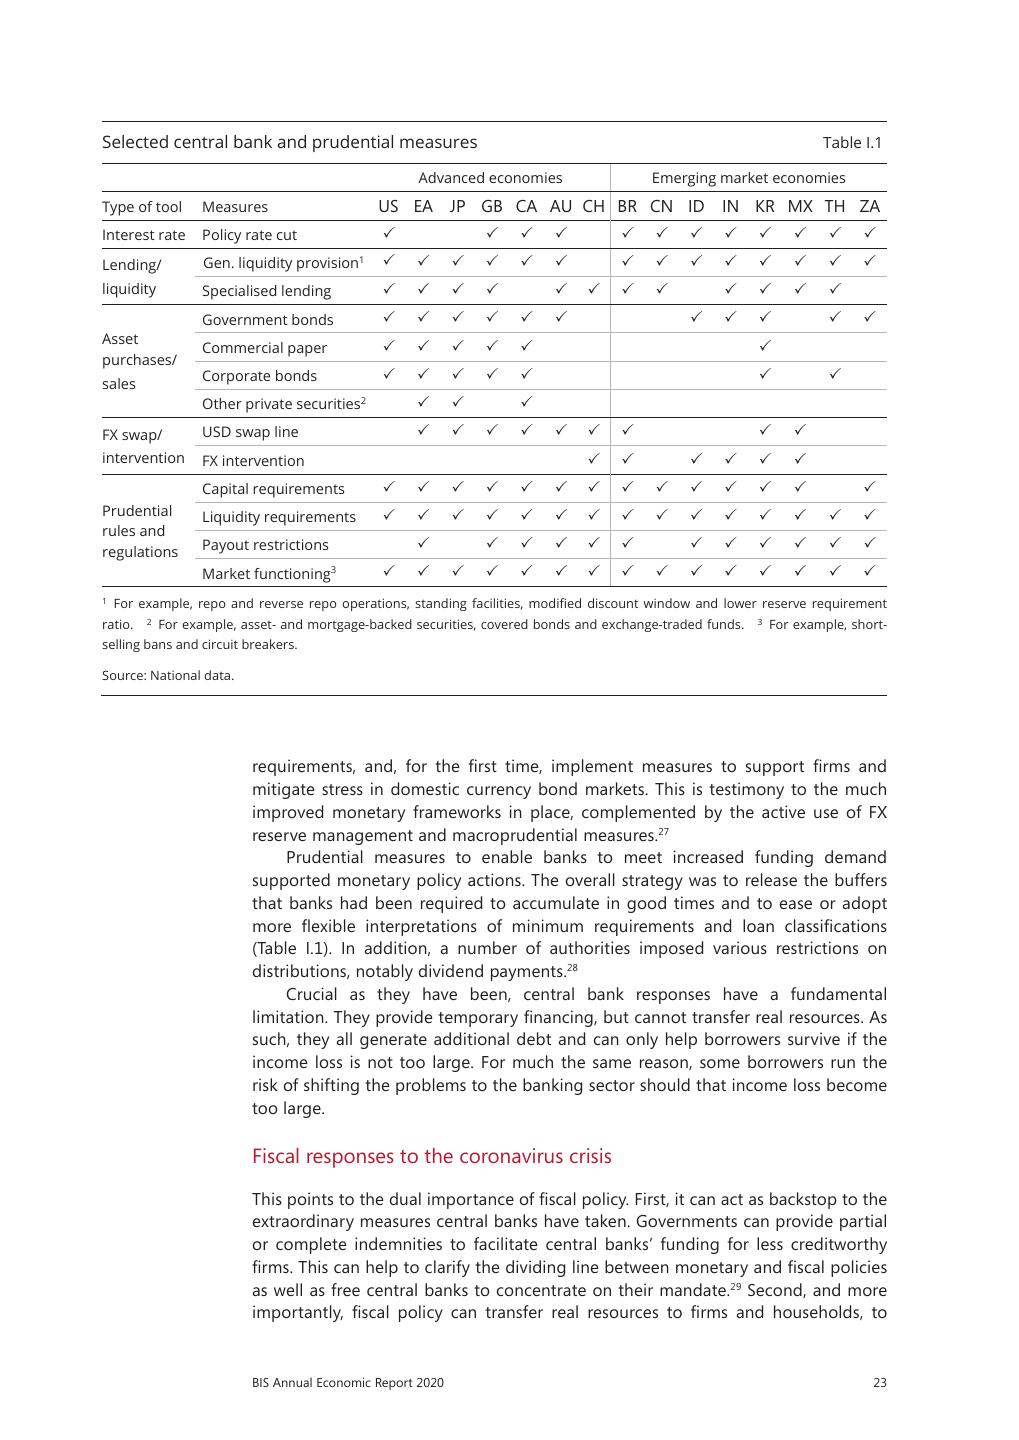
15 .struggle to obtain external equity and find themselves under pressure to keep paying out dividends, especially where price-to-book ratios languish below one. Both markets and rating agencies have taken notice: bank share prices have underperformed overall indices, credit spreads have widened and rating agencies have put banks on negative watch. The policy response so far What have policymakers done so far? The simple answer is that they have gone “all in” to cushion the blow. The response has generally been swifter, bigger and broader-based than it was for the GFC. The authorities have deployed monetary, prudential and fiscal policies in a concerted way that probably has no historical precedent. Consider each of the policies in turn. Monetary policy Central banks once again reacted swiftly and forcefully to stabilise the financial system and support credit flows to firms and households. The initial interest rate cuts, while called for, were limited in their soothing effect. The impact was much larger once central banks started to act in their time-honoured role of lenders of last resort, supplying badly needed liquidity and addressing dysfunctional markets. By stabilising the financial system and restoring confidence, these measures also prevented the transmission of monetary impulses to the economy from breaking down. In so doing, central banks tailored their measures to the specific characteristics of both the shock and the financial system. The size of the shock called for a response on an unprecedented scale. And because no country was spared, the response was truly global. The nature of the shock required central banks to push harder than in the past. While some central banks could simply extend previously applied measures, others broke new ground. In addition to purchasing government debt on a massive scale, many central banks also bought private sector securities or relaxed their criteria for collateral, venturing further down the creditworthiness scale than ever before. Some extended support to local authorities or bought equities. Outright purchases went hand in hand with backup facilities for bank lending or for commercial paper programmes. Importantly, the funding support reached all the way to small and medium-sized enterprises. In the process, some central banks crossed former “red lines”, resorting to measures that would once have been seen as off-limits. The rapid growth of market finance since the GFC meant that central banks once again broadened their historical role of lenders of last resort to that of buyers or dealers of last resort. Hence the greater incidence of outright purchases of securities, or commitments to do so, sometimes even open-ended ones. Indirectly, this relieved the pressure on banks, given their symbiotic relationship with markets, not just as dealers but also as suppliers of backup credit facilities. For instance, the Federal Reserve’s purchase of US Treasuries helped clear dealers’ crowded inventories, and its backup facility for commercial paper helped ease the pressure on bank credit lines. Furthermore, a larger number of central banks, in EMEs too, moved to stabilise a dangerous run on money market mutual funds. The dominance of the US dollar in global finance again required the Federal Reserve to act as the international lender of last resort. Indeed, the Fed granted foreign currency swap lines to as many as 14 central banks, from both advanced and emerging market economies, reactivating many lines that had expired since the GFC. Moreover, it put in place a repo facility, open to all central banks, so that xii BIS Annual Economic Report 2020
16 .they could use their Treasury securities to obtain dollar funding off-market. The huge scale of the Fed’s actions, when contrasted with the much smaller firepower of international organisations such as the IMF, points to an unresolved vulnerability in the international monetary and financial system. In addition, the crisis has shown that the development of domestic currency bond markets in EMEs – a priority ever since the Asian crisis of the 1990s – does not fully overcome the external constraints typically associated with foreign currency borrowing. In fact, it has largely shifted currency mismatches from borrowers to lenders, typically foreign investors. The outsize reaction of investors to losses on their domestic currency positions and exchange rate exposures elicited a forceful central bank response. As foreign investors unwound their carry trades, several EME central banks not only intervened in the FX market but also acted as buyers of last resort in their domestic currency markets, very much like their advanced economy peers. In addition, the much improved policy frameworks of EMEs allowed many to cut, rather than raise, policy rates in response to the output drop, as inflation expectations remained stable. Prudential policy In a remarkable development, prudential policy has played a key role in helping sustain credit to the economy and preventing banks from deleveraging. This is yet another illustration of the ground gained since the GFC by the macroprudential or systemic-oriented perspective on regulation and supervision. The banks would not have been able to support lending without the major international efforts to strengthen their balance sheets. The authorities – many of which are central banks – adopted a wide array of measures. In particular, they encouraged banks to make free use of the buffers they had accumulated after the GFC. They released, where previously activated, the countercyclical capital buffer; they temporarily eased other capital and liquidity requirements; and they allowed a more flexible interpretation of the newly implemented expected loan provisioning standards or extended the corresponding transitional arrangements. Many also introduced restrictions on distributions, notably dividends, to further bolster banks’ lending capacity. Fiscal policy The bulk of the response has rightly consisted of fiscal measures. Some, especially at the outset, were aimed at shoring up liquidity by, for example, postponing taxes or allowing debt moratoriums. But the vast majority transferred real resources to households and firms, either outright or conditionally. Conditional transfers have taken the form mainly of credit guarantees, which are activated only in the event of default. Their key role has been to back up risk- taking so as to keep credit flowing. In some cases, the beneficiaries have been banks: it is one thing to have the resources to lend, quite another to deploy them without a clear incentive to do so when prospects are deteriorating and uncertainty looms large. In other cases, the recipient has been the central bank itself. Governments have provided full or partial indemnities to insulate central banks from losses, sometimes by taking equity stakes in special purpose vehicles funded by central banks. In a similar vein, some beneficiaries have been the creditors of non-financial firms, such as in rescue operations for airlines or other large businesses. Outright transfers have focused on jobs, the unemployed and households more generally. Furlough schemes have been quite popular, taking over a certain share of the wage bill to keep people employed. Given the prevalence of safety BIS Annual Economic Report 2020 xiii
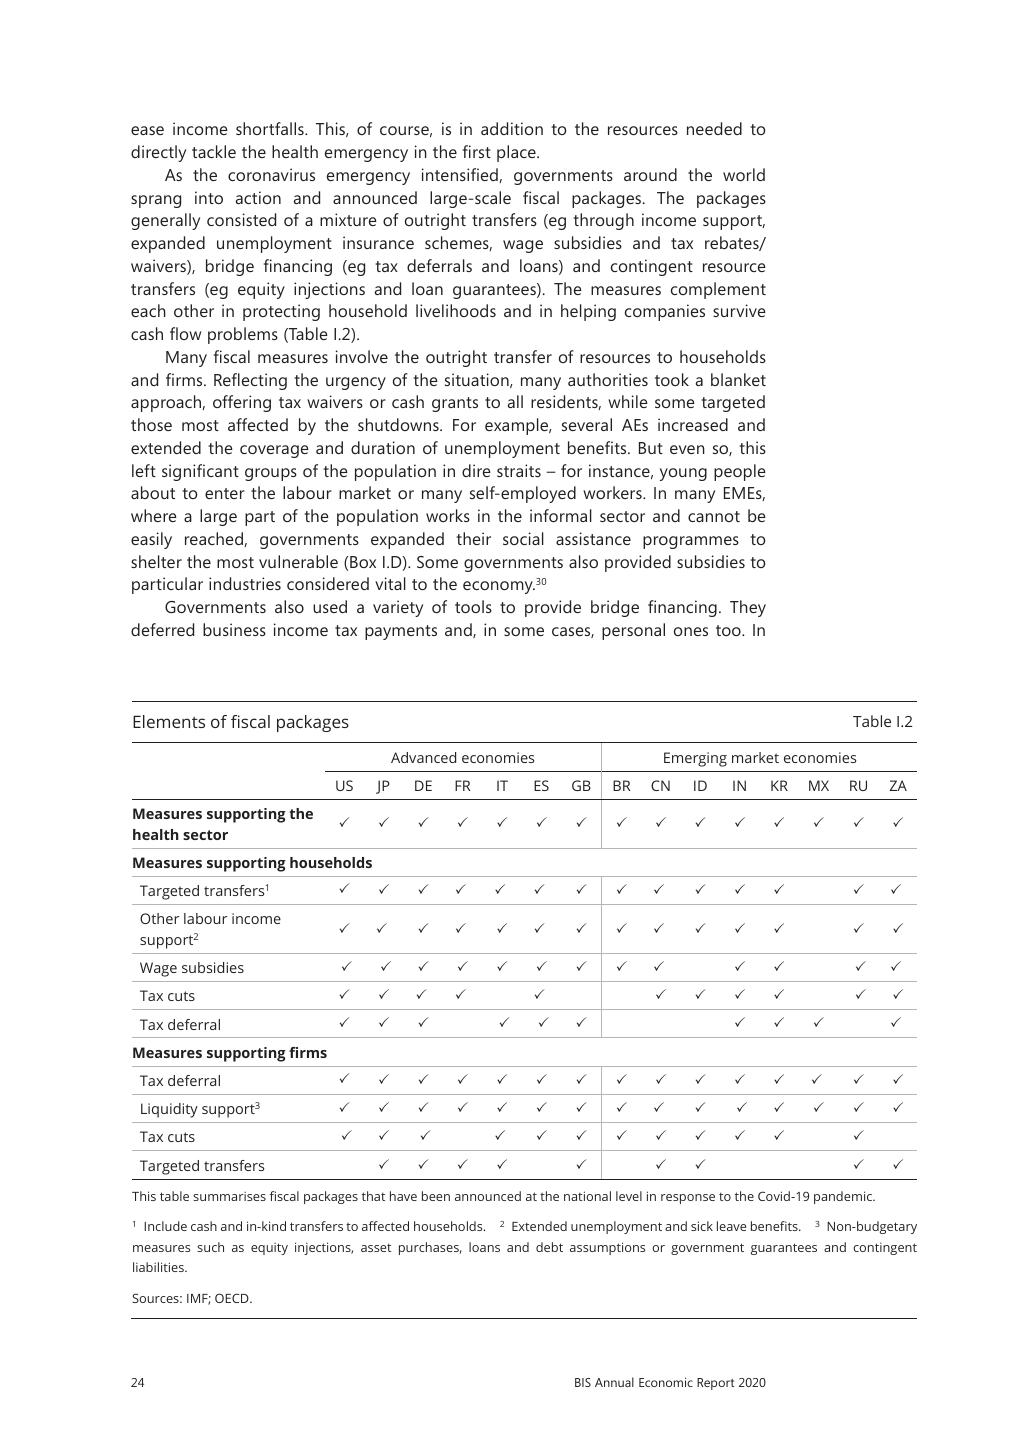
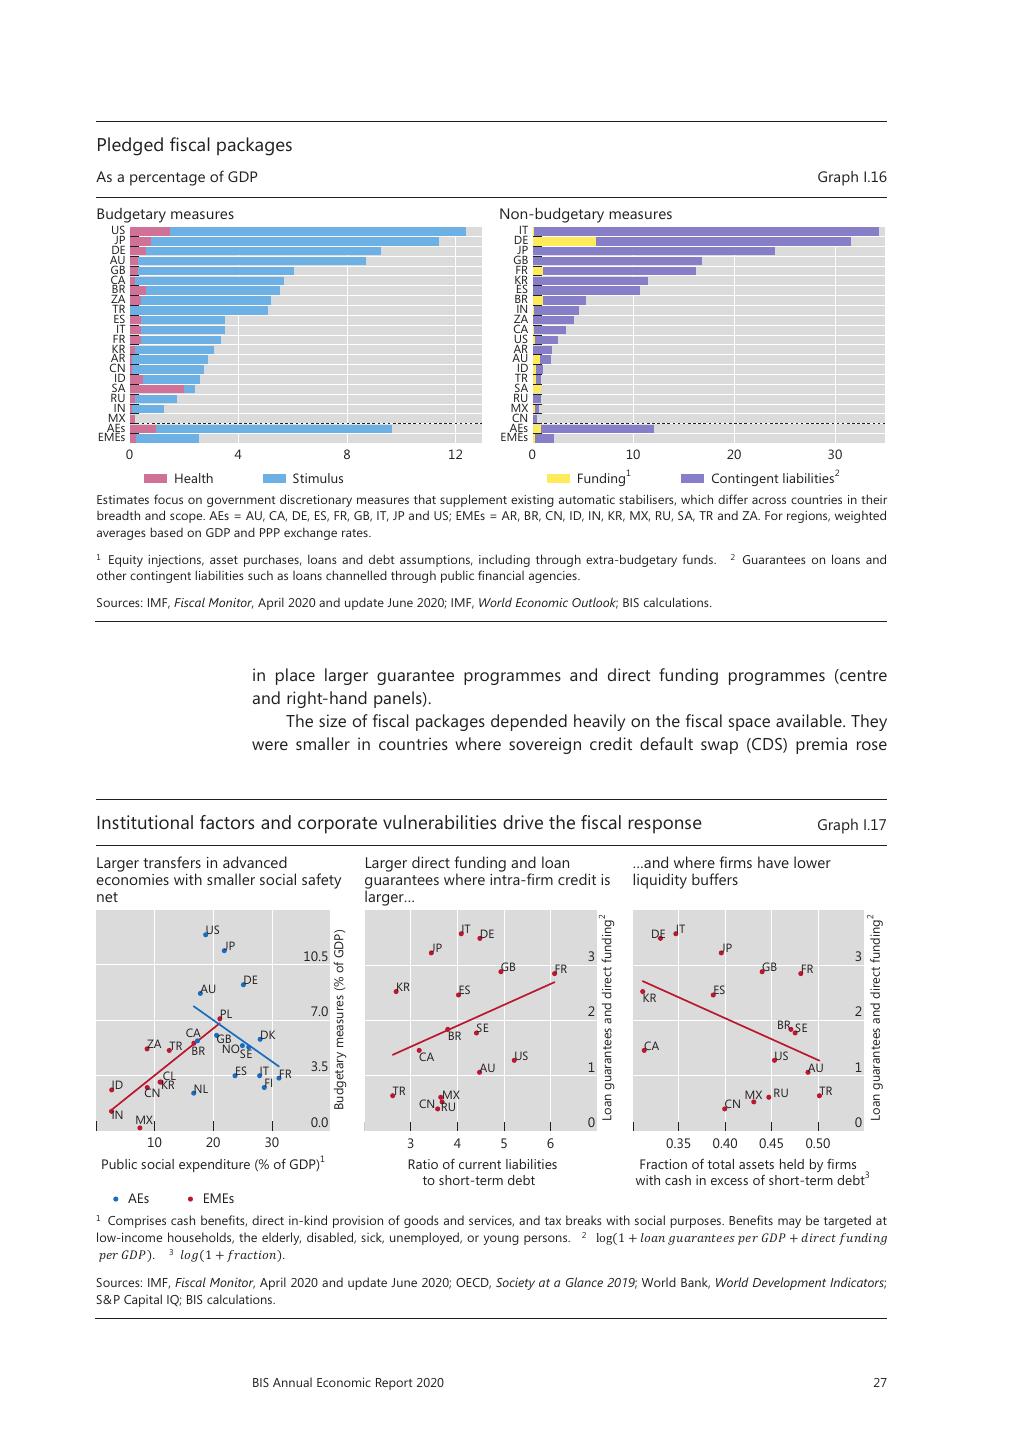
17 .nets, many jurisdictions have also chosen to strengthen their unemployment insurance schemes; the need for discretionary measures in this area has naturally depended on the size of automatic stabilisers. Some governments have also made direct cash transfers to households. But many EMEs have faced serious challenges in reaching beneficiaries working in the large informal sector. Institutional factors aside, the initial room for manoeuvre has strongly influenced the size and shape of fiscal packages. They have tended to be smaller in countries with less fiscal headroom. Here again, EMEs have generally been at a disadvantage. Looking ahead What are the policy challenges ahead? How do they depend on the evolution of the crisis? To help frame the issues, it is useful to consider the phases that tend to characterise economic crises with strong financial elements, like the current one. There are three possible phases: illiquidity, insolvency and recovery. Importantly, the dividing line between phases is fuzzy and they overlap. In the economy at large, just as it is possible to see insolvencies when illiquidity is still widespread, so insolvencies may well occur as the economy recovers. And since, in the current crisis, the shock has initially hurt the business sector, it is there that the risk of insolvencies is greatest. Relatedly, unless banks run into trouble, it is easier to imagine a recovery even in the presence of bankruptcies. The general configuration and timing of the phases will naturally also depend on the initial financial vulnerabilities, notably the high debt levels, on the evolution of the pandemic and hence on the need for containment measures. The immediate objectives of policy vary with the phase. When illiquidity is widespread, the objective in a standard financial sector-induced crisis is to stabilise the financial system, to ensure that intermediaries continue to function and to support the economy. In the current crisis, which started in the non-financial sector, the authorities may need to fund households and firms directly, especially if the financial sector is overburdened. If and when insolvencies emerge, policy has two aims. First, to restructure balance sheets – the size as well as the debt and equity mix – so as to deal with a debt overhang. Second, to promote the underlying real adjustment, by reducing excess capacity and helping shift resources from less viable sectors and firms to the more promising ones. If these measures succeed, they can pave the way for a healthy recovery. In that phase, the aim is to support the economy so that it can grow sustainably. The role of monetary, prudential and fiscal policy differs according to the problem addressed. Monetary policy is critical in addressing illiquidity but is badly suited to dealing with insolvency: central banks lend but cannot spend. The comparative advantage of fiscal policy is to address insolvency, by temporarily transferring real resources to prevent it and by supporting balance sheet restructuring, as needed, once it occurs. Prudential policy’s role falls somewhere in between: its primary function is to ensure that banks remain solvent and functional but, subject to that overriding objective, it can also help sustain lending. All three policies, in their own way, can support the recovery. The special feature of this crisis is that standard macroeconomic stimulus can have relatively little impact during the illiquidity and insolvency phases because of the containment measures and the shock to supply. The current crisis is evolving rapidly. It is generally on its way out of the illiquidity phase: now the risk of insolvencies is looming while the timing of the xiv BIS Annual Economic Report 2020
18 .recovery is uncertain. And so is the shape of the possible recovery. It could be relatively swift if the containment measures are relaxed quickly and successfully, and if only limited sectoral adjustments are needed. It could falter, or stutter, if renewed lockdowns are implemented to deal with new waves of infection. It will be weaker if the shock is prolonged, scarring both corporate productivity and the consumer psyche, thus weighing on both demand and supply for a long time. In a slow or faltering recovery, debt overhangs could act as a major drag unless they are promptly dealt with. As time passes, it is likely that the authorities will be able to better calibrate their containment measures, thereby improving the near-term trade-off between saving lives and supporting the economy. Even so, policy choices are greatly complicated by the non-economic nature of the underlying forces, which are both unfamiliar and impervious to economic remedies. The impact of uncertainty on policy is already clear. Two effects stand out: on the policies designed to help reallocate resources, and on the utilisation of policy buffers. The post-crisis pattern of demand could be quite different from the pre-crisis one, with significant implications for resource reallocation. Some of the hardest-hit sectors and firms may have no viable future; others could thrive. Heightened uncertainty makes it harder to distinguish between insolvent but viable firms, which require restructuring, and insolvent, unviable ones, which should be liquidated. Complicating matters further are the initial vulnerabilities in the non-financial sector and the size of the shock. In the fog of battle, unviable firms may ask for protection and get it. Meanwhile, bankruptcy proceedings and the other mechanisms usually used for reallocating resources may prove ill-suited to dealing with large-scale problems. Governments could play a useful but delicate role. This could range from setting some broad directions for restructuring to introducing some abbreviated, less granular, processes, or possibly taking equity stakes in firms. Of course, this would raise governance issues of its own. The worst outcome would be failing to address the debt overhang altogether and allowing a persistent misallocation of capital, which, aggravated by low-for-long interest rates, would sap aggregate productivity. Uncertainty as to how the pandemic will evolve raises especially tricky challenges for the use of policy buffers. After all, the buffers are limited in size. At some point, if credit quality continues to deteriorate, banks will need to replenish their buffers, not draw them down further. At some point, central banks may face the unpalatable choice of nudging even deeper into negative interest rates, and increasing their already outsize ownership of financial assets in the economy. And at some point, fiscal policy will need to change tack in order to prevent fiscal positions from becoming unsustainable. For some countries, the limits of sustainability are already in sight, particularly but not only for EMEs. All this puts a premium on taking a measured and targeted approach – just as with the policies designed to contain the pandemic. This would also make it easier to exit policies when needed – an absolute must. All this is a further reminder that precautionary cushions in all policies, far from being a luxury, are absolutely essential, regardless of how unlikely any adverse outcomes may appear. On this occasion, the exogenous shock started out in the form of a pandemic – which was very much on the radar screen of epidemiologists, albeit far less expected by others. Future shocks could come from climate change or less foreseeable hazards. As the future unfolds, monetary policy will face serious challenges. This is so whether it is disinflationary or inflationary pressures that come to the fore. In either case, exit difficulties combined with limited policy space are likely to play a role. While the future course of inflation is uncertain, disinflationary pressures are likely to prevail for some time. To be sure, the pandemic shock has tended to reduce BIS Annual Economic Report 2020 xv
19 .productivity. Unable to accommodate the usual number of customers because of social distancing rules, airlines, restaurants and hotels will face cost pressures. Global value chains are likely to sustain long-lasting damage, which may be partly irreversible. Even so, precautionary saving and the limited pricing power of firms and labour will probably persist, limiting any second-round effects. Indeed, the experience with previous pandemics is consistent with this picture. This scenario would rather closely resemble the pre-pandemic shape of things. It is a world in which central banks test the limits of their expansionary policies and struggle to push inflation up. But as we peer further into the future, a quite different picture could emerge. In this case, we would be speaking not of inflation evolving within the current policy regime, but of a more fundamental change. Here the economic landscape would, in some respects, look like the one that materialised immediately after the Second World War. This scenario could come into being if a lengthy pandemic were to leave a much larger imprint on the economy and the political sphere. In this world, public sector debt would be much higher and the public sector’s grip on the economy much greater, while globalisation would be forced into a major retreat. As a result, labour and firms would gain much more pricing power. And governments could be tempted to keep financing costs artificially low, allowing the inflation tax to reduce the real value of their debt, possibly supported by forms of financial repression. At that point, it would be critical that central banks should be able to operate independently to pursue their mandate in order to resist any possible pressures not to increase interest rates. So far, the objectives of central banks and governments have coincided. Cooperation has come naturally. Central banks have not deviated from the pursuit of price and financial stability. But should inflationary pressures emerge at some point, tensions could arise. Then, the main institutional safeguard against such pressure would be central bank independence – a safeguard that raises the bar for successful government intervention. In this context, growing calls for “monetary financing”, regardless of their motivation, raise the risk of inching economies down that path. If taken far enough, this process could over time dent confidence in a country’s monetary institutions, exacting a high price in the pursuit of ephemeral short-run output gains. After all, the hard-won anti-inflation credibility of central banks has been instrumental during the recent crisis in allowing them to cross a number of previous “red lines” to stabilise the financial system and the economy. This analysis underlines once more the importance of striving to raise growth sustainably, while maintaining price and financial stability. The policy mix has been discussed in more detail in previous Annual Economic Reports. Today, more than ever, a premium needs to be put on keeping fiscal policy on a sustainable path through timely consolidation. The limits of monetary policy need to be recognised, as well as the importance of preserving and extending the post-GFC gains in strengthening the financial system’s resilience. Finally, renewed efforts are needed to implement the necessary structural economic reforms, a path that has proved quite elusive both before and after the GFC. This calls, above all, for taking a longer-term view than hitherto. It means avoiding shortcuts and not being tempted by policies that, while beneficial in the short term, may raise significant costs in the long term. After all, however distant it may appear, the future eventually becomes today. Central banks and payments in the digital era That banks were in better shape than during the GFC was not the only silver lining in this crisis. Less appreciated perhaps, but no less important, financial market xvi BIS Annual Economic Report 2020
20 .infrastructures and payment systems withstood the shock remarkably well. They rode out episodes of market dysfunction and provided critical support for the smooth functioning of the financial system. This puts the spotlight on a central bank function often taken for granted. This function does not make headlines as the central bank’s role in crisis management or macroeconomic stabilisation does. Nevertheless, it is essential for any economy: serving as the foundation of payment and settlement systems. At their heart, payment systems are a partnership between the private sector and central banks. The private sector plays the more visible role. It provides most of the payment instruments used by the public and it spearheads innovation, applying its ingenuity and creativity to serve customers better. The central bank supplies only one visible, if invaluable, means of payment to the public (cash), but it supplies the ultimate medium in which banks settle claims against each other (bank reserves). Moreover, and more fundamentally, the central bank ensures trust in the value of money and the payment system more generally – a core public good. And it is a discrete actor that, typically behind the scenes, promotes the efficiency of payments by encouraging competition and innovation. This role has become more important than ever at a time when technology is transforming payments. New payment methods and consumer interfaces, including web- and mobile-phone-based payments, are flourishing. The Covid-19 crisis has accelerated the trend towards contactless payments. Large non-bank providers, such as big tech firms, have started to enter payment services, both improving them but also threatening to become monopolies themselves. There is little doubt that the digital revolution has helped reduce costs, improve convenience and broaden access to payments. That said, there is still considerable room for improvement, both for domestic and, above all, for cross-border payments. And many of these improvements will not just arise spontaneously; they require wise interventions that steer powerful private sector forces towards the public interest. In this context, central banks play a key triple role as catalysts, operators and overseers. While most of the building blocks and policy imperatives for these roles have not changed, the new developments have changed their relative significance. In their role as operators and catalysts, central banks play a key part in fostering interoperability. This can help level the playing field, fostering competition and innovation. As operators, they can also pursue similar goals by directly providing public infrastructure, as in an increasing number of fast retail payment systems in recent years. In their role as overseers, central banks can safeguard the payment system’s soundness and integrity, as well as boost its efficiency by directly altering private sector incentives and influencing market structure, not least by helping to shape laws and regulations that tackle anti-competitive practices. Central banks can and should stand at the cutting edge of innovation themselves, not least when directly providing services to the public. Central bank digital currencies (CBDCs) are a prime example. CBDCs could represent a new, safe, trusted and widely accessible means of payment. They could also spur continued innovation in payments, finance and commerce. For CBDCs to fulfil their potential and promise as a new means of payment, their design and implications deserve close consideration, especially as they could have far-reaching consequences for the structure of financial intermediation and the central bank’s footprint in the system. Technology opens up exciting future opportunities for payment systems. It is up to central banks to harness those forces for the common good. BIS Annual Economic Report 2020 xvii
21 .
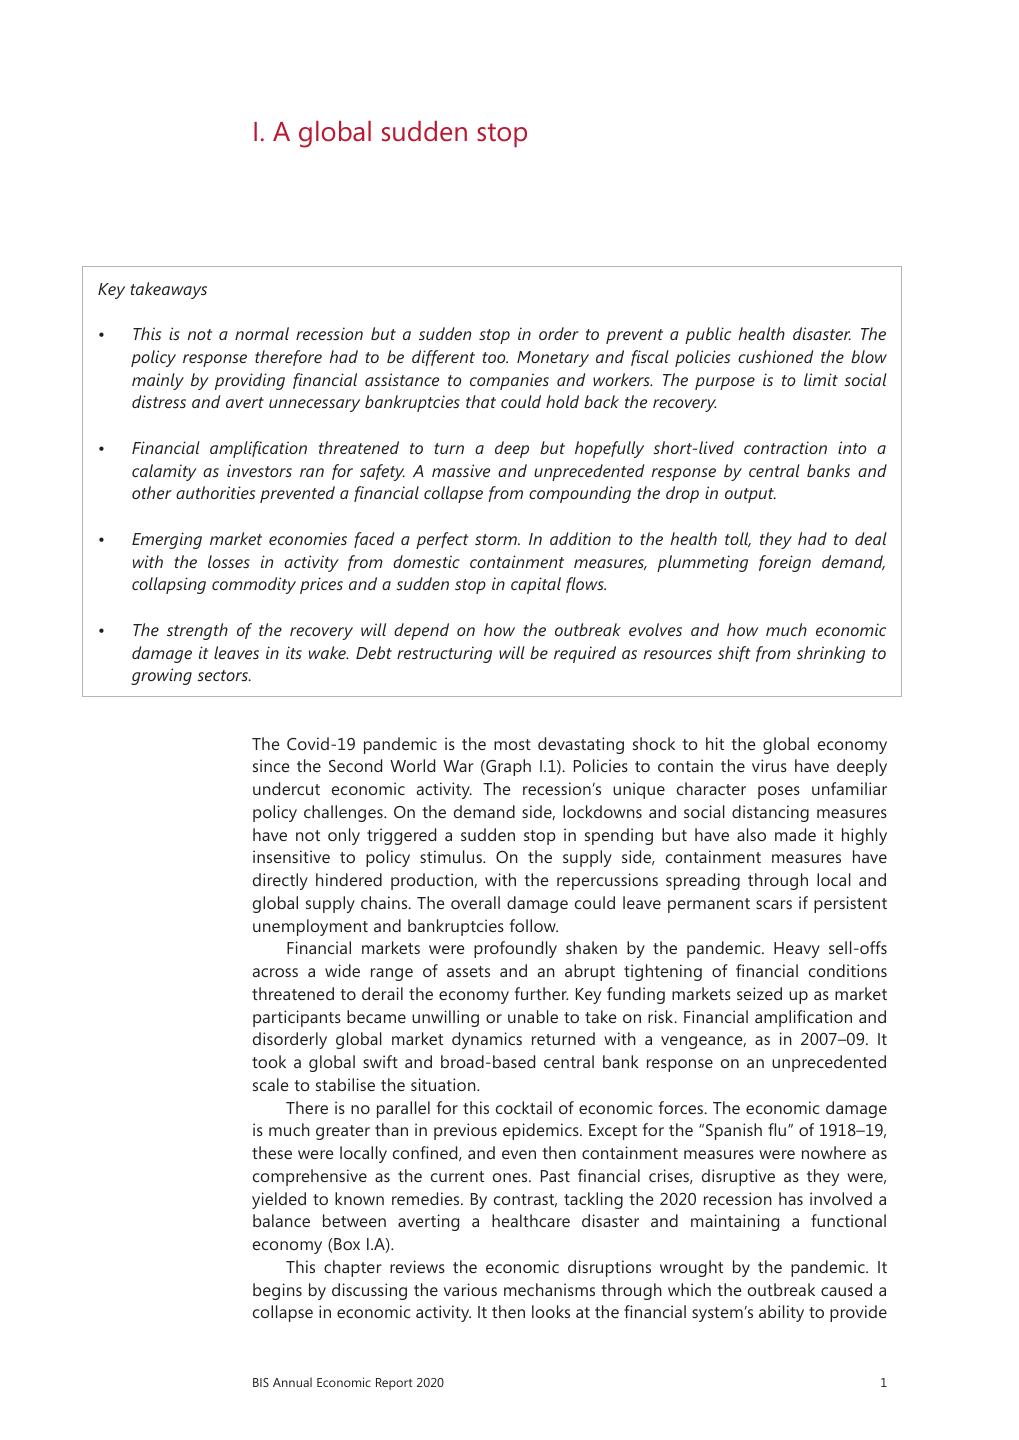
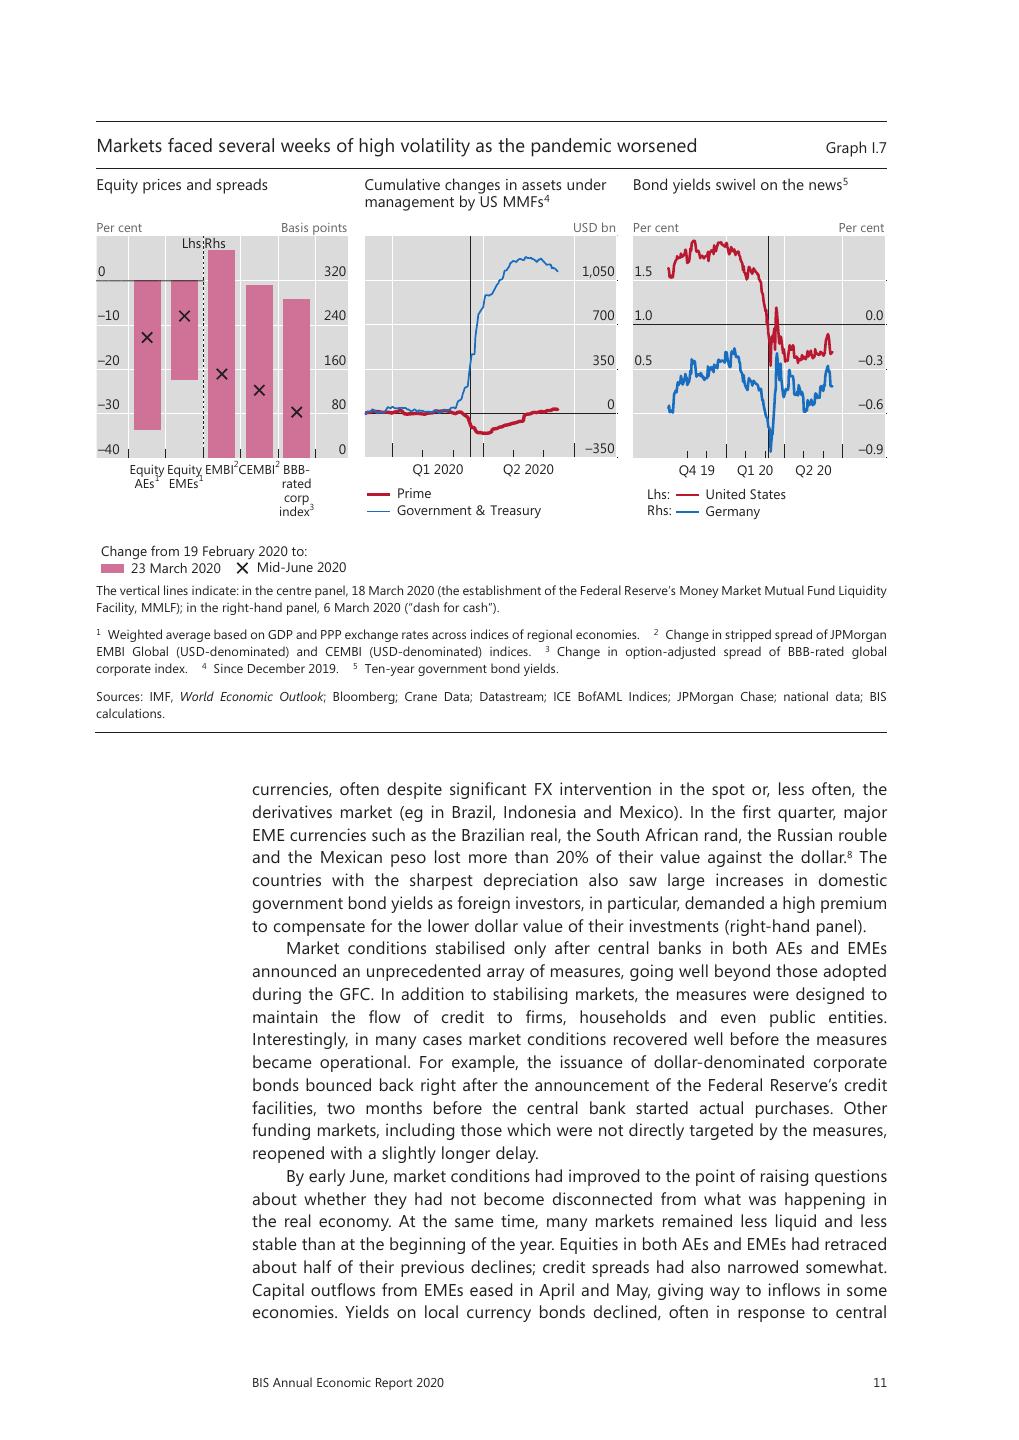
22 . I. A global sudden stop Key takeaways • This is not a normal recession but a sudden stop in order to prevent a public health disaster. The policy response therefore had to be different too. Monetary and fiscal policies cushioned the blow mainly by providing financial assistance to companies and workers. The purpose is to limit social distress and avert unnecessary bankruptcies that could hold back the recovery. • Financial amplification threatened to turn a deep but hopefully short-lived contraction into a calamity as investors ran for safety. A massive and unprecedented response by central banks and other authorities prevented a financial collapse from compounding the drop in output. • Emerging market economies faced a perfect storm. In addition to the health toll, they had to deal with the losses in activity from domestic containment measures, plummeting foreign demand, collapsing commodity prices and a sudden stop in capital flows. • The strength of the recovery will depend on how the outbreak evolves and how much economic damage it leaves in its wake. Debt restructuring will be required as resources shift from shrinking to growing sectors. The Covid-19 pandemic is the most devastating shock to hit the global economy since the Second World War (Graph I.1). Policies to contain the virus have deeply undercut economic activity. The recession’s unique character poses unfamiliar policy challenges. On the demand side, lockdowns and social distancing measures have not only triggered a sudden stop in spending but have also made it highly insensitive to policy stimulus. On the supply side, containment measures have directly hindered production, with the repercussions spreading through local and global supply chains. The overall damage could leave permanent scars if persistent unemployment and bankruptcies follow. Financial markets were profoundly shaken by the pandemic. Heavy sell-offs across a wide range of assets and an abrupt tightening of financial conditions threatened to derail the economy further. Key funding markets seized up as market participants became unwilling or unable to take on risk. Financial amplification and disorderly global market dynamics returned with a vengeance, as in 2007–09. It took a global swift and broad-based central bank response on an unprecedented scale to stabilise the situation. There is no parallel for this cocktail of economic forces. The economic damage is much greater than in previous epidemics. Except for the “Spanish flu” of 1918–19, these were locally confined, and even then containment measures were nowhere as comprehensive as the current ones. Past financial crises, disruptive as they were, yielded to known remedies. By contrast, tackling the 2020 recession has involved a balance between averting a healthcare disaster and maintaining a functional economy (Box I.A). This chapter reviews the economic disruptions wrought by the pandemic. It begins by discussing the various mechanisms through which the outbreak caused a collapse in economic activity. It then looks at the financial system’s ability to provide BIS Annual Economic Report 2020 1
23 . . .. Covid-19 pandemic: the timeline Graph I.1 . .. . Lockdown y . UK fornia . d .. . Easing bar n n nce nce . ha ha K ia ia &U Lom y y i Wu Wu Ind Ind Cal Ital Ital Fra Fra Number of new cases (thousands) 100 125 Full global lockdown = 100 80 100 60 75 40 50 20 25 0 0 Jan 2020 Feb 2020 Mar 2020 Apr 2020 May 2020 Jun 2020 100 100 3 Jan–6 Feb 2020 = 100 80 90 2 Jan 2020 = 100 60 80 40 70 20 60 au : 1 RO s rn B e k dcuss p pu imi P bo ed: u es PE p rch ted s xp ow ion ase P b F ch 0 b lity .3t B l ut LT b + is : 50 n aci $2 5 EC d c ds nd nl EC cut gf sa a n EC read n din pen OP Fed e lened o F F Lhs: Containment stringency index1 Daily new cases by region (rhs): Retail & leisure activity index2 Europe Asia and Pacific Middle East and Africa Rhs: Global equity index3 North America Latin America EME currencies index4 LTRO = long-term refinancing operations; PEPP = pandemic emergency purchase programme. The vertical dashed lines indicate, respectively, 25 March 2020 (US: $2trn fiscal package) and 10 April 2020 (EU: €500bn rescue package). 1 Simple average of containment stringency index for countries with more than 1,000 cumulated Covid-19 cases. Country-level indices calculated from eight indicators of government response. 2 Index shows mobility relative to baseline corresponding to median value of the same day of the week during 3 January–6 February 2020; simple average of the retail and leisure activity index across all countries covered by Google Covid-19 Community Mobility Reports. 3 MSCI all-country world equity index (in US dollars). 4 Federal Reserve Emerging Market Economies Dollar Index. An increase indicates a depreciation of the US dollar. Sources: Federal Reserve Bank of St Louis, FRED; Johns Hopkins University; Oxford University, Blavatnik School of Government; Datastream; Google Covid-19 Community Mobility Reports; BIS calculations. bridge financing to firms and households and identifies possible pressure points. The subsequent section focuses on the policy response. The final one looks forward and discusses possible near- and medium-term scenarios. Chapter II of this report investigates the response of central banks to the Covid-19 disruptions in more detail. 2 BIS Annual Economic Report 2020
24 . Box I.A The Covid-19 pandemic and the policy trade-offs A key question policymakers face in the midst of the pandemic is how to balance public health and economic considerations. Epidemiological research suggests that, without a vaccine or effective treatment, restrictions on social interactions are necessary to prevent the spread of Covid-19 from overwhelming public health systems and to save lives. But shutting down large parts of the economy has major costs as well. Economists have sought to evaluate this trade-off in two ways. One is to convert health and economic outcomes into a common unit of analysis so that costs and benefits can be compared. One such study estimates that three to four months of moderate social distancing measures could save about 1.7 million lives in the United States, mostly the elderly, who are at greatest risk from the virus. Using the government’s age- specific Value of Statistical Life (VSL) estimates (ie how much people are willing to pay for small reductions in their risks of dying from adverse health conditions), the study values the lives saved at over one third of US annual GDP. That said, VSL estimates can be much lower in other countries, tilting the balance in favour of less stringent measures. The second approach to quantifying the benefits and costs of containment policy is to take account of epidemic and macroeconomic interactions using structural models. This approach combines a classic mathematical model of epidemics, the Susceptible-Infected-Removed (SIR) model, with a standard macroeconomic model that takes into account the death-associated probability (SIR-macro). A key insight is that, even in the absence of containment measures, households have an incentive to cut back social interactions and economic activities to avoid being infected. But these actions tend to be too minor because households do not internalise the effect of their behaviour on the overall epidemic and the health of others. This creates an externality and provides a rationale for containment policy. Calibrated SIR-macro models typically favour a containment policy that substantially restricts economic activity over milder voluntary social distancing – Graph I.A illustrates the simulations and welfare calculations of a simple calibrated SIR-macro model. The left-hand and centre panels show, respectively, the evolution of GDP per capita and mortality rates during a hypothetical pandemic. The “myopic” case (red lines) is where households do not change behaviour to avoid becoming infected. A relatively small decline in economic activity occurs largely because some of those infected are too sick to work. But the infection spreads unchecked and stretches the healthcare system so that eventually more than 3% of the population die. The “precautionary” case (blue lines) is where households consciously avoid being infected through voluntary social distancing, by working and consuming less around the peak of the epidemic. This lowers GDP, but also the number of infections and the death toll. The “benevolent” case (yellow lines) shows a socially optimal Macroeconomic and health outcomes from simple macro-SIR model Graph I.A GDP per capita1 Deaths1 Household welfare2 Per cent % of initial population Per cent 0 3 0.0 –10 2 –1.5 –20 1 –3.0 –30 0 –4.5 20 40 60 80 100 20 40 60 80 100 Myopic Precautionary Benevolent Weeks Weeks Health Consumption and labour Myopic Precautionary Benevolent 1 Deviation from a baseline with no pandemic. 2 Effect of each scenario on household welfare expressed as an equivalent percentage change in household consumption. Source: F Boissay, D Rees and P Rungcharoenkitkul, “Dealing with Covid-19: understanding the policy choices”, BIS Bulletin, no 19, May 2020. BIS Annual Economic Report 2020 3
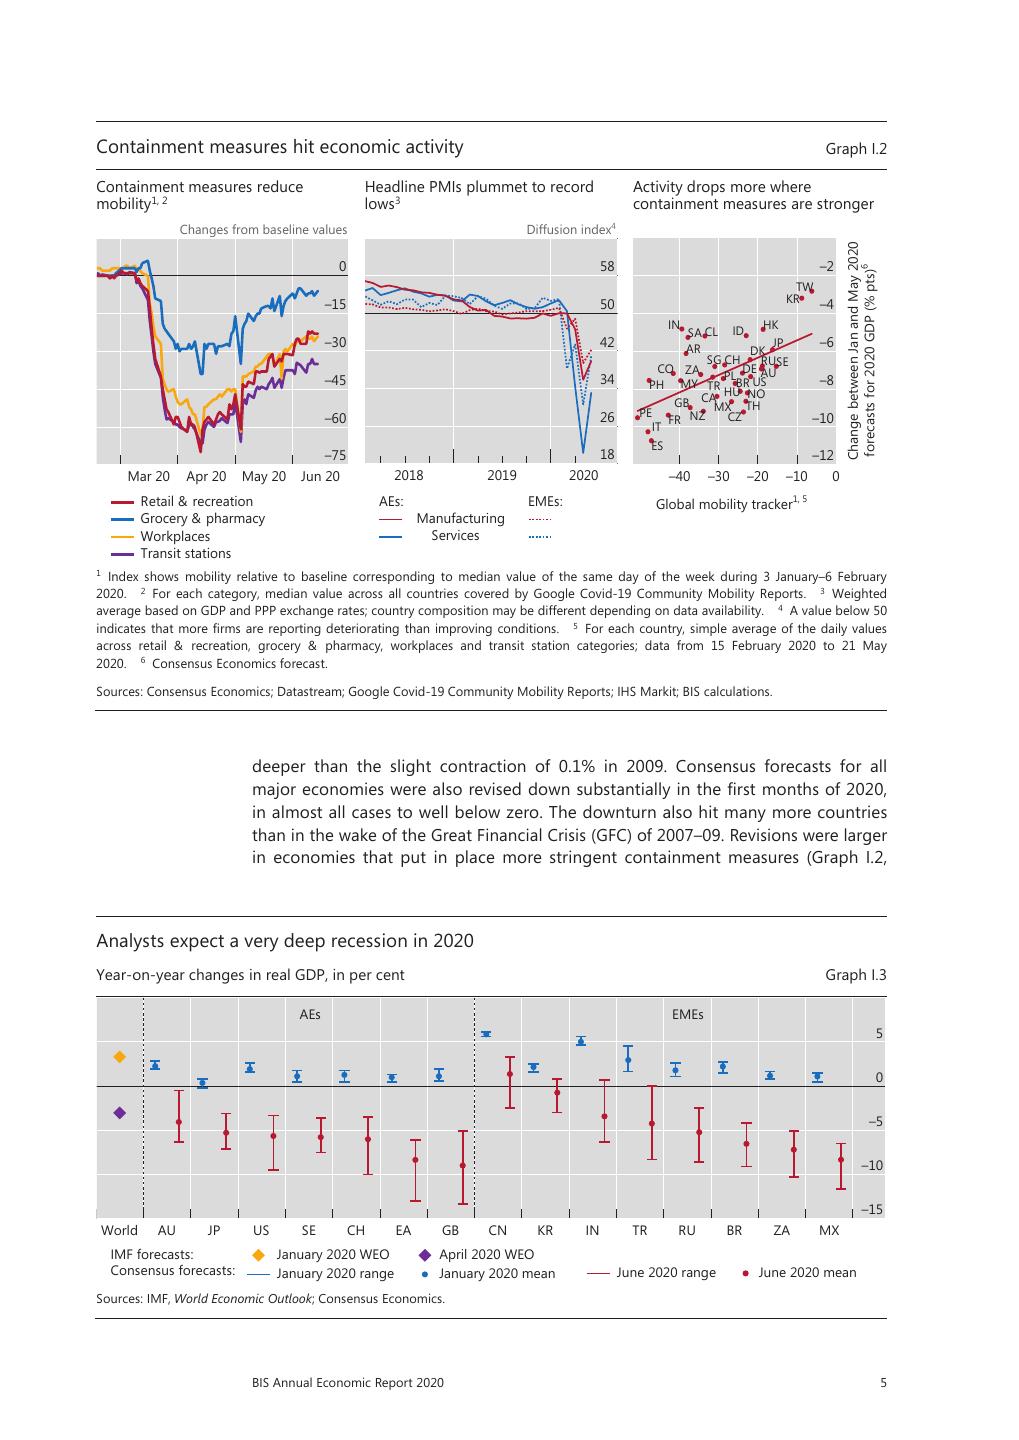
25 .policy response, which takes all externalities into account. This involves a larger and earlier suppression of economic activity, slowing the spread of the virus and reducing the number of deaths even further. Household welfare is highest because the gains from less illness and mortality outweigh the short-term costs of lower consumption (right-hand panel). The high degree of externalities differentiates the present pandemic from public health challenges such as limiting the costs of smoking or car accidents. There is little middle ground between effectively containing the virus and experiencing an uncontrolled outbreak. The benefits of stringent containment may be highly non-linear – they are substantial only when containment is implemented decisively enough. Without public coordination, individual actions are likely to be suboptimally small and to last too long. At the same time, the macroeconomic costs of containment are likely grow with time and become more persistent the longer a lockdown remains in place, a possibility assumed away in most SIR-macro models. The destruction of organisational and human capital, from bankruptcies and layoffs, may inflict long-lasting damage on the economy and society. Keeping corporate bankruptcies to a minimum and averting a protracted slump is thus a key element in the overall evaluation. In countries with weaker social safety nets, the costs of prolonged lockdowns in terms of people’s lives and livelihoods are likely to be much higher. These considerations, which highlight the complexity of the decisions facing policymakers, have yet to be incorporated into a coherent economic framework to inform the potential trade-offs between public health and economic activity. This box is based on F Boissay, D Rees and P Rungcharoenkitkul, “Dealing with Covid-19: understanding the policy choices”, BIS Bulletin, no 19, May 2020. See N Ferguson, “Impact of non-pharmaceutical interventions (NPIs) to reduce Covid-19 mortality and healthcare demand”, Imperial College Covid Response Team, Report 9, 16 March 2020. See M Greenstone and V Nigram, “Does social distancing matter?”, BFI Working Papers, March 2020. Moderate social distancing involves quarantine of symptomatic individuals and their households as well as stringent social distancing for those above 70 years of age. An SIR model captures the joint evolution of susceptible and infected population as well as the rest who have recovered from the disease. Recent papers incorporating an SIR model into macroeconomic settings include M Eichenbaum, S Rebelo and M Trabandt, “The macroeconomics of epidemics”, mimeo, 2020; C Jones, T Philippon and V Venkateswaran, “Optimal mitigation policies in a pandemic”, mimeo, 2020; and F Alvarez, D Argente and F Lippi, “Simple planning problem for Covid-19 lockdown”, mimeo, 2020. The model is a modified version of Jones et al (2020), op cit. The calibration of epidemiological and macroeconomic parameters mirrors that in the literature. The cost of one death in an average household is conservatively set at five years’ worth of consumption, compared with the 10 years’ worth implied by the VSL analysis of Greenstone and Nigram (2020), op cit. Economic activity plunged Global economic activity contracted sharply in March and April as policymakers forced an economic sudden stop. To contain the spread of the virus, authorities around the globe shut down some activities, mostly services that involve either large crowds or close human contact, such as entertainment, tourism, restaurants, retailing (other than necessities) and personal care (Graph I.2, left-hand panel). In addition, social distancing measures disrupted production in other sectors that require a high degree of collective activity on-site, such as manufacturing and construction. In manufacturing, disruptions also percolated along the (local and global) supply chain. Output may also have suffered if working from home reduced productivity. Economic activity indicators plummeted. Purchasing managers’ indices (PMIs) recorded new lows. The decline was steeper for the indices covering services, which are directly affected by social distancing (Graph I.2, centre panel). In many countries, the ensuing contraction was the largest swing in economic activity in living memory. Global GDP contracted by more than 10% in the first quarter of 2020, even though most countries imposed containment measures only towards the end of the quarter; forecasters expect a much larger drop in almost all economies during the second. The April 2020 IMF forecasts saw the global economy shrinking by 3% for the year as a whole, a downward revision of 6.4 percentage points from assessments made at the beginning of the year (Graph I.3) and far 4 BIS Annual Economic Report 2020
26 .Containment measures hit economic activity Graph I.2 Containment measures reduce Headline PMIs plummet to record Activity drops more where mobility1, 2 lows 3 containment measures are stronger Changes from baseline values Diffusion index4 Change between Jan and May 2020 0 58 –2 6 forecasts for 2020 GDP (% pts) TW –15 50 KR –4 IN HK SA CL ID –30 42 AR JP –6 DK SG CH RUSE CO ZA DE AU –45 34 PL –8 PH MY TR BR US HU NO GB CAMX TH –60 26 PE NZ CZ –10 FR IT ES –75 18 –12 Mar 20 Apr 20 May 20 Jun 20 2018 2019 2020 –40 –30 –20 –10 0 Retail & recreation AEs: EMEs: Global mobility tracker 1, 5 Grocery & pharmacy Manufacturing Workplaces Services Transit stations 1 Index shows mobility relative to baseline corresponding to median value of the same day of the week during 3 January–6 February 2020. 2 For each category, median value across all countries covered by Google Covid-19 Community Mobility Reports. 3 Weighted average based on GDP and PPP exchange rates; country composition may be different depending on data availability. 4 A value below 50 indicates that more firms are reporting deteriorating than improving conditions. 5 For each country, simple average of the daily values across retail & recreation, grocery & pharmacy, workplaces and transit station categories; data from 15 February 2020 to 21 May 2020. 6 Consensus Economics forecast. Sources: Consensus Economics; Datastream; Google Covid-19 Community Mobility Reports; IHS Markit; BIS calculations. deeper than the slight contraction of 0.1% in 2009. Consensus forecasts for all major economies were also revised down substantially in the first months of 2020, in almost all cases to well below zero. The downturn also hit many more countries than in the wake of the Great Financial Crisis (GFC) of 2007–09. Revisions were larger in economies that put in place more stringent containment measures (Graph I.2, Analysts expect a very deep recession in 2020 Year-on-year changes in real GDP, in per cent Graph I.3 AEs EMEs 5 0 –5 –10 –15 World AU JP US SE CH EA GB CN KR IN TR RU BR ZA MX IMF forecasts: January 2020 WEO April 2020 WEO Consensus forecasts: January 2020 range January 2020 mean June 2020 range June 2020 mean Sources: IMF, World Economic Outlook; Consensus Economics. BIS Annual Economic Report 2020 5
27 .right-hand panel). Emerging market economies (EMEs) were particularly hard hit, given their typically less well resourced health systems and the constellation of economic forces (see below).1 Consumption collapsed as the range of expenditure opportunities narrowed and economic prospects darkened. Many households saved more in response to high uncertainty about future income. Layoffs and wage cuts took their toll, with the blow amplified by the labour-intensive character of many of the services most affected. In the United States, for instance, over 40 million workers claimed unemployment benefits between March and June (Graph I.4, left-hand panel). In Europe, unemployment increased much less, although it would have been higher had it not been for special government schemes subsidising workers in employment. In many EMEs, the large informal economy hid the true extent of the rise in unemployment. The moderate rise in the official unemployment rate in many EMEs since end-2019 (Graph I.4, centre panel) does not cover the informal sector, which accounts for a significant share of employment in many economies, especially in Latin America and South Asia (right-hand panel). These informal workers are vulnerable to losing their jobs, as they tend to concentrate in small firms or in some of the hardest-hit services. The International Labour Organization estimates that, in the absence of income support measures, the earnings of informal workers in the first month of the crisis would have declined by up to 81% in Latin America and 69% in Europe and Central Asia.2 In India, a local think tank estimates that some 90 million Indian workers, most of them employed in the informal sector as small traders and wage labourers, lost their jobs in just one month during the lockdown that began in late March.3 Depressed demand and high uncertainty also curtailed investment. Many firms cut capital expenditure and dividend payments to preserve cash holdings. Even so, simulations using firm-level data show that many firms have insufficient buffers to survive an extended shortfall in revenues without external support (Box I.B). Unemployment soars Graph I.4 Surge in jobless, short-time workers Unemployment rate in EMEs, Widespread informal employment5 changes from end-20194 Millions Millions Percentage points Percentage of total employment 12.3 Asian Latin America Other EMEs 10.3 EMEs 36 12 2.8 80 27 9 2.1 60 18 6 1.4 40 9 3 0.7 20 0 0 0.0 0 Mar 2020 Apr 2020 May 2020 PH RU KR MY MX ID TH BR CO PE TR CO CZ CN BR TH PH AR CL MX RU ZA Lhs: US 1 Rhs: DE2 FR3 1 Weekly initial jobless claims, cumulative since early March. 2 Cumulative number of “Kurzarbeit” notifications, in terms of number of employees, since February 2020. 3 Cumulative number of “chômage partiel” applications, in terms of number of employees. 4 Data up to May 2020 or latest available, depending on country. 5 Data correspond to latest available data. According to ILO definition. For BR and MX, informal employment refers to workers not contributing to social security systems. Sources: Inter-American Development Bank, Information System on Labor Markets and Social Security (SIMS); International Labour Organization; Datastream; national data; BIS calculations. 6 BIS Annual Economic Report 2020
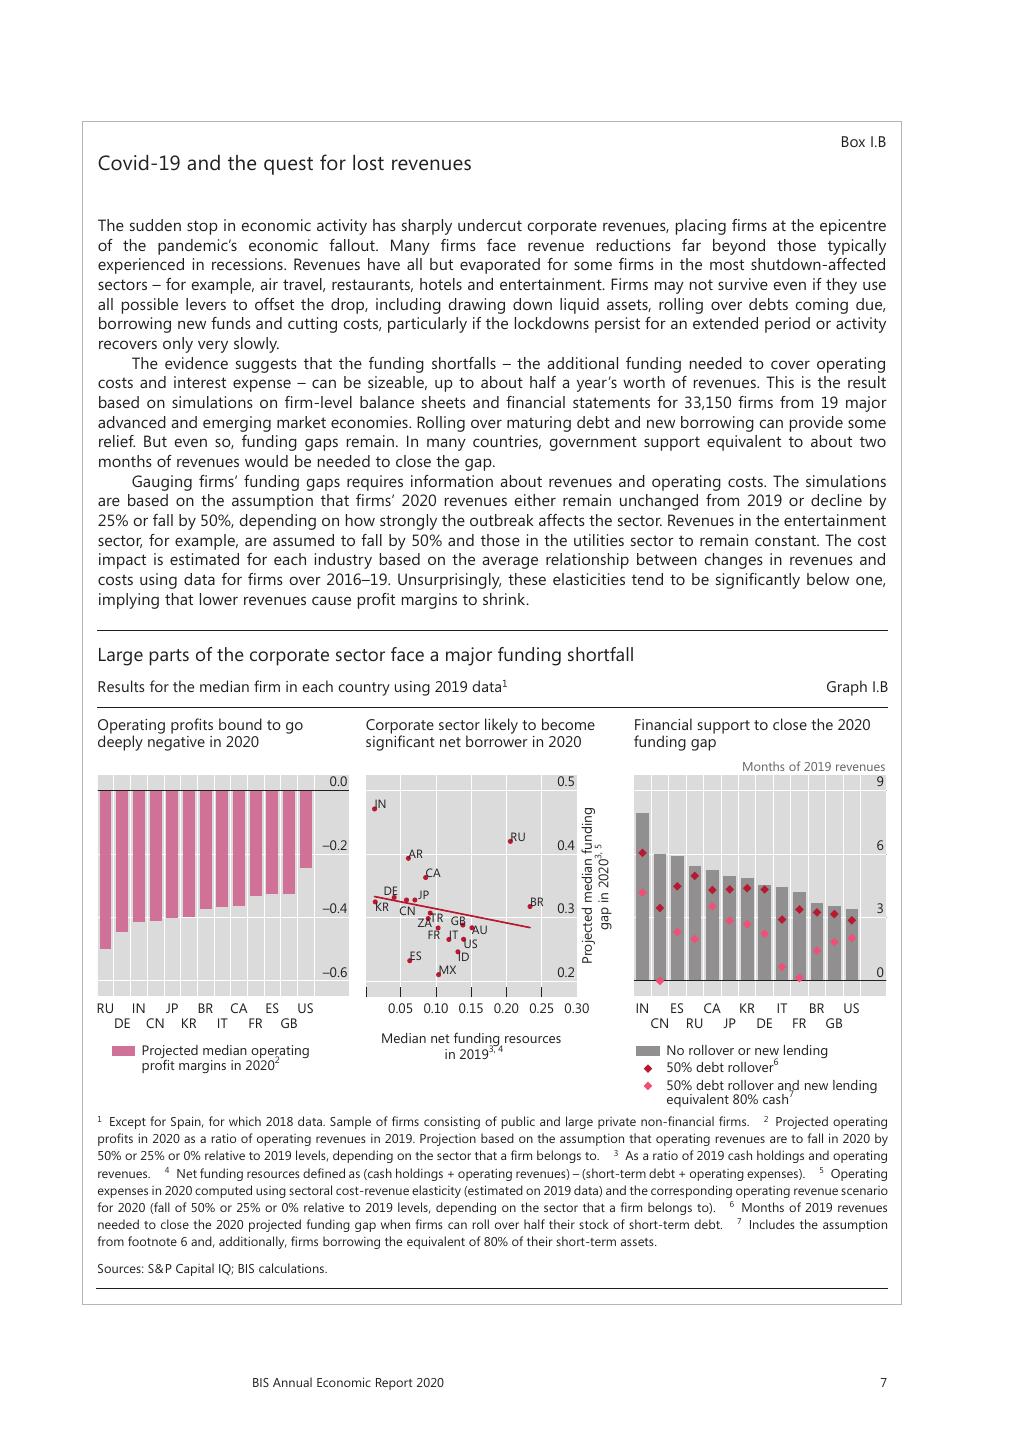
28 . Box I.B Covid-19 and the quest for lost revenues The sudden stop in economic activity has sharply undercut corporate revenues, placing firms at the epicentre of the pandemic’s economic fallout. Many firms face revenue reductions far beyond those typically experienced in recessions. Revenues have all but evaporated for some firms in the most shutdown-affected sectors – for example, air travel, restaurants, hotels and entertainment. Firms may not survive even if they use all possible levers to offset the drop, including drawing down liquid assets, rolling over debts coming due, borrowing new funds and cutting costs, particularly if the lockdowns persist for an extended period or activity recovers only very slowly. The evidence suggests that the funding shortfalls – the additional funding needed to cover operating costs and interest expense – can be sizeable, up to about half a year’s worth of revenues. This is the result based on simulations on firm-level balance sheets and financial statements for 33,150 firms from 19 major advanced and emerging market economies. Rolling over maturing debt and new borrowing can provide some relief. But even so, funding gaps remain. In many countries, government support equivalent to about two months of revenues would be needed to close the gap. Gauging firms’ funding gaps requires information about revenues and operating costs. The simulations are based on the assumption that firms’ 2020 revenues either remain unchanged from 2019 or decline by 25% or fall by 50%, depending on how strongly the outbreak affects the sector. Revenues in the entertainment sector, for example, are assumed to fall by 50% and those in the utilities sector to remain constant. The cost impact is estimated for each industry based on the average relationship between changes in revenues and costs using data for firms over 2016–19. Unsurprisingly, these elasticities tend to be significantly below one, implying that lower revenues cause profit margins to shrink. Large parts of the corporate sector face a major funding shortfall Results for the median firm in each country using 2019 data1 Graph I.B Operating profits bound to go Corporate sector likely to become Financial support to close the 2020 deeply negative in 2020 significant net borrower in 2020 funding gap Months of 2019 revenues 0.0 0.5 9 IN Projected median funding RU –0.2 0.4 6 gap in 20203, 5 AR CA DE JP KR CN BR –0.4 0.3 3 ZATR GB FR IT AU US ES ID –0.6 MX 0.2 0 RU IN JP BR CA ES US 0.05 0.10 0.15 0.20 0.25 0.30 IN ES CA KR IT BR US DE CN KR IT FR GB CN RU JP DE FR GB Median net funding resources Projected median operating in 20193, 4 No rollover or new lending profit margins in 20202 50% debt rollover6 50% debt rollover and new lending equivalent 80% cash7 1 Except for Spain, for which 2018 data. Sample of firms consisting of public and large private non-financial firms. 2 Projected operating profits in 2020 as a ratio of operating revenues in 2019. Projection based on the assumption that operating revenues are to fall in 2020 by 50% or 25% or 0% relative to 2019 levels, depending on the sector that a firm belongs to. 3 As a ratio of 2019 cash holdings and operating revenues. 4 Net funding resources defined as (cash holdings + operating revenues) – (short-term debt + operating expenses). 5 Operating expenses in 2020 computed using sectoral cost-revenue elasticity (estimated on 2019 data) and the corresponding operating revenue scenario for 2020 (fall of 50% or 25% or 0% relative to 2019 levels, depending on the sector that a firm belongs to). 6 Months of 2019 revenues needed to close the 2020 projected funding gap when firms can roll over half their stock of short-term debt. 7 Includes the assumption from footnote 6 and, additionally, firms borrowing the equivalent of 80% of their short-term assets. Sources: S&P Capital IQ; BIS calculations. BIS Annual Economic Report 2020 7
29 . Based on these inputs, simulations show that a large number of firms are likely to face operating losses in 2020 (Graph I.B, left-hand panel). In all countries, the median firm would swing from comfortable profits (above 5% of revenues) in 2019 to losses well in excess of 20% of its 2019 revenues. Unsurprisingly, firms in countries with larger 2019 profit margins would face lower losses. But in some cases, this result could flip because of the sectoral composition of output. For instance, a severe revenue shock could drive Brazilian or Canadian firms deeply into the red, despite strong 2019 profits, mainly reflecting deep contractions in commodity sectors and, in Canada, transport equipment manufacturing. In Russia, oil looms large. In spite of strong profits in 2019, Russian firms could face losses in 2020 in excess of 40% of their 2019 revenues, reflecting the Russian economy’s large exposure to oil. Firms also need to continue serving their financial liabilities in addition to covering operational expenses. Given the extent of projected losses, liquid asset holdings could fall short of operating losses and debt service costs (Graph I.B, centre panel). Simulations suggest that the funding shortfall for the median firm could amount to 20% of the sum of operating expenses and debt service costs. In some countries, it could even reach 40%. Large funding shortfalls suggest that firms will need financial support. This could take several forms. First, firms could ask for maturing debt to be rolled over. Second, they could borrow against their assets, even if these are temporarily illiquid. Lastly, they could benefit from grants, loan guarantees, direct loans or schemes such as furlough programmes, which reduce operating costs by covering part of the wage bill. Such measures could make a big difference. For instance, in a scenario where firms cannot borrow and have to repay their maturing debt, the median firm in many countries would need public support equivalent to about six months of revenues (Graph I.B, right-hand panel). This would fall to an average across countries of two months of revenues if firms could roll over half the debt coming due in 2020 and borrow to the tune of 80% of their short-term assets. These averages hide a large variation across countries. In some, such as China and France, rolling over debt and borrowing against short-term assets would allow the median firm to close the funding gap entirely. In others, such as Canada or India, where many firms belong to hard-hit sectors or where profitability in 2019 was low, firms would need significant additional fund injections – equivalent to four months of revenues – even if they rolled over debt and obtained new loans. Trade credits/payables are assumed to be broadly balanced in the simulations. International spillovers from the various supply and demand disruptions worsened the blow. Global trade volumes fell sharply in early 2020 (Graph I.5, left- hand panel).4 The automotive industry was hit especially hard, given the large number of suppliers in production networks spanning several countries. As early as February, shortages of parts produced in China forced car manufacturers in Japan and Korea to temporarily shut down plants. And just when production of Chinese auto parts resumed in early March, containment measures in Europe and the United States forced many manufacturers to halt production and cancel orders placed with EMEs. Mexican parts manufacturers felt the full force of plant shutdowns in the United States, as over 85% of Mexican parts exports were US- bound in 2019. Restrictions on international cargo and passenger transport were another source of disruption. Port closures and revised customs clearance procedures created bottlenecks in international sea freight. Major port terminals in China reported a 24% year-on-year decline in containerised sea freight in February 2020 (Graph I.5, centre panel). Bans on international travel depressed air passenger traffic. By mid-May, scheduled flights had seen a year-on-year decline of more than 60% globally (right-hand panel), with many routes completely shut down. This crippled air freight capacity. The fear of contagion and travel bans depressed tourism. Popular new-year destinations for Chinese tourists, such as Thailand, were hit first, but within a couple of months global tourism came to a halt. Inbound tourism accounts for over 10% of GDP in Greece, Iceland and Thailand. Its share in employment is even larger. The 8 BIS Annual Economic Report 2020


