- 快召唤伙伴们来围观吧
- 微博 QQ QQ空间 贴吧
- 文档嵌入链接
- 复制
- 微信扫一扫分享
- 已成功复制到剪贴板
中国宅经济
展开查看详情
1 .M M July 7, 2020 08:00 PM GMT Mapping the New Normal Consumers and China's Stay- Home Economy We see three trends ahead for Chinese consumption after Covid-19: reshoring, consolidation, and upgrading. We expect reshoring to lift domestic consumption by about US$100bn per year in 2021-23, boosting the key luxury, beauty, sportswear, and travel and leisure categories by around 10%. Robin Xing, Jenny Zheng, and Zhipeng Cai are economists and are not opining on any securities. Their views are clearly delineated. Morgan Stanley does and seeks to do business with companies covered in Morgan Stanley Research. As a result, investors should be aware that the firm may have a conflict of interest that could affect the objectivity of Morgan Stanley Research. Investors should consider Morgan Stanley Research as only a single factor in making their investment decision. For analyst certification and other important disclosures, refer to the Disclosure Section, located at the end of this report. += Analysts employed by non-U.S. affiliates are not registered with FINRA, may not be associated persons of the member and may not be subject to FINRA restrictions on communications with a subject company, public appearances and trading securities held by a research analyst account.
2 .每日免费获取报告 1、每日微信群内分享7+最新重磅报告; 2、每日分享当日华尔街日报、金融时报; 3、每周分享经济学人 4、行研报告均为公开版,权利归原作者 所有,起点财经仅分发做内部学习。 扫一扫二维码 关注公号 回复:研究报告 加入“起点财经”微信群
3 .M M Contributors MORGAN STANLEY ASIA LIMITED+ MORGAN STANLEY ASIA LIMITED+ MORGAN STANLEY ASIA LIMITED+ Lillian Lou Robin Xing Hanli Fan, CFA Equity Analyst Economist Equity Analyst +852 2848-6502 +852 2848-6511 +852 3963-1017 Lillian.Lou@morganstanley.com Robin.Xing@morganstanley.com Hanli.Fan@morganstanley.com MORGAN STANLEY ASIA LIMITED+ MORGAN STANLEY ASIA LIMITED+ MORGAN STANLEY ASIA LIMITED+ Jenny Zheng, CFA Zhipeng Cai Hildy Ling Economist Economist Equity Analyst +852 3963-4015 +852 2239-7820 +852 2239-7834 Jenny.L.Zheng@morganstanley.com Zhipeng.Cai@morganstanley.com Hildy.Ling@morganstanley.com MORGAN STANLEY & CO. INTERNATIONAL PLC, SEOUL BRANCH+ MORGAN STANLEY & CO. INTERNATIONAL PLC+ MORGAN STANLEY ASIA LIMITED+ Kelly H Kim, CFA Edouard Aubin Praveen K Choudhary Equity Analyst Equity Analyst Equity Analyst +82 2 399-4837 +44 20 7425-3160 +852 2848-5068 Kelly.Kim@morganstanley.com Edouard.Aubin@morganstanley.com Praveen.Choudhary@morganstanley.com MORGAN STANLEY ASIA LIMITED+ MORGAN STANLEY ASIA LIMITED+ MORGAN STANLEY ASIA LIMITED+ Dustin Wei Jack Yeung Shelley Wang, CFA Equity Analyst Equity Analyst Equity Analyst +852 2239-7823 +852 2239-7843 +852 3963-0047 Dustin.Wei@morganstanley.com Jack.Yeung@morganstanley.com Shelley.Wang@morganstanley.com MORGAN STANLEY ASIA LIMITED+ MORGAN STANLEY ASIA LIMITED+ MORGAN STANLEY ASIA LIMITED+ Gary Yu Eddy Wang, CFA Qianlei Fan, CFA Equity Analyst Equity Analyst Equity Analyst +852 2848-6918 +852 2239-7339 +852 2239-1875 Gary.Yu@morganstanley.com Eddy.Wang@morganstanley.com Qianlei.Fan@morganstanley.com MORGAN STANLEY ASIA LIMITED+ MORGAN STANLEY TAIWAN LIMITED+ MORGAN STANLEY ASIA LIMITED+ Leaf Liu Terence Cheng Alfred Chen Equity Analyst Equity Analyst Research Associate +852 3963-1905 +886 2 2730-2873 +852 3963-0533 Leaf.Liu@morganstanley.com Terence.Cheng@morganstanley.com Alfred.Chen@morganstanley.com MORGAN STANLEY ASIA LIMITED+ MORGAN STANLEY ASIA LIMITED+ MORGAN STANLEY TAIWAN LIMITED+ Wilkins Tong Edward Zhou Angela Hsu Research Associate Research Associate Equity Analyst +852 2848-7408 +852 3963-0528 +886 2 2730-2995 Wilkins.Tong@morganstanley.com Edward.MH.Zhou@morganstanley.com Angela.Hsu@morganstanley.com
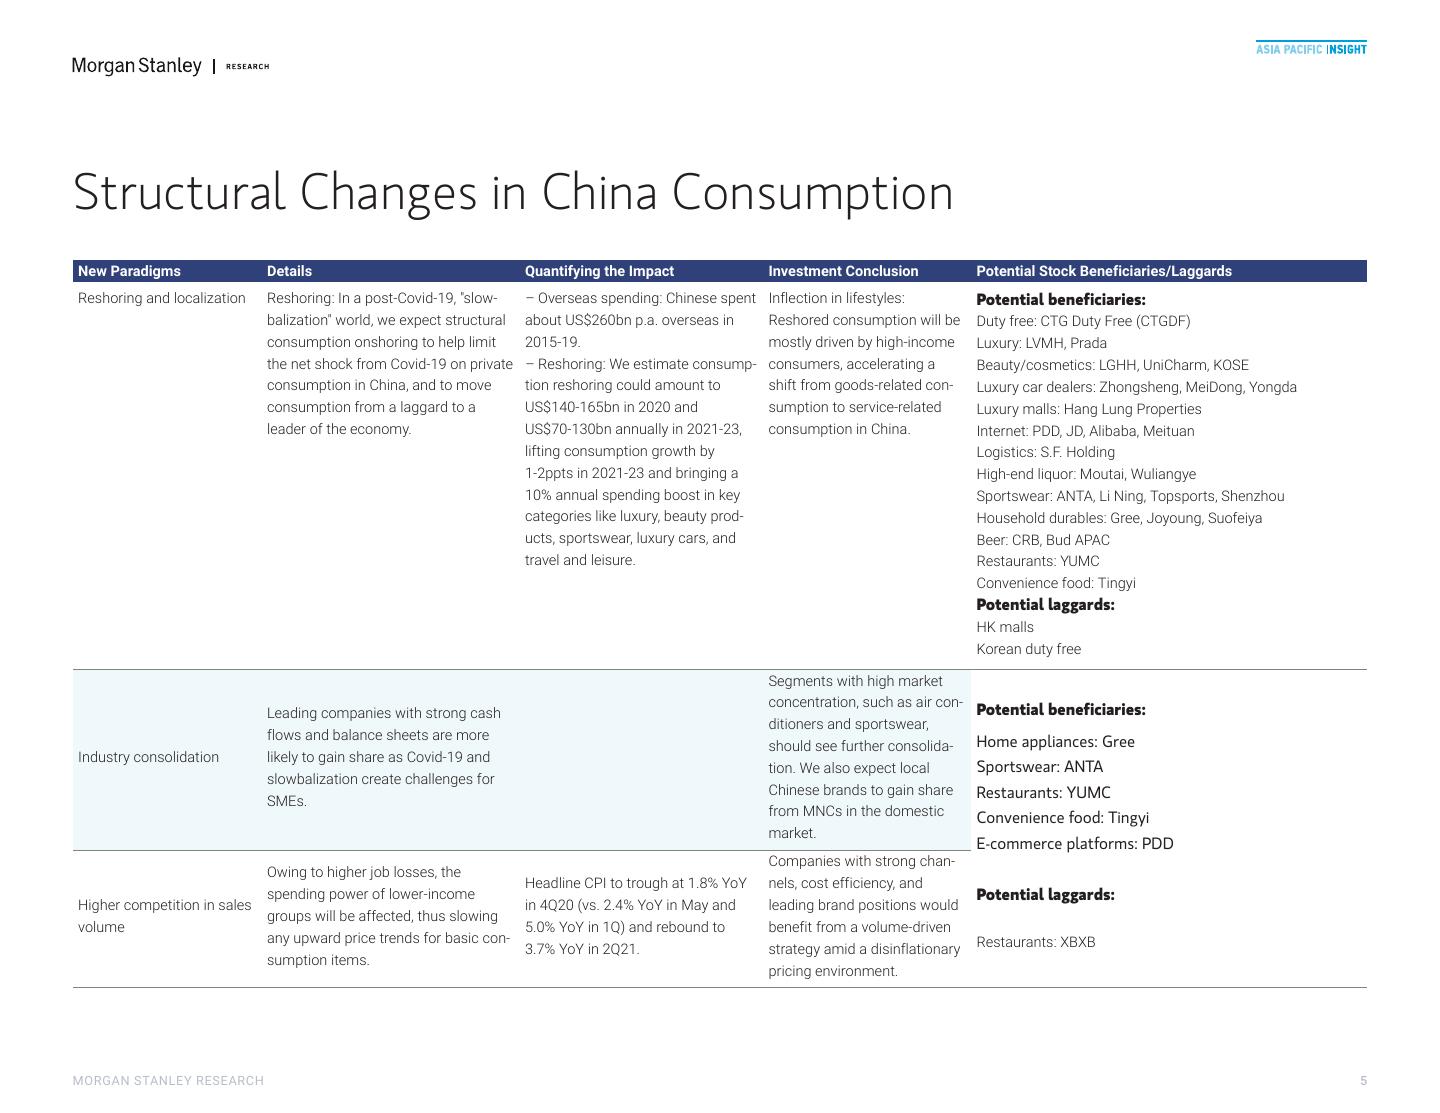
4 .M M Mapping the New Normal Consumers and China's Stay- Home Economy W e see three trends ahead for Chinese consumption after Covid-19: reshoring, consolidation, and upgrading. We expect reshoring to lift domestic consumption by about US$100bn per year in 2021-23, boosting the key luxury, beauty, sportswear, and travel and leisure categories by around 10%. Steady consumption recovery amid Industry View brand awareness. (3) More MNCs adopting an "in China, for the rise of the "stay-home" economy: In-Line China" strategy, in view of the nation's booming consumption We expect China's private consumption market with additional support from reshoring, as well as policy- to resume its pre-Covid growth trend of 8% YoY by year-end, and makers' efforts to further open up to retain supply chains. (4) reach exceptionally strong growth of 10.5% in 2021. In addition to Higher volume competition in basic household goods, driven cyclical drivers such as policy easing, reopening of service sectors, by the still-subdued job market and income growth, as well as by and the unleashing of pent-up demand, the structural trend of increased supply from reshoring of export-oriented SMEs. reshoring amid slowbalization should foster domestic consump- Structurally, we think the following names will benefit: China tion over the next few years. We estimate that reshored con- Tourism Group Duty Free (CTGDF), LVMH, Prada, LGHH, sumption could amount to US$140-165bn this year and US$70- Shiseido, Unicharm, KOSE, Zhongsheng, MeiDong, Yongda, Hang 130bn in each of the subsequent 2-3 years (27-50% of Chinese Lung Properties, PDD, JD, Alibaba, Meituan, S.F. Holding, ANTA, Li overseas spending in 2019), mitigating the impact of Covid-19 on Ning, Topsports, Shenzhou, Gree, Joyoung, Suofeiya, Moutai, 2020 domestic demand and supplementing consumption Wuliangye, CRB, Bud APAC, YUMC, and Tingyi. growth by 1-2ppts in 2021-23. Where we could be wrong: (1) Faster normalization of interna- Reshored consumption demand will mainly benefit luxury, tional travel; (2) weaker economic growth in China that could fur- beauty products, sportswear, luxury cars, and travel and lei- ther dampen consumer confidence and spending; (3) tighter sure – segments that we estimate have a combined market size market liquidity that affects market sentiment negatively and of US$1trn. We estimate that reshored consumption will lift the leads to lower valuations. size of these categories by roughly 10%. We also expect spillover effects to boost domestic consumption in other categories, such as duty-free shopping, premium shopping malls, household dura- bles, and convenience type products. Reshoring to bolster four megatrends: (1) A faster transition to life-quality-enhancing consumption, led by higher-income groups. (2) Further market consolidation, driven by leading players' strong balance sheets, localization, and consumers'
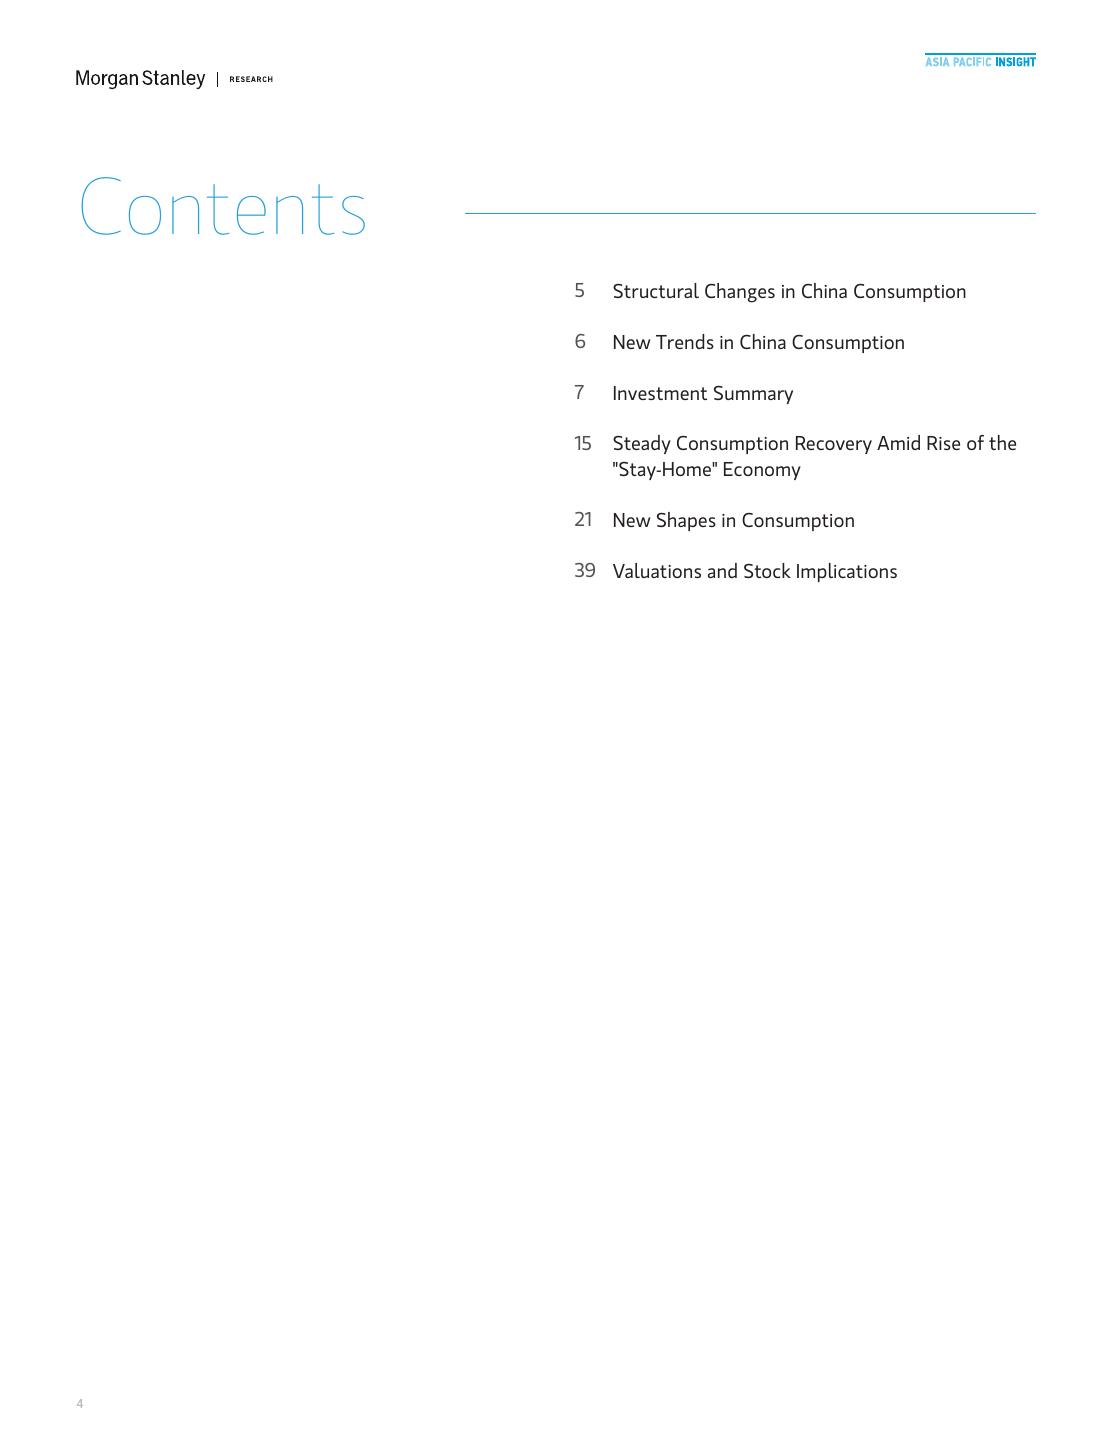
5 .M M Contents 5 Structural Changes in China Consumption 6 New Trends in China Consumption 7 Investment Summary 15 Steady Consumption Recovery Amid Rise of the "Stay-Home" Economy 21 New Shapes in Consumption 39 Valuations and Stock Implications 4
6 .MM Structural Changes in China Consumption New Paradigms Details Quantifying the Impact Investment Conclusion Potential Stock Beneficiaries/Laggards Reshoring and localization Reshoring: In a post-Covid-19, "slow- – Overseas spending: Chinese spent Inflection in lifestyles: Potential beneficiaries: balization" world, we expect structural about US$260bn p.a. overseas in Reshored consumption will be Duty free: CTG Duty Free (CTGDF) consumption onshoring to help limit 2015-19. mostly driven by high-income Luxury: LVMH, Prada the net shock from Covid-19 on private – Reshoring: We estimate consump- consumers, accelerating a Beauty/cosmetics: LGHH, UniCharm, KOSE consumption in China, and to move tion reshoring could amount to shift from goods-related con- Luxury car dealers: Zhongsheng, MeiDong, Yongda consumption from a laggard to a US$140-165bn in 2020 and sumption to service-related Luxury malls: Hang Lung Properties leader of the economy. US$70-130bn annually in 2021-23, consumption in China. Internet: PDD, JD, Alibaba, Meituan lifting consumption growth by Logistics: S.F. Holding 1-2ppts in 2021-23 and bringing a High-end liquor: Moutai, Wuliangye 10% annual spending boost in key Sportswear: ANTA, Li Ning, Topsports, Shenzhou categories like luxury, beauty prod- Household durables: Gree, Joyoung, Suofeiya ucts, sportswear, luxury cars, and Beer: CRB, Bud APAC travel and leisure. Restaurants: YUMC Convenience food: Tingyi Potential laggards: HK malls Korean duty free Segments with high market concentration, such as air con- Leading companies with strong cash Potential beneficiaries: ditioners and sportswear, flows and balance sheets are more Home appliances: Gree should see further consolida- Industry consolidation likely to gain share as Covid-19 and tion. We also expect local Sportswear: ANTA slowbalization create challenges for Chinese brands to gain share Restaurants: YUMC SMEs. from MNCs in the domestic Convenience food: Tingyi market. E-commerce platforms: PDD Companies with strong chan- Owing to higher job losses, the Headline CPI to trough at 1.8% YoY nels, cost efficiency, and spending power of lower-income Potential laggards: Higher competition in sales in 4Q20 (vs. 2.4% YoY in May and leading brand positions would groups will be affected, thus slowing volume 5.0% YoY in 1Q) and rebound to benefit from a volume-driven any upward price trends for basic con- Restaurants: XBXB 3.7% YoY in 2Q21. strategy amid a disinflationary sumption items. pricing environment. MORGAN STANLEY RESEARCH 5
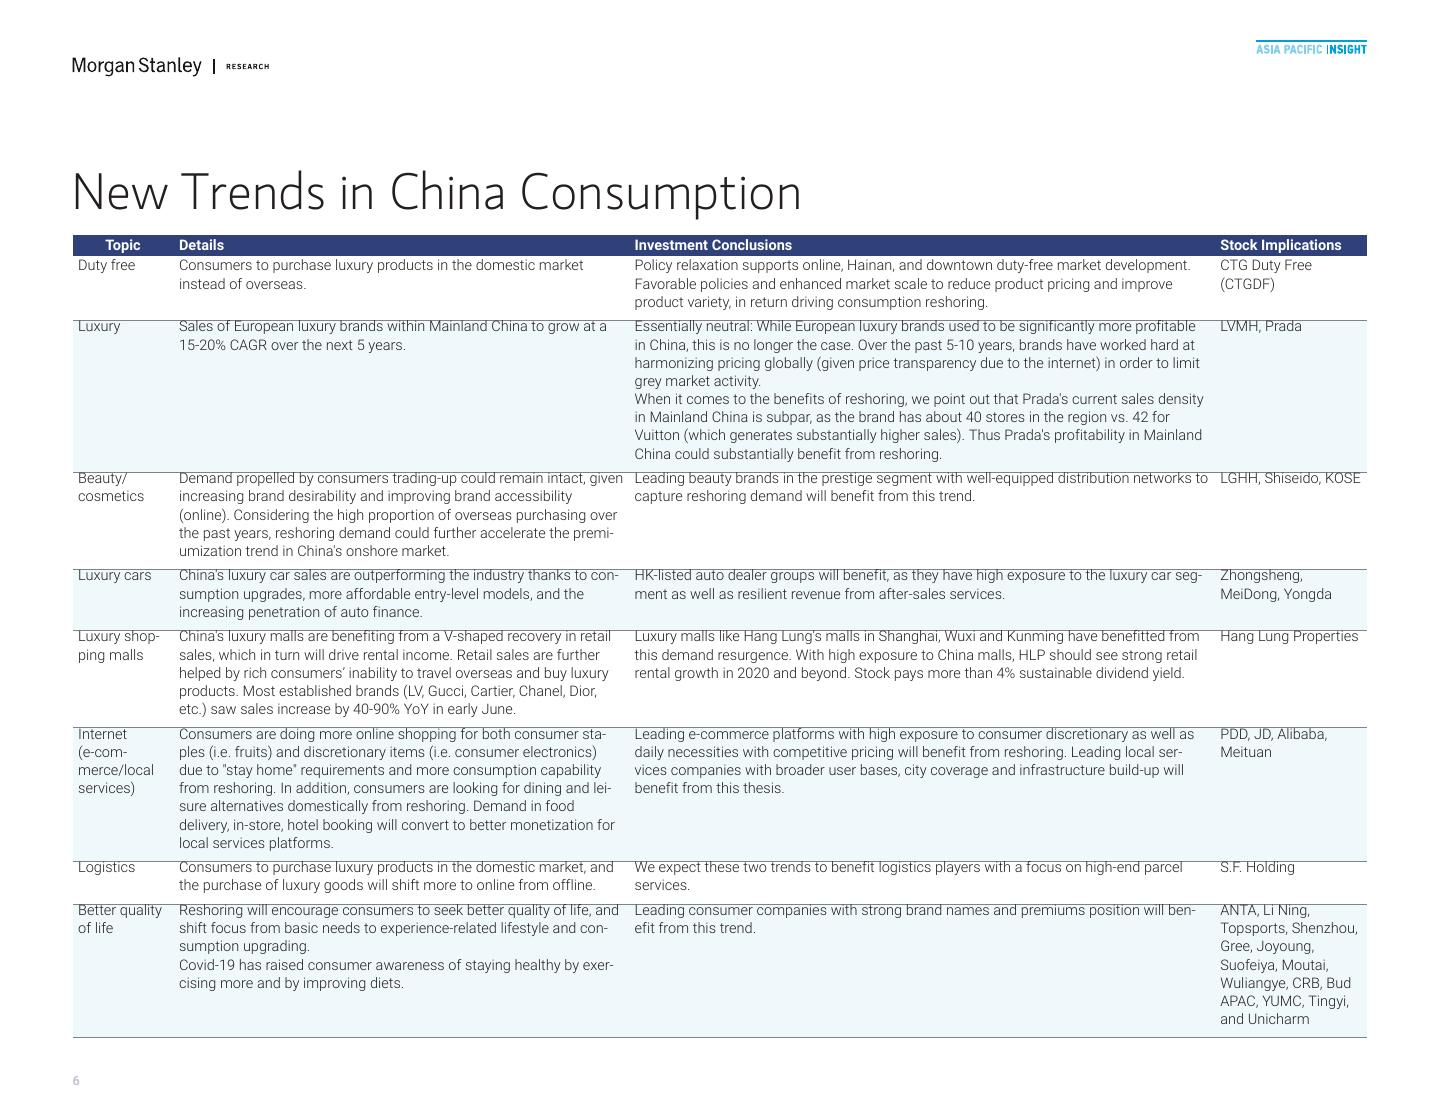
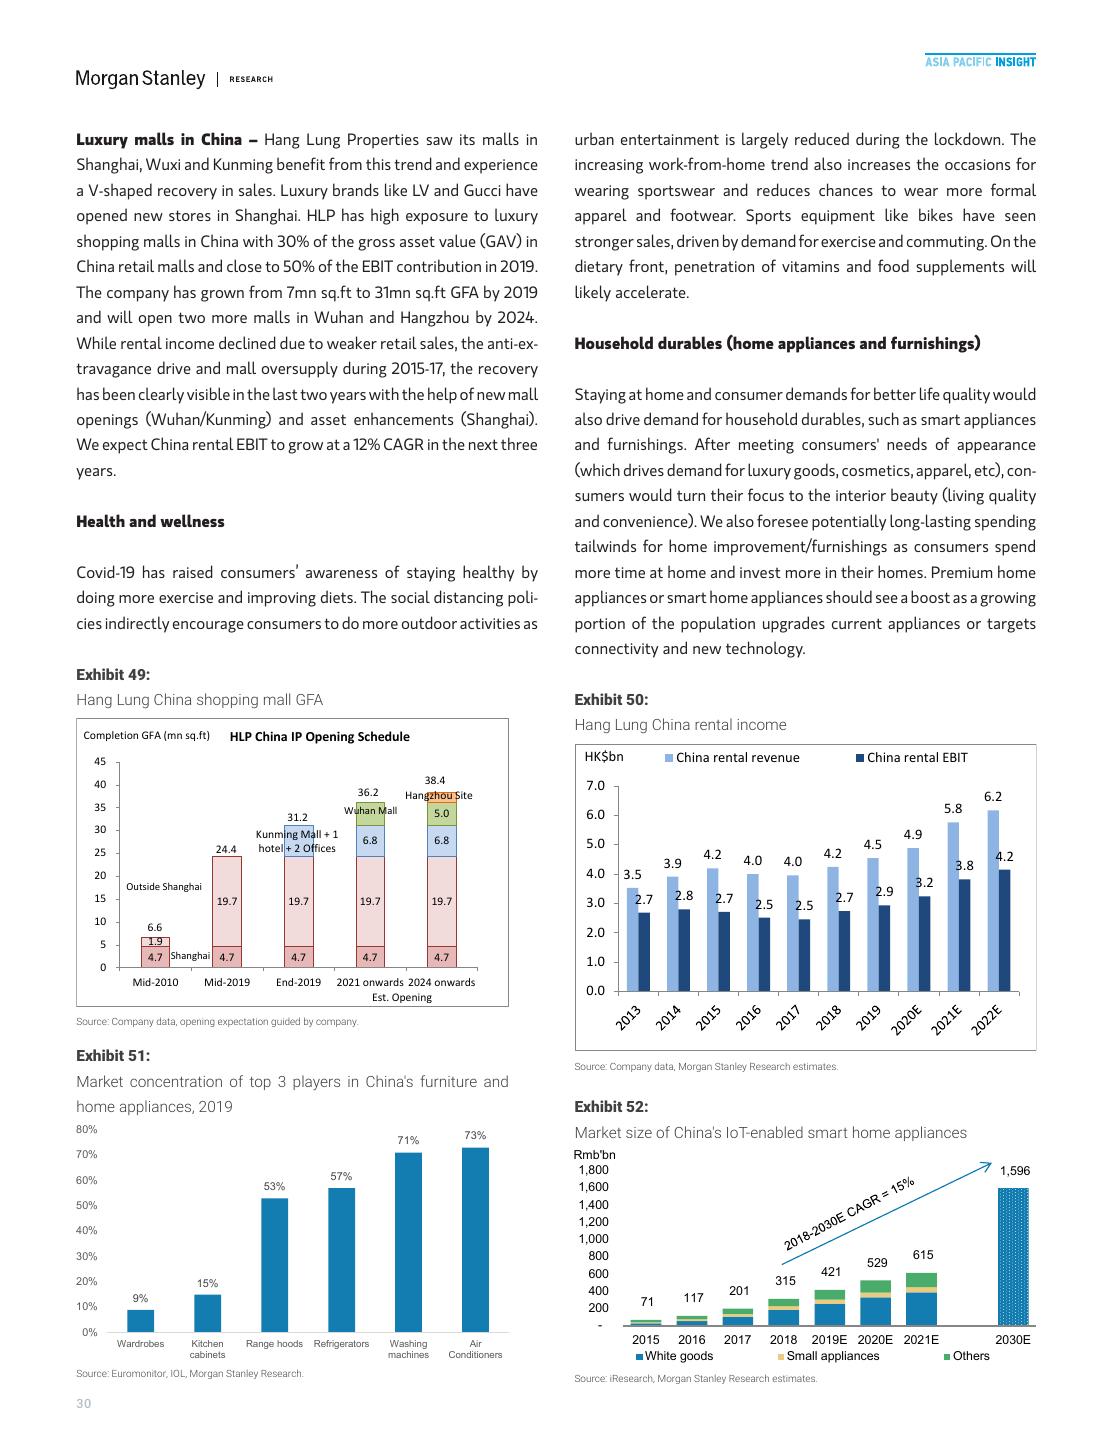
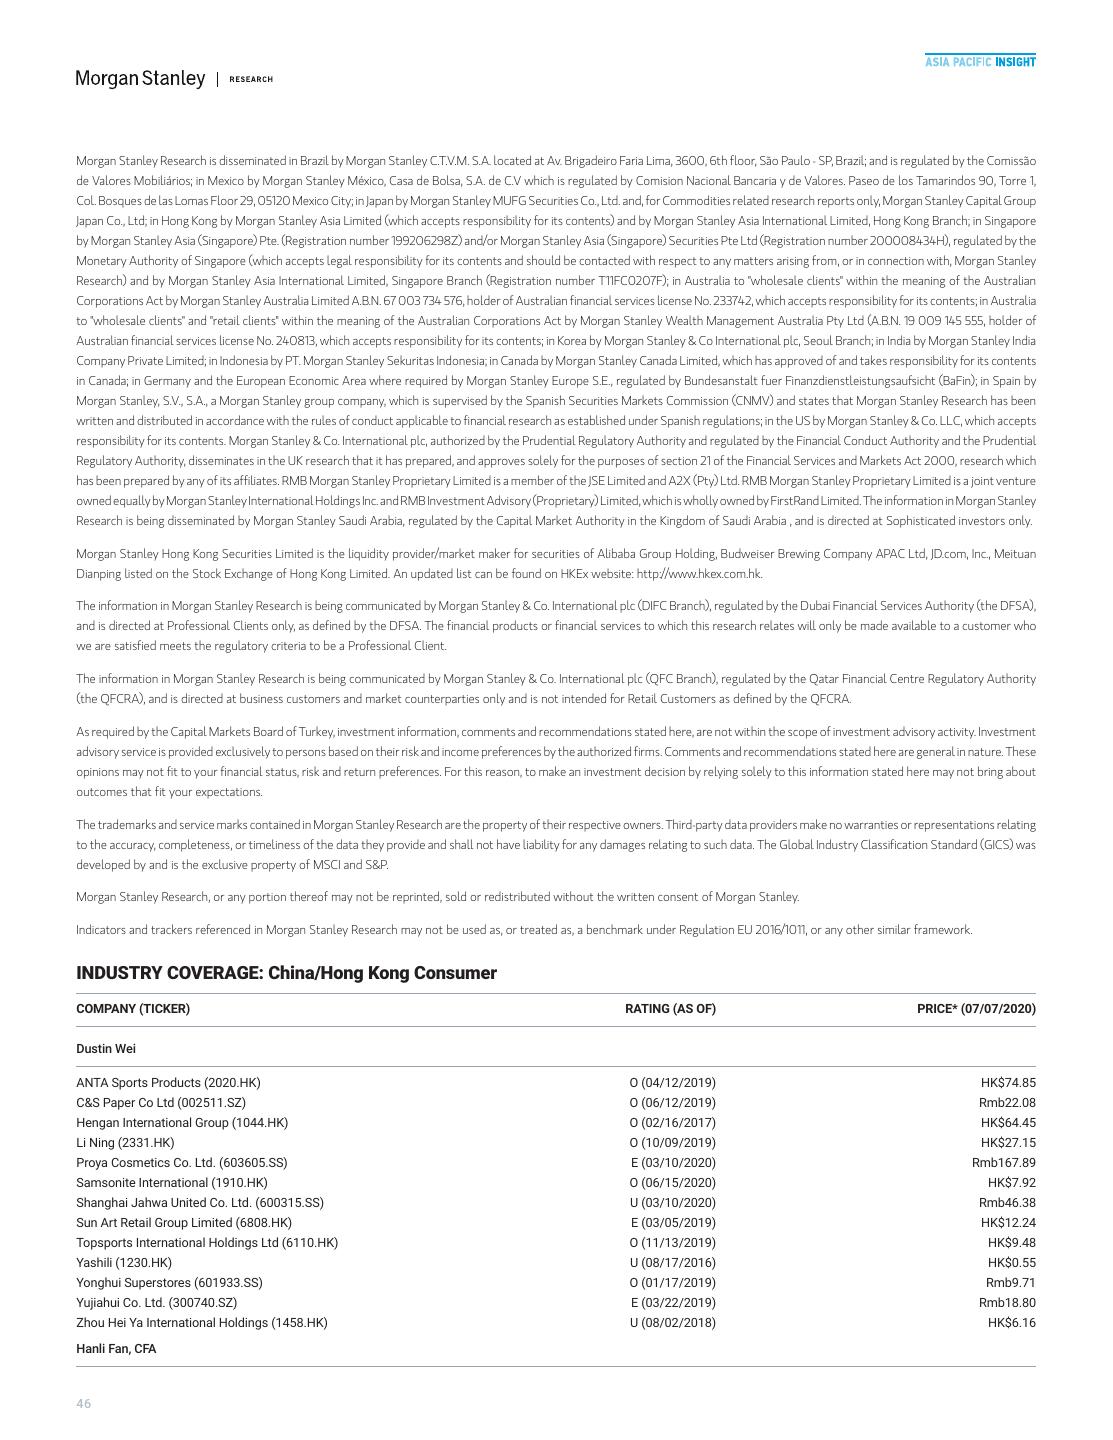
7 .MM New Trends in China Consumption Topic Details Investment Conclusions Stock Implications Duty free Consumers to purchase luxury products in the domestic market Policy relaxation supports online, Hainan, and downtown duty-free market development. CTG Duty Free instead of overseas. Favorable policies and enhanced market scale to reduce product pricing and improve (CTGDF) product variety, in return driving consumption reshoring. Luxury Sales of European luxury brands within Mainland China to grow at a Essentially neutral: While European luxury brands used to be significantly more profitable LVMH, Prada 15-20% CAGR over the next 5 years. in China, this is no longer the case. Over the past 5-10 years, brands have worked hard at harmonizing pricing globally (given price transparency due to the internet) in order to limit grey market activity. When it comes to the benefits of reshoring, we point out that Prada's current sales density in Mainland China is subpar, as the brand has about 40 stores in the region vs. 42 for Vuitton (which generates substantially higher sales). Thus Prada's profitability in Mainland China could substantially benefit from reshoring. Beauty/ Demand propelled by consumers trading-up could remain intact, given Leading beauty brands in the prestige segment with well-equipped distribution networks to LGHH, Shiseido, KOSE cosmetics increasing brand desirability and improving brand accessibility capture reshoring demand will benefit from this trend. (online). Considering the high proportion of overseas purchasing over the past years, reshoring demand could further accelerate the premi- umization trend in China's onshore market. Luxury cars China's luxury car sales are outperforming the industry thanks to con- HK-listed auto dealer groups will benefit, as they have high exposure to the luxury car seg- Zhongsheng, sumption upgrades, more affordable entry-level models, and the ment as well as resilient revenue from after-sales services. MeiDong, Yongda increasing penetration of auto finance. Luxury shop- China's luxury malls are benefiting from a V-shaped recovery in retail Luxury malls like Hang Lung's malls in Shanghai, Wuxi and Kunming have benefitted from Hang Lung Properties ping malls sales, which in turn will drive rental income. Retail sales are further this demand resurgence. With high exposure to China malls, HLP should see strong retail helped by rich consumers’ inability to travel overseas and buy luxury rental growth in 2020 and beyond. Stock pays more than 4% sustainable dividend yield. products. Most established brands (LV, Gucci, Cartier, Chanel, Dior, etc.) saw sales increase by 40-90% YoY in early June. Internet Consumers are doing more online shopping for both consumer sta- Leading e-commerce platforms with high exposure to consumer discretionary as well as PDD, JD, Alibaba, (e-com- ples (i.e. fruits) and discretionary items (i.e. consumer electronics) daily necessities with competitive pricing will benefit from reshoring. Leading local ser- Meituan merce/local due to "stay home" requirements and more consumption capability vices companies with broader user bases, city coverage and infrastructure build-up will services) from reshoring. In addition, consumers are looking for dining and lei- benefit from this thesis. sure alternatives domestically from reshoring. Demand in food delivery, in-store, hotel booking will convert to better monetization for local services platforms. Logistics Consumers to purchase luxury products in the domestic market, and We expect these two trends to benefit logistics players with a focus on high-end parcel S.F. Holding the purchase of luxury goods will shift more to online from offline. services. Better quality Reshoring will encourage consumers to seek better quality of life, and Leading consumer companies with strong brand names and premiums position will ben- ANTA, Li Ning, of life shift focus from basic needs to experience-related lifestyle and con- efit from this trend. Topsports, Shenzhou, sumption upgrading. Gree, Joyoung, Covid-19 has raised consumer awareness of staying healthy by exer- Suofeiya, Moutai, cising more and by improving diets. Wuliangye, CRB, Bud APAC, YUMC, Tingyi, and Unicharm 6
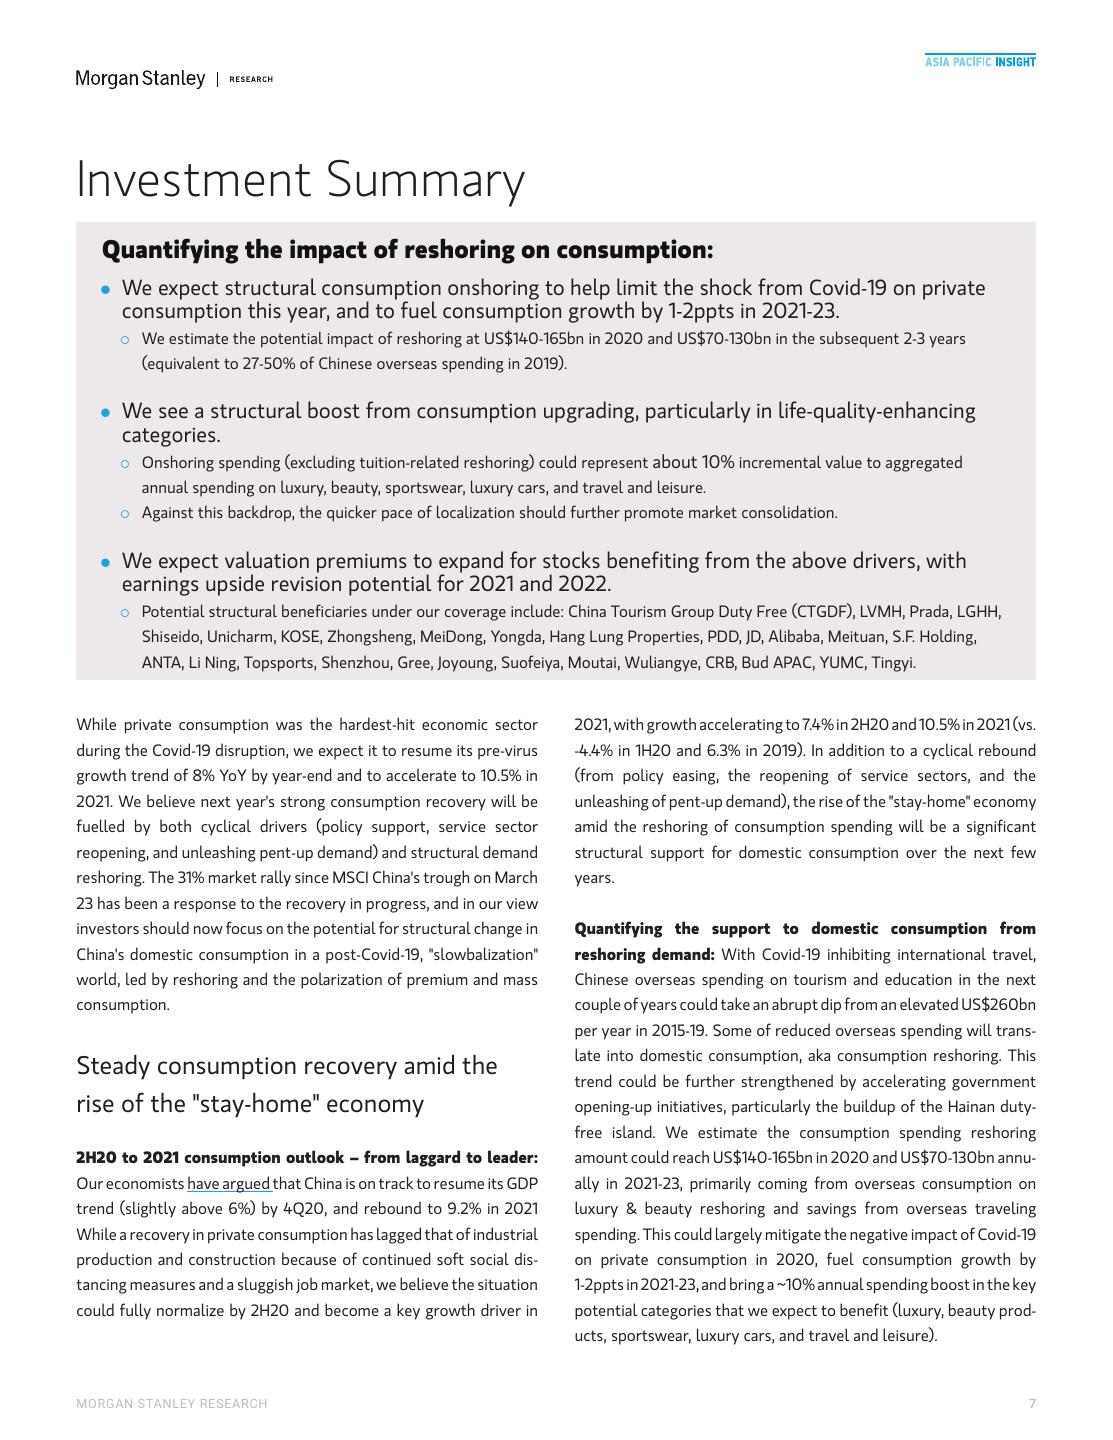
8 .M M Investment Summary Quantifying the impact of reshoring on consumption: l We expect structural consumption onshoring to help limit the shock from Covid-19 on private consumption this year, and to fuel consumption growth by 1-2ppts in 2021-23. ¡ We estimate the potential impact of reshoring at US$140-165bn in 2020 and US$70-130bn in the subsequent 2-3 years (equivalent to 27-50% of Chinese overseas spending in 2019). l We see a structural boost from consumption upgrading, particularly in life-quality-enhancing categories. ¡ Onshoring spending (excluding tuition-related reshoring) could represent about 10% incremental value to aggregated annual spending on luxury, beauty, sportswear, luxury cars, and travel and leisure. ¡ Against this backdrop, the quicker pace of localization should further promote market consolidation. l We expect valuation premiums to expand for stocks benefiting from the above drivers, with earnings upside revision potential for 2021 and 2022. ¡ Potential structural beneficiaries under our coverage include: China Tourism Group Duty Free (CTGDF), LVMH, Prada, LGHH, Shiseido, Unicharm, KOSE, Zhongsheng, MeiDong, Yongda, Hang Lung Properties, PDD, JD, Alibaba, Meituan, S.F. Holding, ANTA, Li Ning, Topsports, Shenzhou, Gree, Joyoung, Suofeiya, Moutai, Wuliangye, CRB, Bud APAC, YUMC, Tingyi. While private consumption was the hardest-hit economic sector 2021, with growth accelerating to 7.4% in 2H20 and 10.5% in 2021 (vs. during the Covid-19 disruption, we expect it to resume its pre-virus -4.4% in 1H20 and 6.3% in 2019). In addition to a cyclical rebound growth trend of 8% YoY by year-end and to accelerate to 10.5% in (from policy easing, the reopening of service sectors, and the 2021. We believe next year's strong consumption recovery will be unleashing of pent-up demand), the rise of the "stay-home" economy fuelled by both cyclical drivers (policy support, service sector amid the reshoring of consumption spending will be a significant reopening, and unleashing pent-up demand) and structural demand structural support for domestic consumption over the next few reshoring. The 31% market rally since MSCI China's trough on March years. 23 has been a response to the recovery in progress, and in our view investors should now focus on the potential for structural change in Quantifying the support to domestic consumption from China's domestic consumption in a post-Covid-19, "slowbalization" reshoring demand: With Covid-19 inhibiting international travel, world, led by reshoring and the polarization of premium and mass Chinese overseas spending on tourism and education in the next consumption. couple of years could take an abrupt dip from an elevated US$260bn per year in 2015-19. Some of reduced overseas spending will trans- late into domestic consumption, aka consumption reshoring. This Steady consumption recovery amid the trend could be further strengthened by accelerating government rise of the "stay-home" economy opening-up initiatives, particularly the buildup of the Hainan duty- free island. We estimate the consumption spending reshoring 2H20 to 2021 consumption outlook – from laggard to leader: amount could reach US$140-165bn in 2020 and US$70-130bn annu- Our economists have argued that China is on track to resume its GDP ally in 2021-23, primarily coming from overseas consumption on trend (slightly above 6%) by 4Q20, and rebound to 9.2% in 2021 luxury & beauty reshoring and savings from overseas traveling While a recovery in private consumption has lagged that of industrial spending. This could largely mitigate the negative impact of Covid-19 production and construction because of continued soft social dis- on private consumption in 2020, fuel consumption growth by tancing measures and a sluggish job market, we believe the situation 1-2ppts in 2021-23, and bring a ~10% annual spending boost in the key could fully normalize by 2H20 and become a key growth driver in potential categories that we expect to benefit (luxury, beauty prod- ucts, sportswear, luxury cars, and travel and leisure). MORGAN STANLEY RESEARCH 7
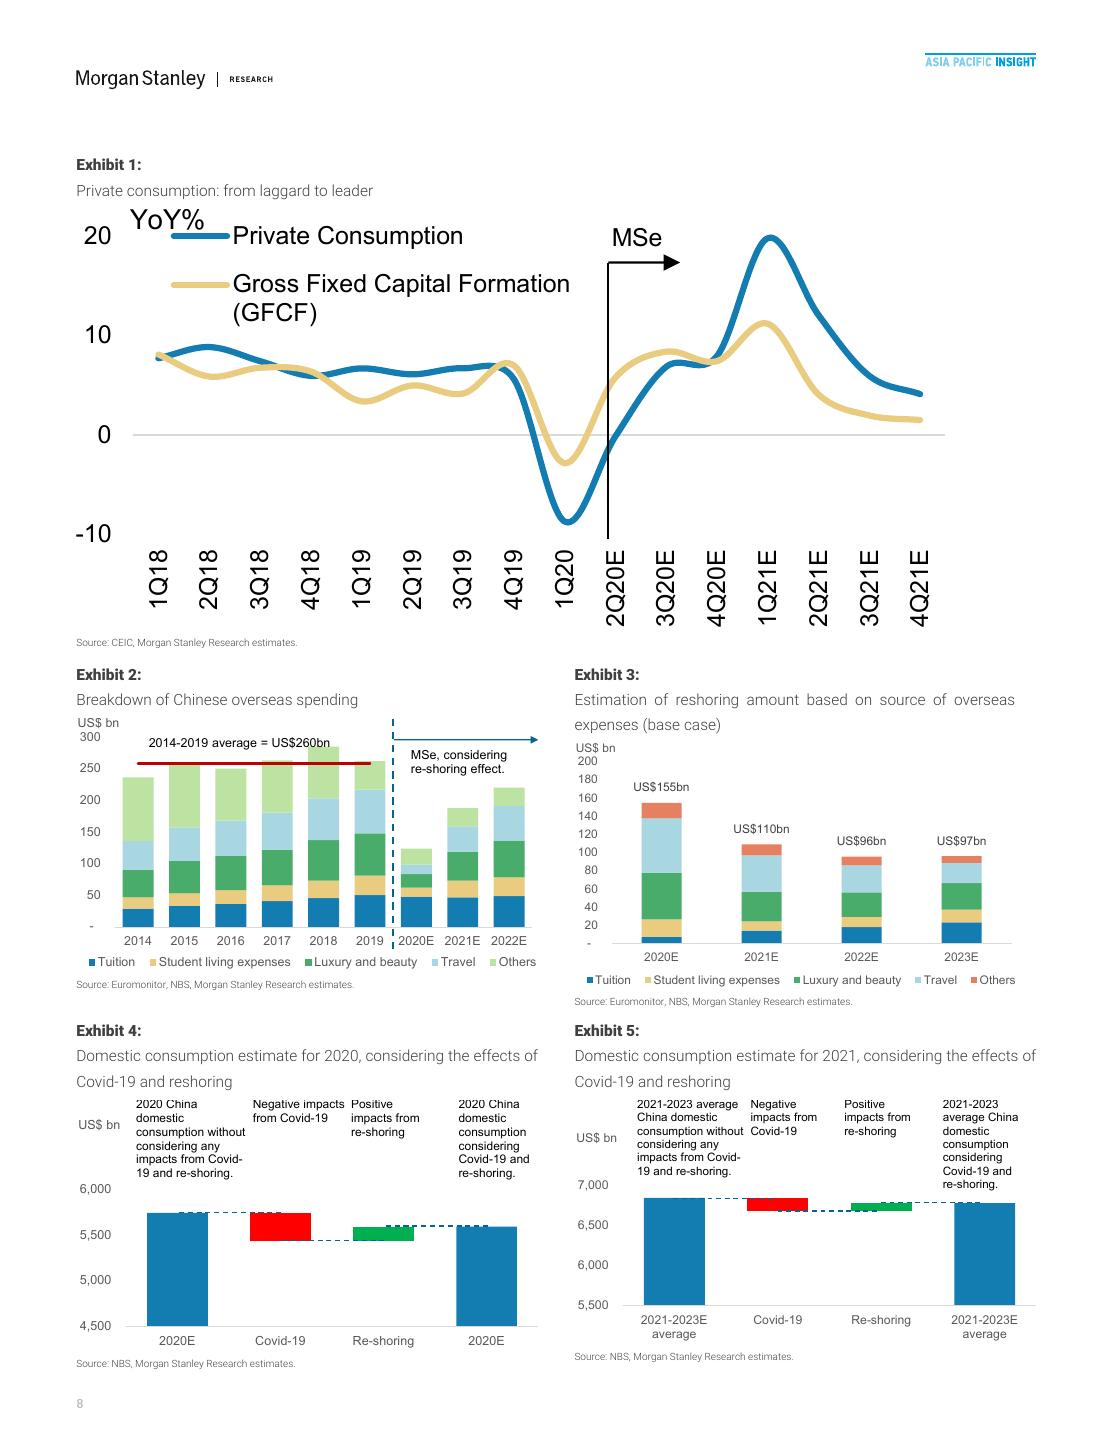
9 .M M Exhibit 1: Private consumption: from laggard to leader YoY% 20 Private Consumption MSe Gross Fixed Capital Formation (GFCF) 10 0 -10 1Q18 2Q18 3Q18 4Q18 1Q19 2Q19 3Q19 4Q19 1Q20 2Q20E 3Q20E 4Q20E 1Q21E 2Q21E 3Q21E 4Q21E Source: CEIC, Morgan Stanley Research estimates. Exhibit 2: Exhibit 3: Breakdown of Chinese overseas spending Estimation of reshoring amount based on source of overseas US$ bn expenses (base case) 300 2014-2019 average = US$260bn US$ bn MSe, considering 200 250 re-shoring effect. 180 US$155bn 200 160 140 150 120 US$110bn US$96bn US$97bn 100 100 80 60 50 40 - 20 2014 2015 2016 2017 2018 2019 2020E 2021E 2022E - Tuition Student living expenses Luxury and beauty Travel Others 2020E 2021E 2022E 2023E Source: Euromonitor, NBS, Morgan Stanley Research estimates. Tuition Student living expenses Luxury and beauty Travel Others Source: Euromonitor, NBS, Morgan Stanley Research estimates. Exhibit 4: Exhibit 5: Domestic consumption estimate for 2020, considering the effects of Domestic consumption estimate for 2021, considering the effects of Covid-19 and reshoring Covid-19 and reshoring 2020 China Negative impacts Positive 2020 China 2021-2023 average Negative Positive 2021-2023 domestic from Covid-19 impacts from domestic China domestic impacts from impacts from average China US$ bn consumption without Covid-19 re-shoring domestic consumption without re-shoring consumption US$ bn considering any considering considering any consumption impacts from Covid- Covid-19 and impacts from Covid- considering 19 and re-shoring. re-shoring. 19 and re-shoring. Covid-19 and 6,000 7,000 re-shoring. 6,500 5,500 6,000 5,000 5,500 2021-2023E Covid-19 Re-shoring 2021-2023E 4,500 average average 2020E Covid-19 Re-shoring 2020E Source: NBS, Morgan Stanley Research estimates. Source: NBS, Morgan Stanley Research estimates. 8
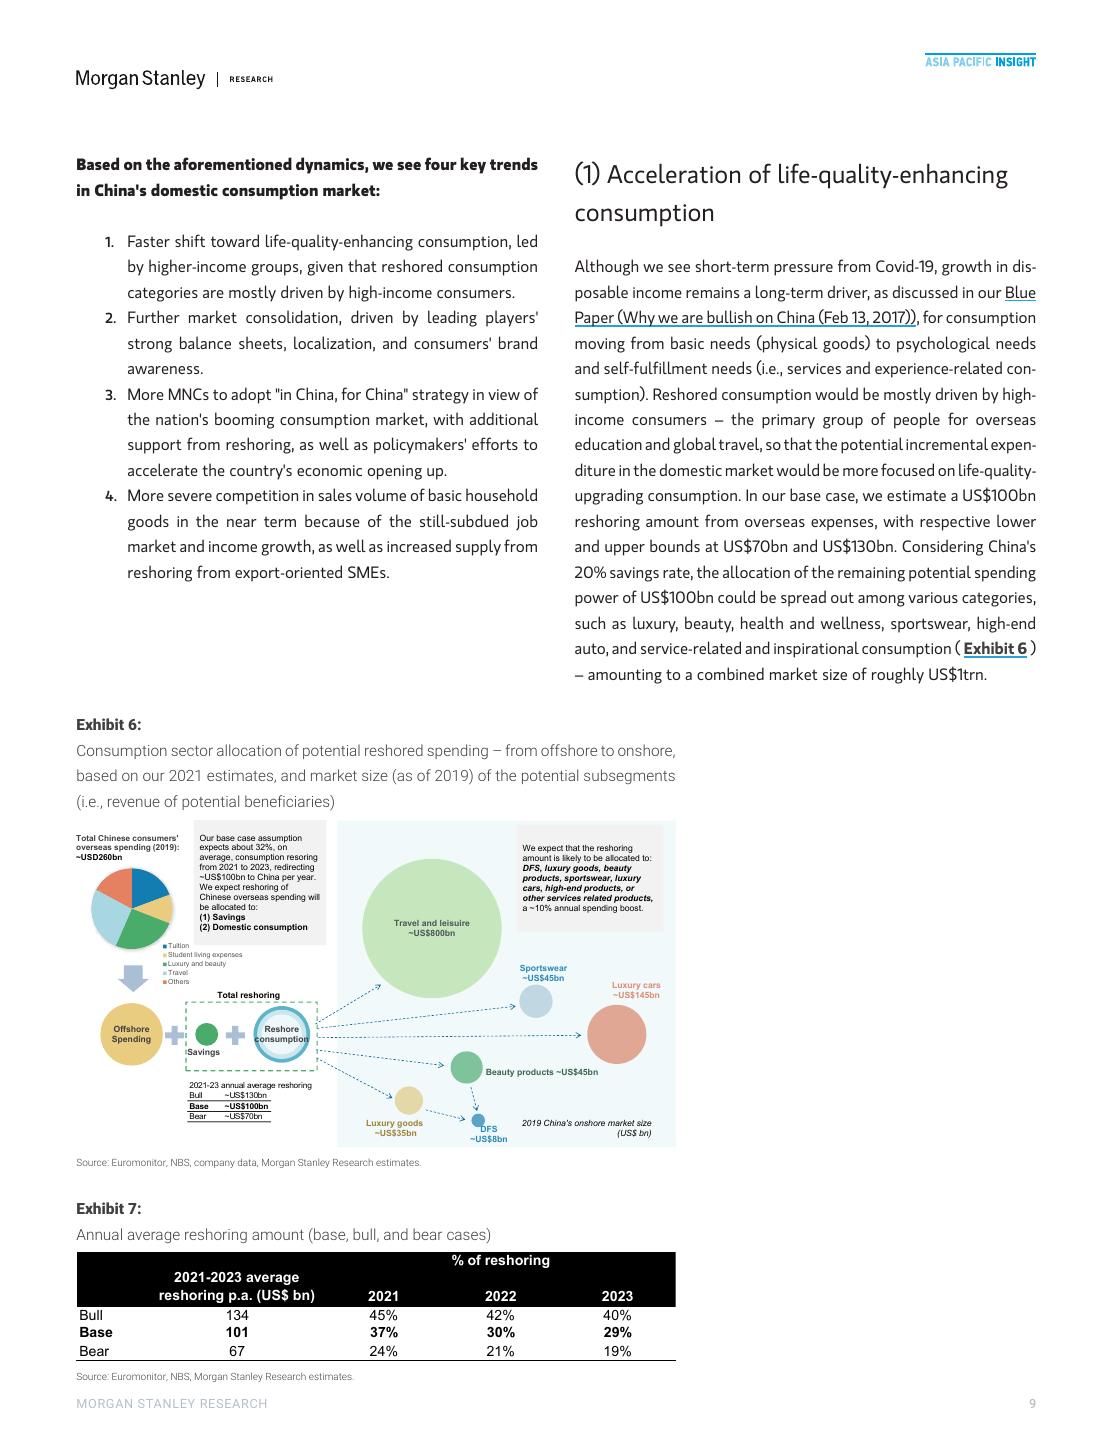
10 .M M Based on the aforementioned dynamics, we see four key trends (1) Acceleration of life-quality-enhancing in China's domestic consumption market: consumption 1. Faster shift toward life-quality-enhancing consumption, led by higher-income groups, given that reshored consumption Although we see short-term pressure from Covid-19, growth in dis- categories are mostly driven by high-income consumers. posable income remains a long-term driver, as discussed in our Blue 2. Further market consolidation, driven by leading players' Paper (Why we are bullish on China (Feb 13, 2017)), for consumption strong balance sheets, localization, and consumers' brand moving from basic needs (physical goods) to psychological needs awareness. and self-fulfillment needs (i.e., services and experience-related con- 3. More MNCs to adopt "in China, for China" strategy in view of sumption). Reshored consumption would be mostly driven by high- the nation's booming consumption market, with additional income consumers – the primary group of people for overseas support from reshoring, as well as policymakers' efforts to education and global travel, so that the potential incremental expen- accelerate the country's economic opening up. diture in the domestic market would be more focused on life-quality- 4. More severe competition in sales volume of basic household upgrading consumption. In our base case, we estimate a US$100bn goods in the near term because of the still-subdued job reshoring amount from overseas expenses, with respective lower market and income growth, as well as increased supply from and upper bounds at US$70bn and US$130bn. Considering China's reshoring from export-oriented SMEs. 20% savings rate, the allocation of the remaining potential spending power of US$100bn could be spread out among various categories, such as luxury, beauty, health and wellness, sportswear, high-end auto, and service-related and inspirational consumption ( Exhibit 6 ) – amounting to a combined market size of roughly US$1trn. Exhibit 6: Consumption sector allocation of potential reshored spending – from offshore to onshore, based on our 2021 estimates, and market size (as of 2019) of the potential subsegments (i.e., revenue of potential beneficiaries) Total Chinese consumers' Our base case assumption overseas spending (2019): expects about 32%, on We expect that the reshoring ~USD260bn average, consumption resoring amount is likely to be allocated to: from 2021 to 2023, redirecting DFS, luxury goods, beauty ~US$100bn to China per year. products, sportswear, luxury We expect reshoring of cars, high-end products, or Chinese overseas spending will other services related products, be allocated to: a ~10% annual spending boost. (1) Savings (2) Domestic consumption Travel and leisuire ~US$800bn Tuition Student living expenses Luxury and beauty Travel Sportswear Others ~US$45bn Luxury cars Total reshoring ~US$145bn Offshore Reshore Spending consumption Savings Beauty products ~US$45bn 2021-23 annual average reshoring Bull ~US$130bn Base ~US$100bn Bear ~US$70bn Luxury goods 2019 China's onshore market size ~US$35bn DFS (US$ bn) ~US$8bn Source: Euromonitor, NBS, company data, Morgan Stanley Research estimates. Exhibit 7: Annual average reshoring amount (base, bull, and bear cases) % of reshoring 2021-2023 average reshoring p.a. (US$ bn) 2021 2022 2023 Bull 134 45% 42% 40% Base 101 37% 30% 29% Bear 67 24% 21% 19% Source: Euromonitor, NBS, Morgan Stanley Research estimates. MORGAN STANLEY RESEARCH 9
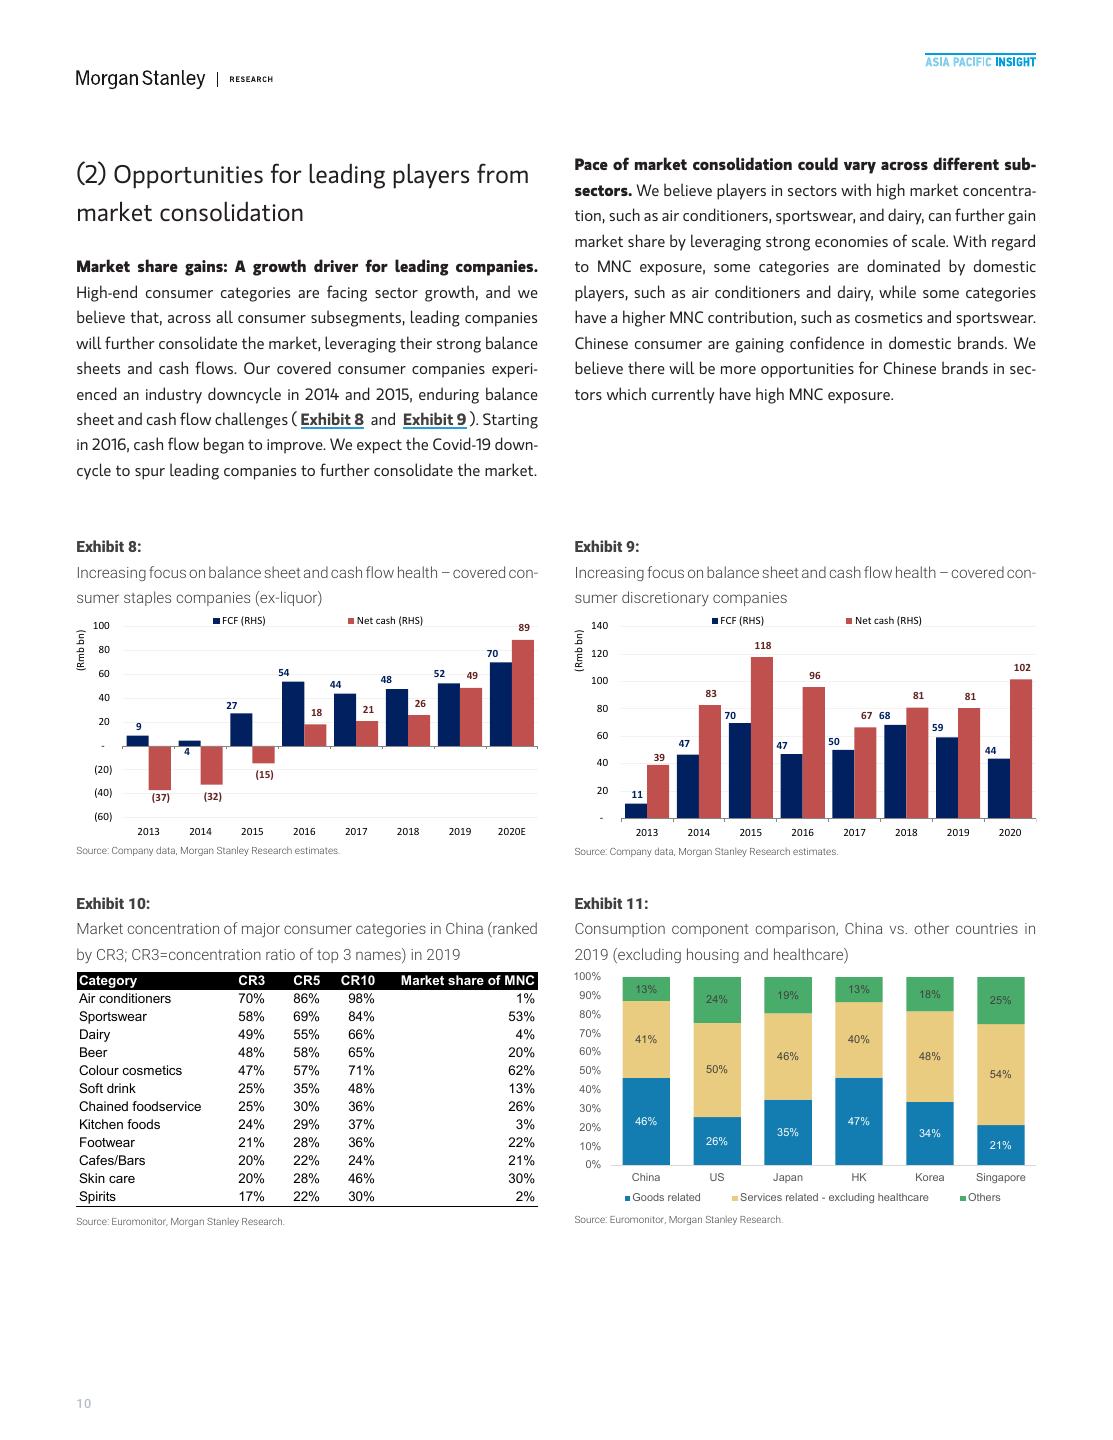
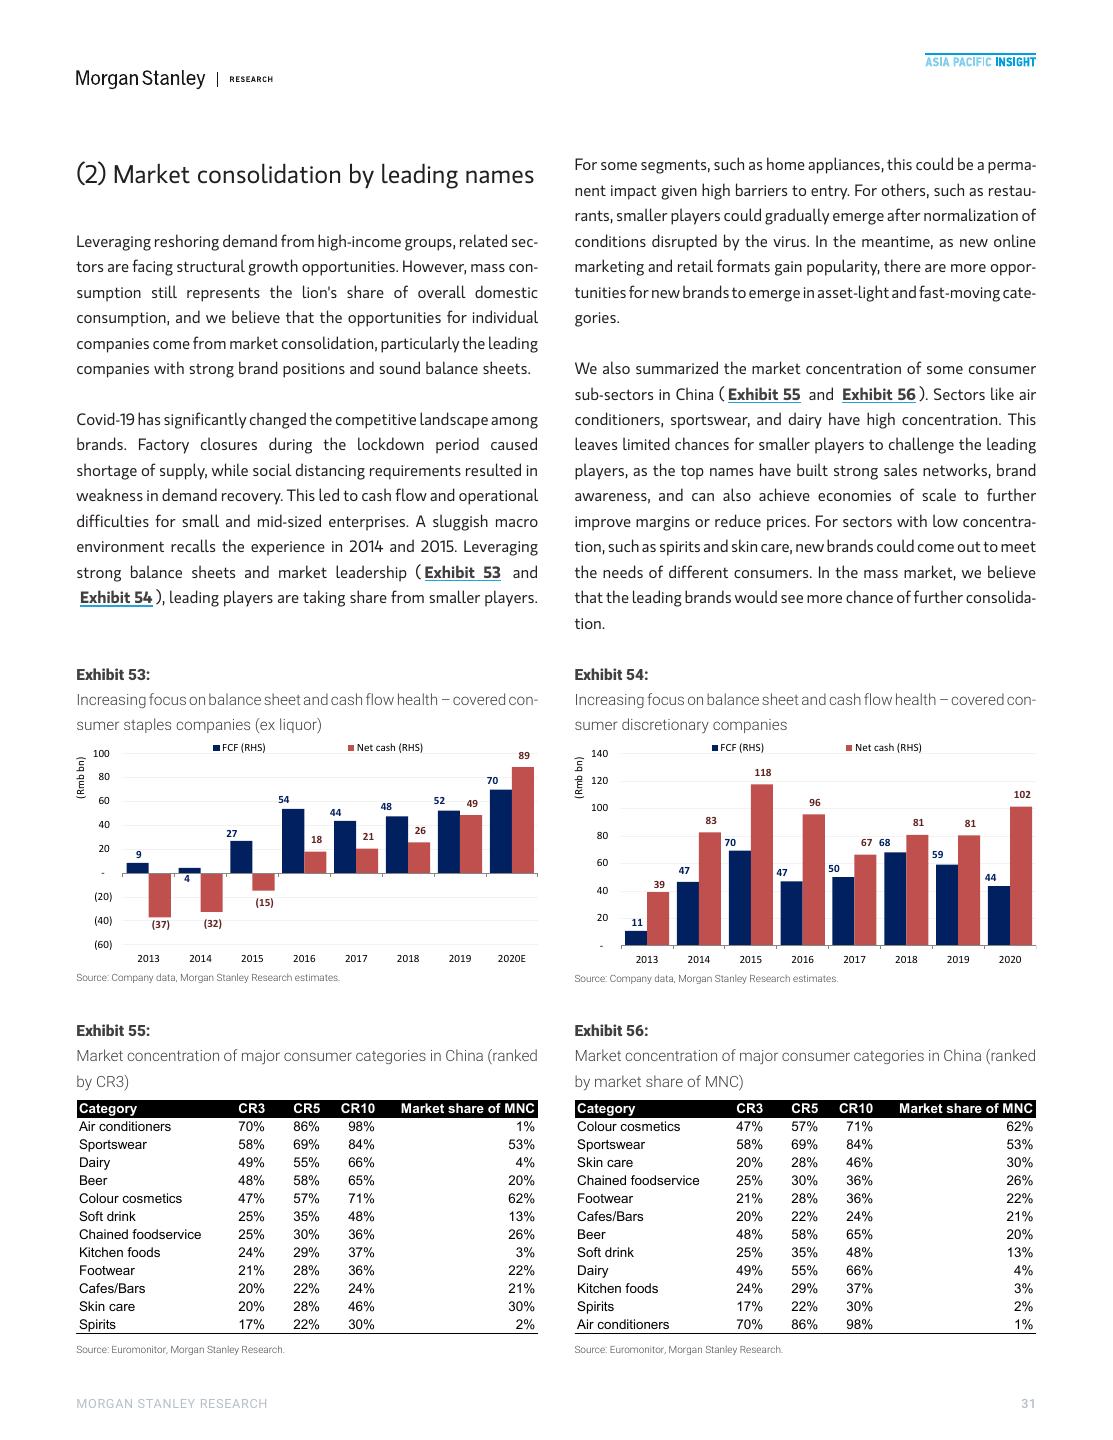
11 .M M Pace of market consolidation could vary across different sub- (2) Opportunities for leading players from sectors. We believe players in sectors with high market concentra- market consolidation tion, such as air conditioners, sportswear, and dairy, can further gain market share by leveraging strong economies of scale. With regard Market share gains: A growth driver for leading companies. to MNC exposure, some categories are dominated by domestic High-end consumer categories are facing sector growth, and we players, such as air conditioners and dairy, while some categories believe that, across all consumer subsegments, leading companies have a higher MNC contribution, such as cosmetics and sportswear. will further consolidate the market, leveraging their strong balance Chinese consumer are gaining confidence in domestic brands. We sheets and cash flows. Our covered consumer companies experi- believe there will be more opportunities for Chinese brands in sec- enced an industry downcycle in 2014 and 2015, enduring balance tors which currently have high MNC exposure. sheet and cash flow challenges ( Exhibit 8 and Exhibit 9 ). Starting in 2016, cash flow began to improve. We expect the Covid-19 down- cycle to spur leading companies to further consolidate the market. Exhibit 8: Exhibit 9: Increasing focus on balance sheet and cash flow health – covered con- Increasing focus on balance sheet and cash flow health – covered con- sumer staples companies (ex-liquor) sumer discretionary companies FCF (RHS) Net cash (RHS) FCF (RHS) Net cash (RHS) 100 89 140 (Rmb bn) (Rmb bn) 80 118 70 120 54 102 60 52 49 96 48 100 44 40 83 81 81 27 26 80 18 21 70 67 68 20 9 59 60 50 - 47 47 4 44 39 40 (20) (15) (40) 20 11 (37) (32) (60) - 2013 2014 2015 2016 2017 2018 2019 2020E 2013 2014 2015 2016 2017 2018 2019 2020 Source: Company data, Morgan Stanley Research estimates. Source: Company data, Morgan Stanley Research estimates. Exhibit 10: Exhibit 11: Market concentration of major consumer categories in China (ranked Consumption component comparison, China vs. other countries in by CR3; CR3=concentration ratio of top 3 names) in 2019 2019 (excluding housing and healthcare) Category CR3 CR5 CR10 Market share of MNC 100% 13% 13% 18% Air conditioners 70% 86% 98% 1% 90% 24% 19% 25% Sportswear 58% 69% 84% 53% 80% Dairy 49% 55% 66% 4% 70% 41% 40% Beer 48% 58% 65% 20% 60% 46% 48% Colour cosmetics 47% 57% 71% 62% 50% 50% 54% Soft drink 25% 35% 48% 13% 40% Chained foodservice 25% 30% 36% 26% 30% Kitchen foods 24% 29% 37% 3% 46% 47% 20% 35% 34% Footwear 21% 28% 36% 22% 10% 26% 21% Cafes/Bars 20% 22% 24% 21% 0% Skin care 20% 28% 46% 30% China US Japan HK Korea Singapore Spirits 17% 22% 30% 2% Goods related Services related - excluding healthcare Others Source: Euromonitor, Morgan Stanley Research. Source: Euromonitor, Morgan Stanley Research. 10
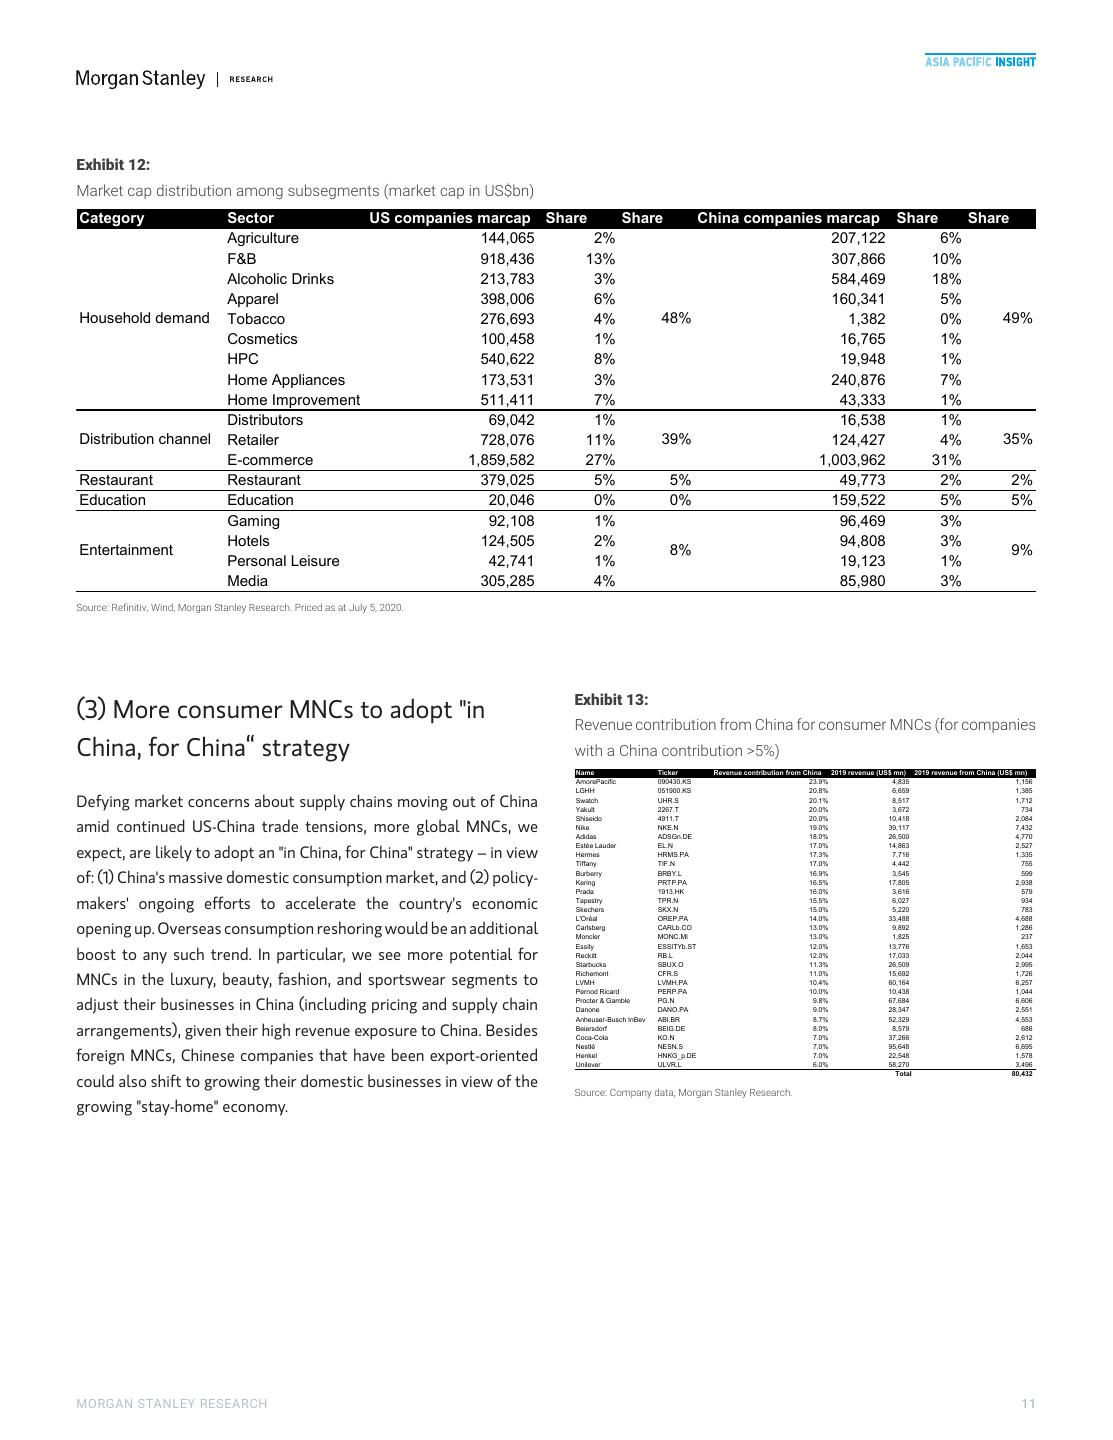
12 .M M Exhibit 12: Market cap distribution among subsegments (market cap in US$bn) Category Sector US companies marcap Share Share China companies marcap Share Share Agriculture 144,065 2% 207,122 6% F&B 918,436 13% 307,866 10% Alcoholic Drinks 213,783 3% 584,469 18% Apparel 398,006 6% 160,341 5% Household demand Tobacco 276,693 4% 48% 1,382 0% 49% Cosmetics 100,458 1% 16,765 1% HPC 540,622 8% 19,948 1% Home Appliances 173,531 3% 240,876 7% Home Improvement 511,411 7% 43,333 1% Distributors 69,042 1% 16,538 1% Distribution channel Retailer 728,076 11% 39% 124,427 4% 35% E-commerce 1,859,582 27% 1,003,962 31% Restaurant Restaurant 379,025 5% 5% 49,773 2% 2% Education Education 20,046 0% 0% 159,522 5% 5% Gaming 92,108 1% 96,469 3% Hotels 124,505 2% 94,808 3% Entertainment 8% 9% Personal Leisure 42,741 1% 19,123 1% Media 305,285 4% 85,980 3% Source: Refinitiv, Wind, Morgan Stanley Research. Priced as at July 5, 2020. Exhibit 13: (3) More consumer MNCs to adopt "in Revenue contribution from China for consumer MNCs (for companies China, for China“ strategy with a China contribution >5%) Name Ticker Revenue contribution from China 2019 revenue (US$ mn) 2019 revenue from China (US$ mn) AmorePacific 090430.KS 23.9% 4,835 1,156 LGHH 051900.KS 20.8% 6,659 1,385 Defying market concerns about supply chains moving out of China Swatch Yakult UHR.S 2267.T 20.1% 20.0% 8,517 3,672 1,712 734 Shiseido 4911.T 20.0% 10,418 2,084 amid continued US-China trade tensions, more global MNCs, we Nike Adidas NKE.N ADSGn.DE 19.0% 18.0% 39,117 26,500 7,432 4,770 Estée Lauder EL.N 17.0% 14,863 2,527 expect, are likely to adopt an "in China, for China" strategy – in view Hermes HRMS.PA 17.3% 7,716 1,335 Tiffany TIF.N 17.0% 4,442 755 Burberry BRBY.L 16.9% 3,545 599 of: (1) China's massive domestic consumption market, and (2) policy- Kering PRTP.PA 16.5% 17,805 2,938 Prada 1913.HK 16.0% 3,616 579 makers' ongoing efforts to accelerate the country's economic Tapestry Skechers TPR.N SKX.N 15.5% 15.0% 6,027 5,220 934 783 L'Oréal OREP.PA 14.0% 33,488 4,688 opening up. Overseas consumption reshoring would be an additional Carlsberg Moncler CARLb.CO MONC.MI 13.0% 13.0% 9,892 1,825 1,286 237 Essity ESSITYb.ST 12.0% 13,776 1,653 boost to any such trend. In particular, we see more potential for Reckitt Starbucks RB.L SBUX.O 12.0% 11.3% 17,033 26,509 2,044 2,995 Richemont CFR.S 11.0% 15,692 1,726 MNCs in the luxury, beauty, fashion, and sportswear segments to LVMH LVMH.PA 10.4% 60,164 6,257 Pernod Ricard PERP.PA 10.0% 10,438 1,044 adjust their businesses in China (including pricing and supply chain Procter & Gamble Danone PG.N DANO.PA 9.8% 9.0% 67,684 28,347 6,606 2,551 Anheuser-Busch InBev ABI.BR 8.7% 52,329 4,553 arrangements), given their high revenue exposure to China. Besides Beiersdorf Coca-Cola BEIG.DE KO.N 8.0% 7.0% 8,579 37,266 686 2,612 Nestlé NESN.S 7.0% 95,648 6,695 foreign MNCs, Chinese companies that have been export-oriented Henkel Unilever HNKG_p.DE ULVR.L 7.0% 6.0% 22,548 58,270 1,578 3,496 Total 80,432 could also shift to growing their domestic businesses in view of the Source: Company data, Morgan Stanley Research. growing "stay-home" economy. MORGAN STANLEY RESEARCH 11
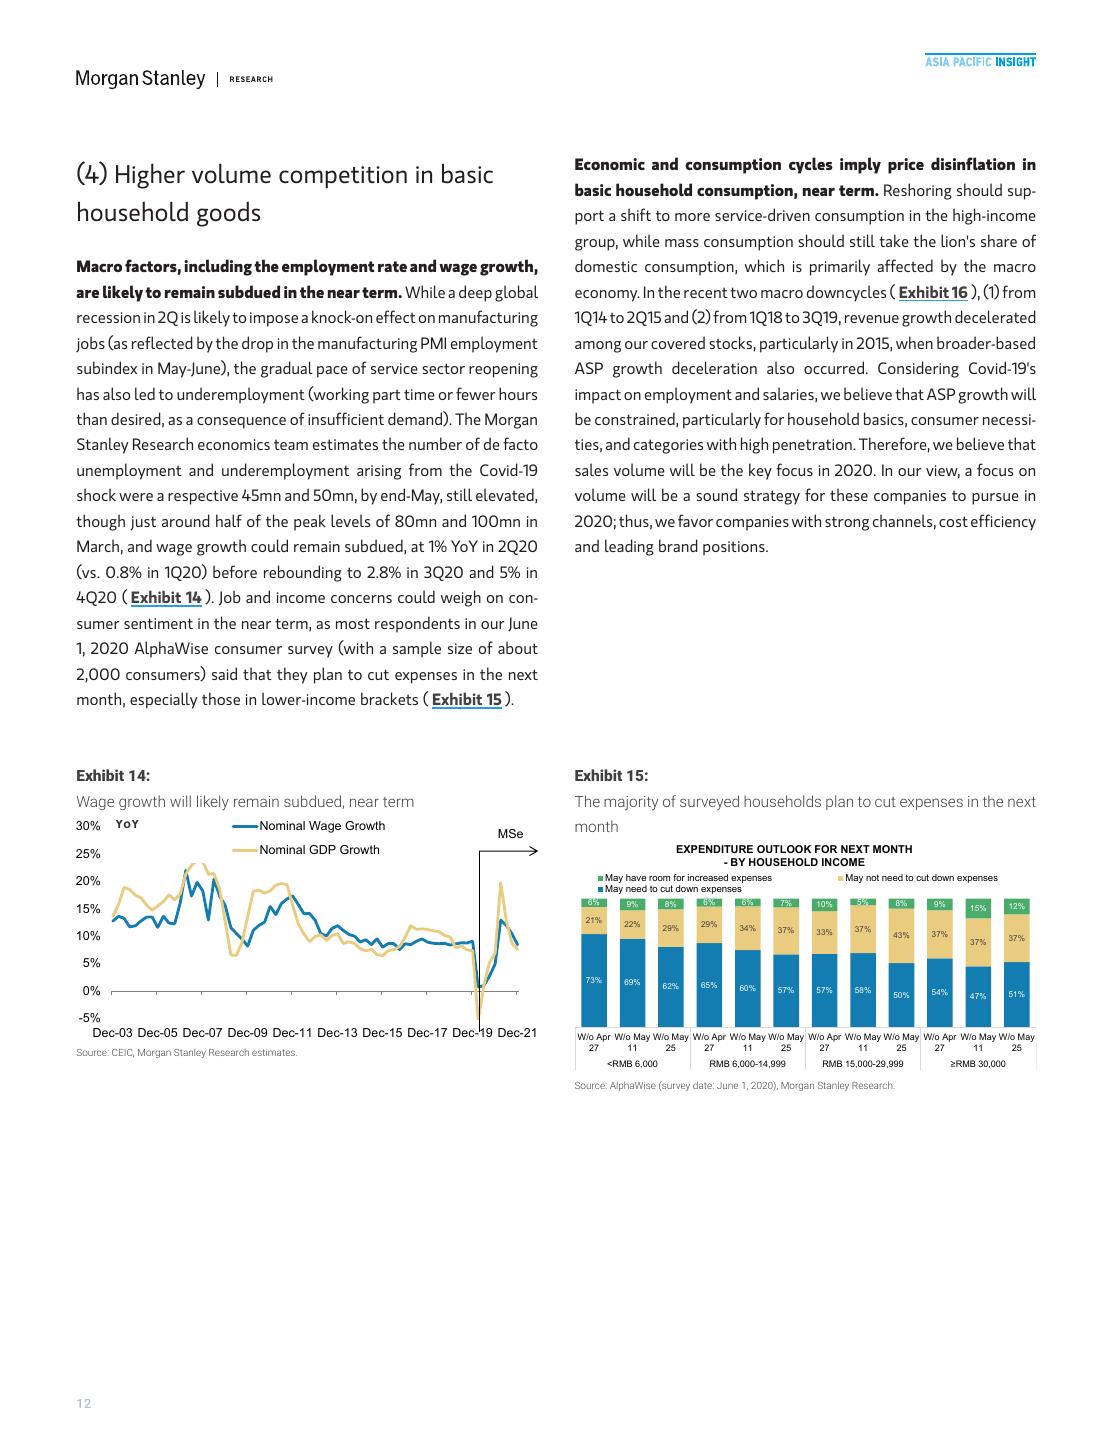
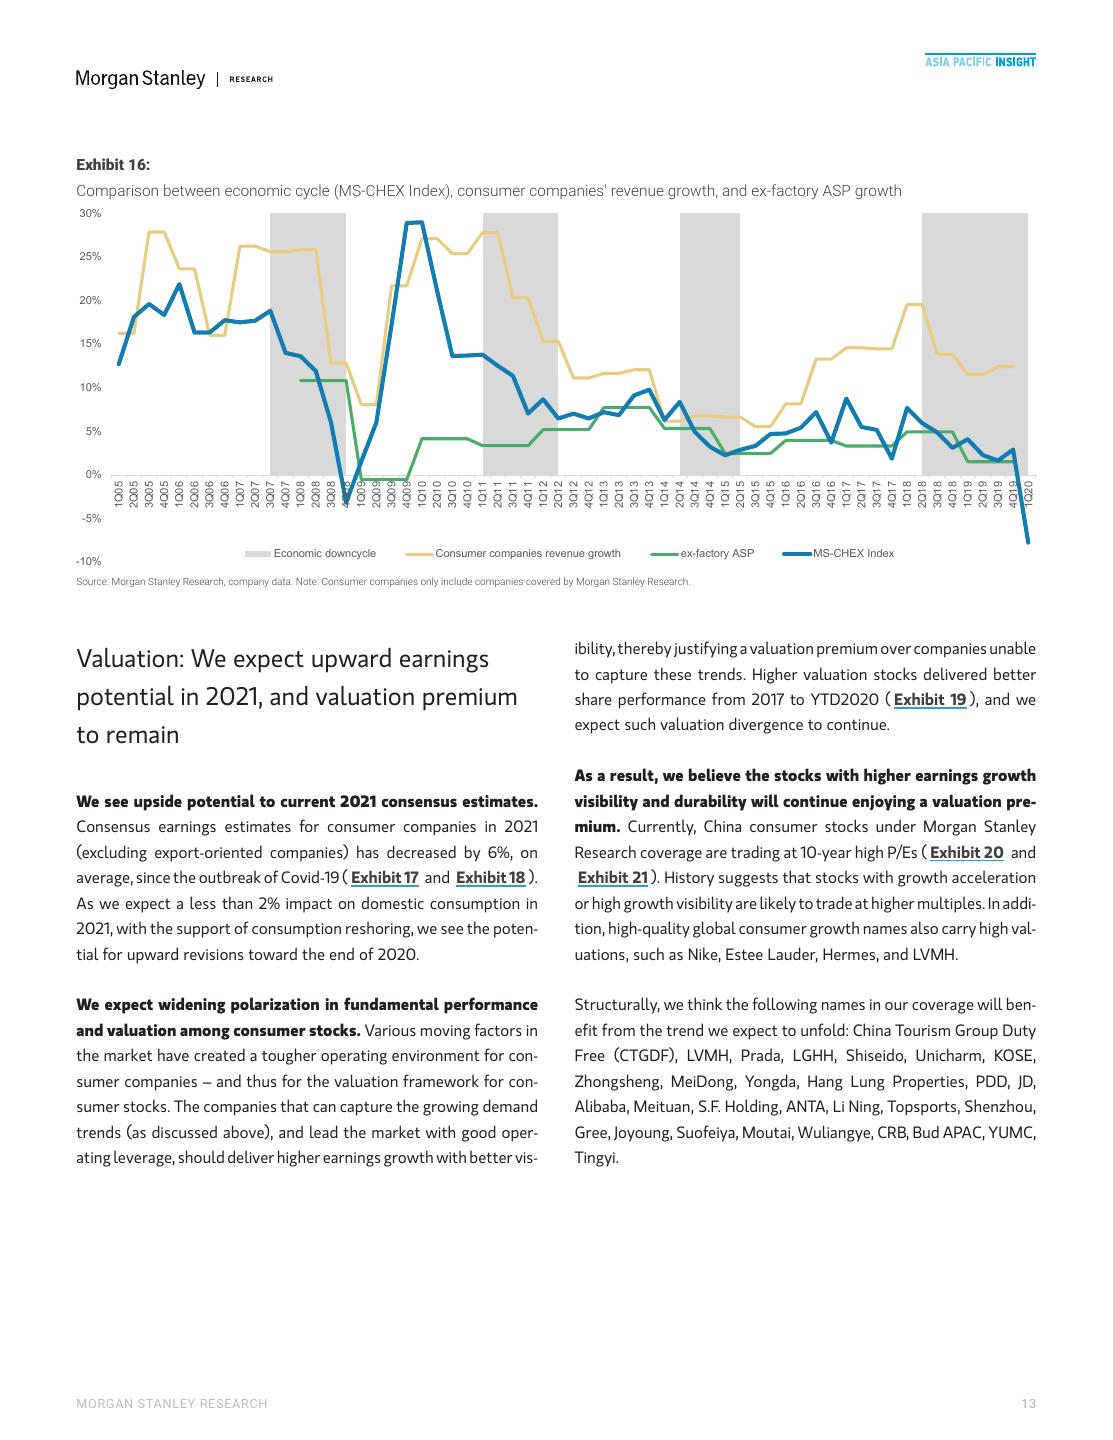
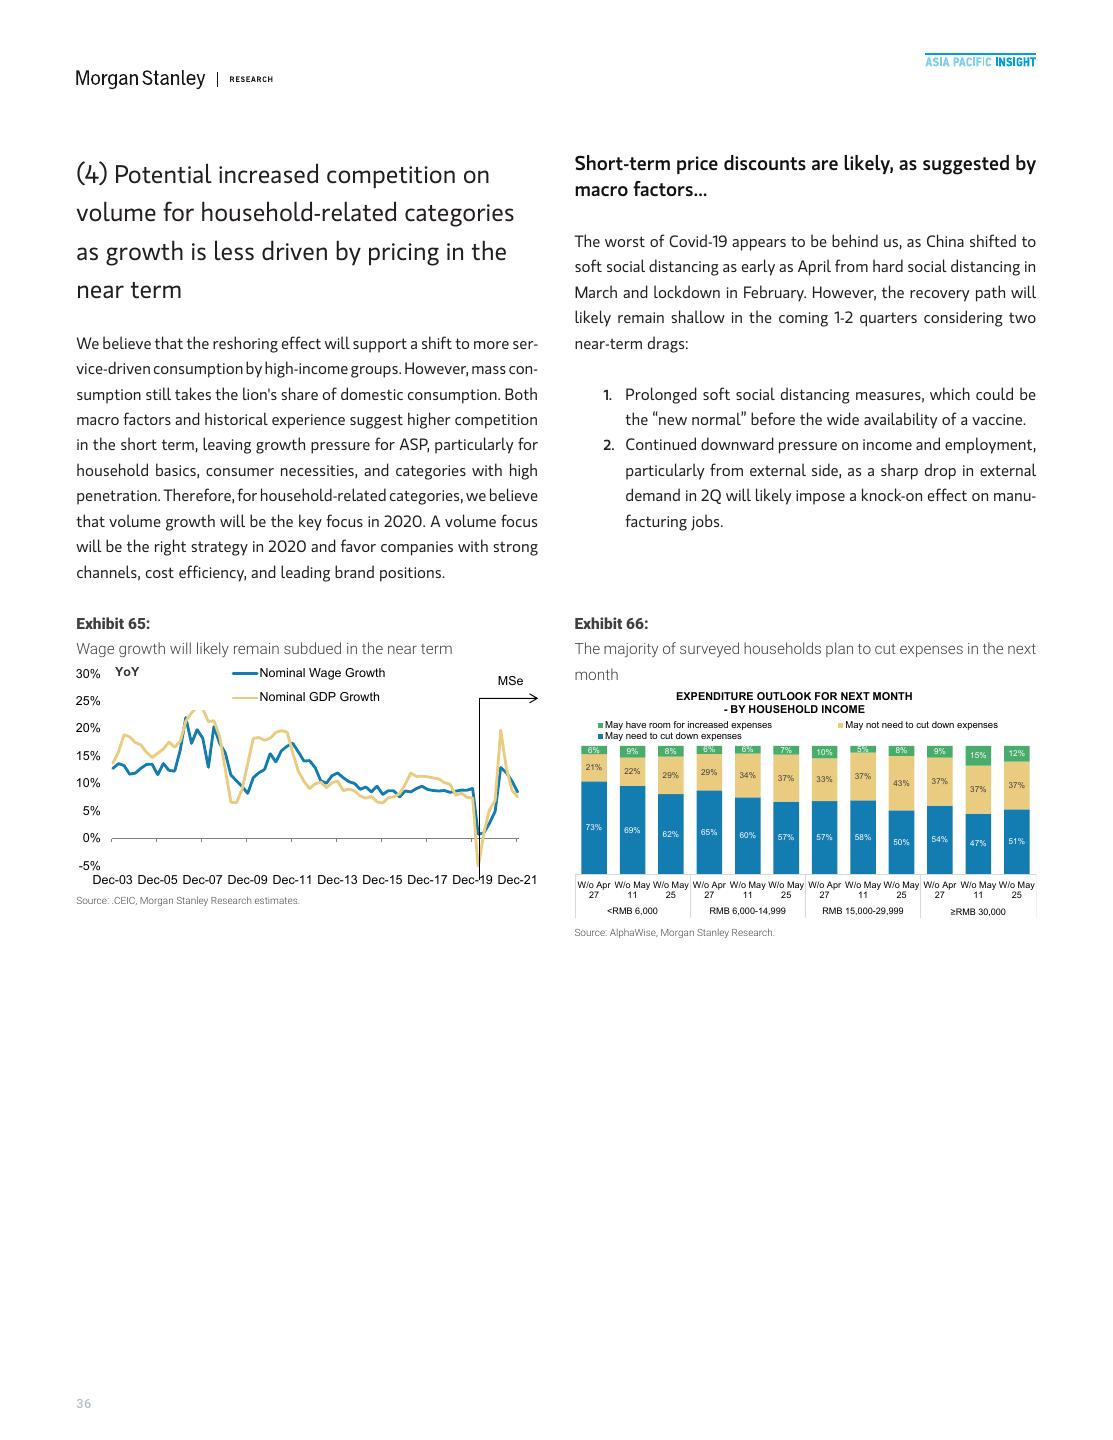
13 .M M Economic and consumption cycles imply price disinflation in (4) Higher volume competition in basic basic household consumption, near term. Reshoring should sup- household goods port a shift to more service-driven consumption in the high-income group, while mass consumption should still take the lion's share of Macro factors, including the employment rate and wage growth, domestic consumption, which is primarily affected by the macro are likely to remain subdued in the near term. While a deep global economy. In the recent two macro downcycles ( Exhibit 16 ), (1) from recession in 2Q is likely to impose a knock-on effect on manufacturing 1Q14 to 2Q15 and (2) from 1Q18 to 3Q19, revenue growth decelerated jobs (as reflected by the drop in the manufacturing PMI employment among our covered stocks, particularly in 2015, when broader-based subindex in May-June), the gradual pace of service sector reopening ASP growth deceleration also occurred. Considering Covid-19's has also led to underemployment (working part time or fewer hours impact on employment and salaries, we believe that ASP growth will than desired, as a consequence of insufficient demand). The Morgan be constrained, particularly for household basics, consumer necessi- Stanley Research economics team estimates the number of de facto ties, and categories with high penetration. Therefore, we believe that unemployment and underemployment arising from the Covid-19 sales volume will be the key focus in 2020. In our view, a focus on shock were a respective 45mn and 50mn, by end-May, still elevated, volume will be a sound strategy for these companies to pursue in though just around half of the peak levels of 80mn and 100mn in 2020; thus, we favor companies with strong channels, cost efficiency March, and wage growth could remain subdued, at 1% YoY in 2Q20 and leading brand positions. (vs. 0.8% in 1Q20) before rebounding to 2.8% in 3Q20 and 5% in 4Q20 ( Exhibit 14 ). Job and income concerns could weigh on con- sumer sentiment in the near term, as most respondents in our June 1, 2020 AlphaWise consumer survey (with a sample size of about 2,000 consumers) said that they plan to cut expenses in the next month, especially those in lower-income brackets ( Exhibit 15 ). Exhibit 14: Exhibit 15: Wage growth will likely remain subdued, near term The majority of surveyed households plan to cut expenses in the next 30% YoY Nominal Wage Growth month MSe 25% Nominal GDP Growth EXPENDITURE OUTLOOK FOR NEXT MONTH - BY HOUSEHOLD INCOME 20% May have room for increased expenses May not need to cut down expenses May need to cut down expenses 6% 9% 8% 6% 6% 7% 10% 5% 8% 9% 15% 15% 12% 21% 22% 29% 29% 34% 37% 33% 37% 10% 43% 37% 37% 37% 5% 73% 69% 62% 65% 60% 0% 57% 57% 58% 50% 54% 47% 51% -5% Dec-03 Dec-05 Dec-07 Dec-09 Dec-11 Dec-13 Dec-15 Dec-17 Dec-19 Dec-21 W/o Apr W/o May W/o May W/o Apr W/o May W/o May W/o Apr W/o May W/o May W/o Apr W/o May W/o May 27 11 25 27 11 25 27 11 25 27 11 25 Source: CEIC, Morgan Stanley Research estimates. <RMB 6,000 RMB 6,000-14,999 RMB 15,000-29,999 ≥RMB 30,000 Source: AlphaWise (survey date: June 1, 2020), Morgan Stanley Research. 12
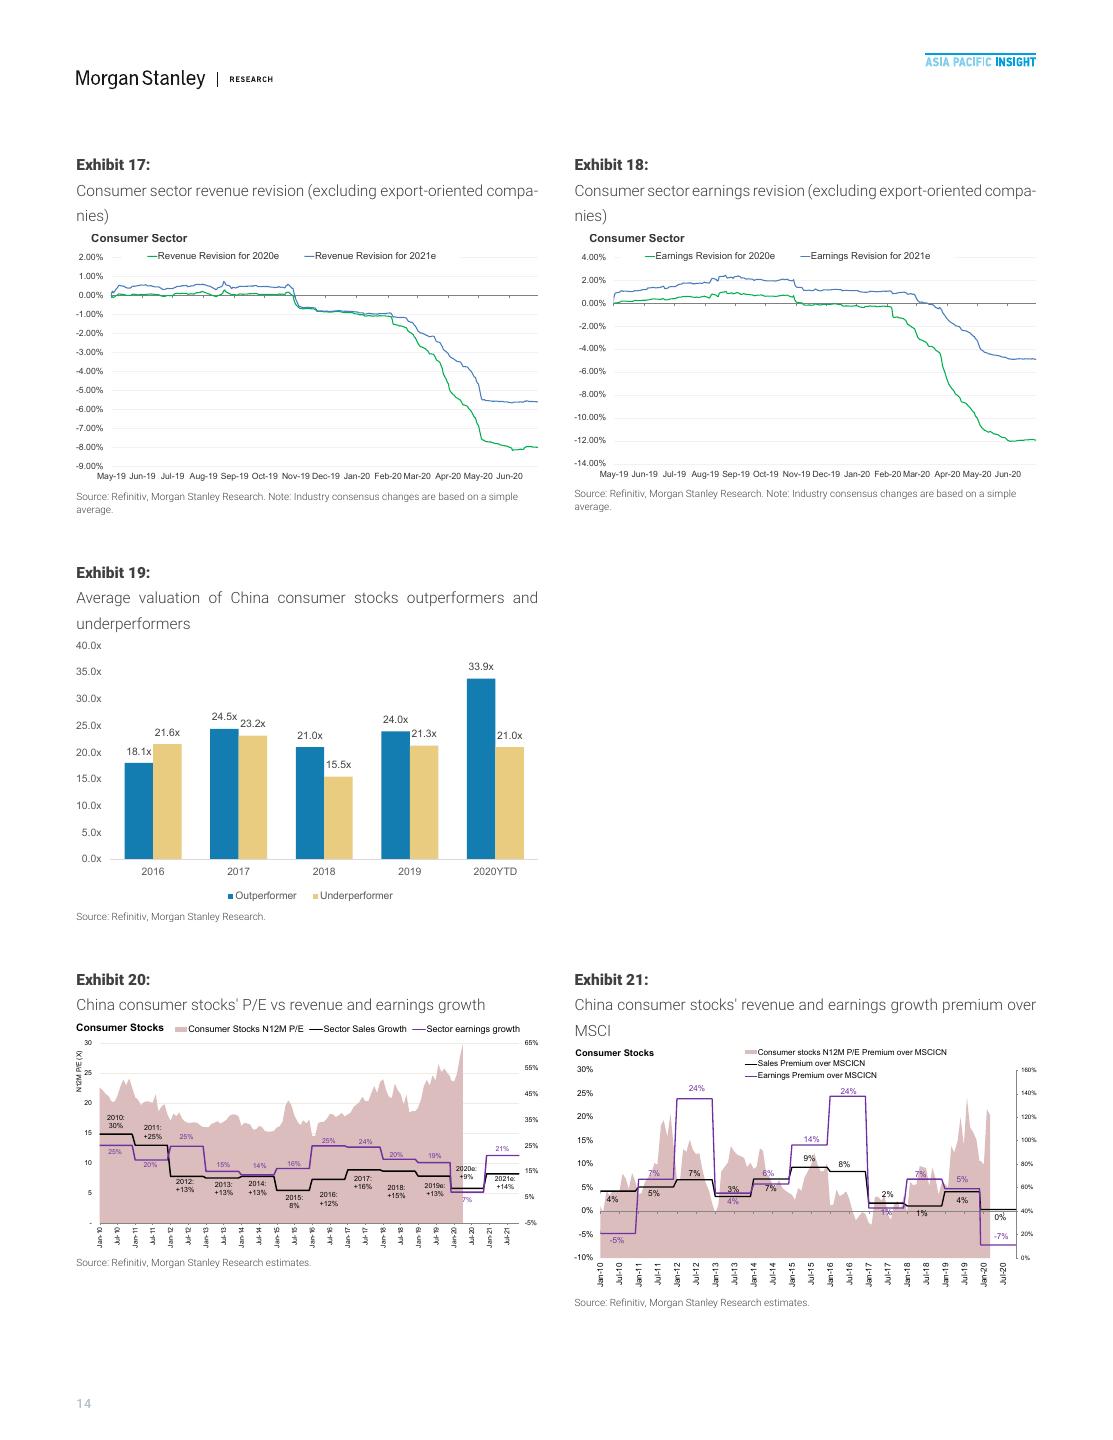
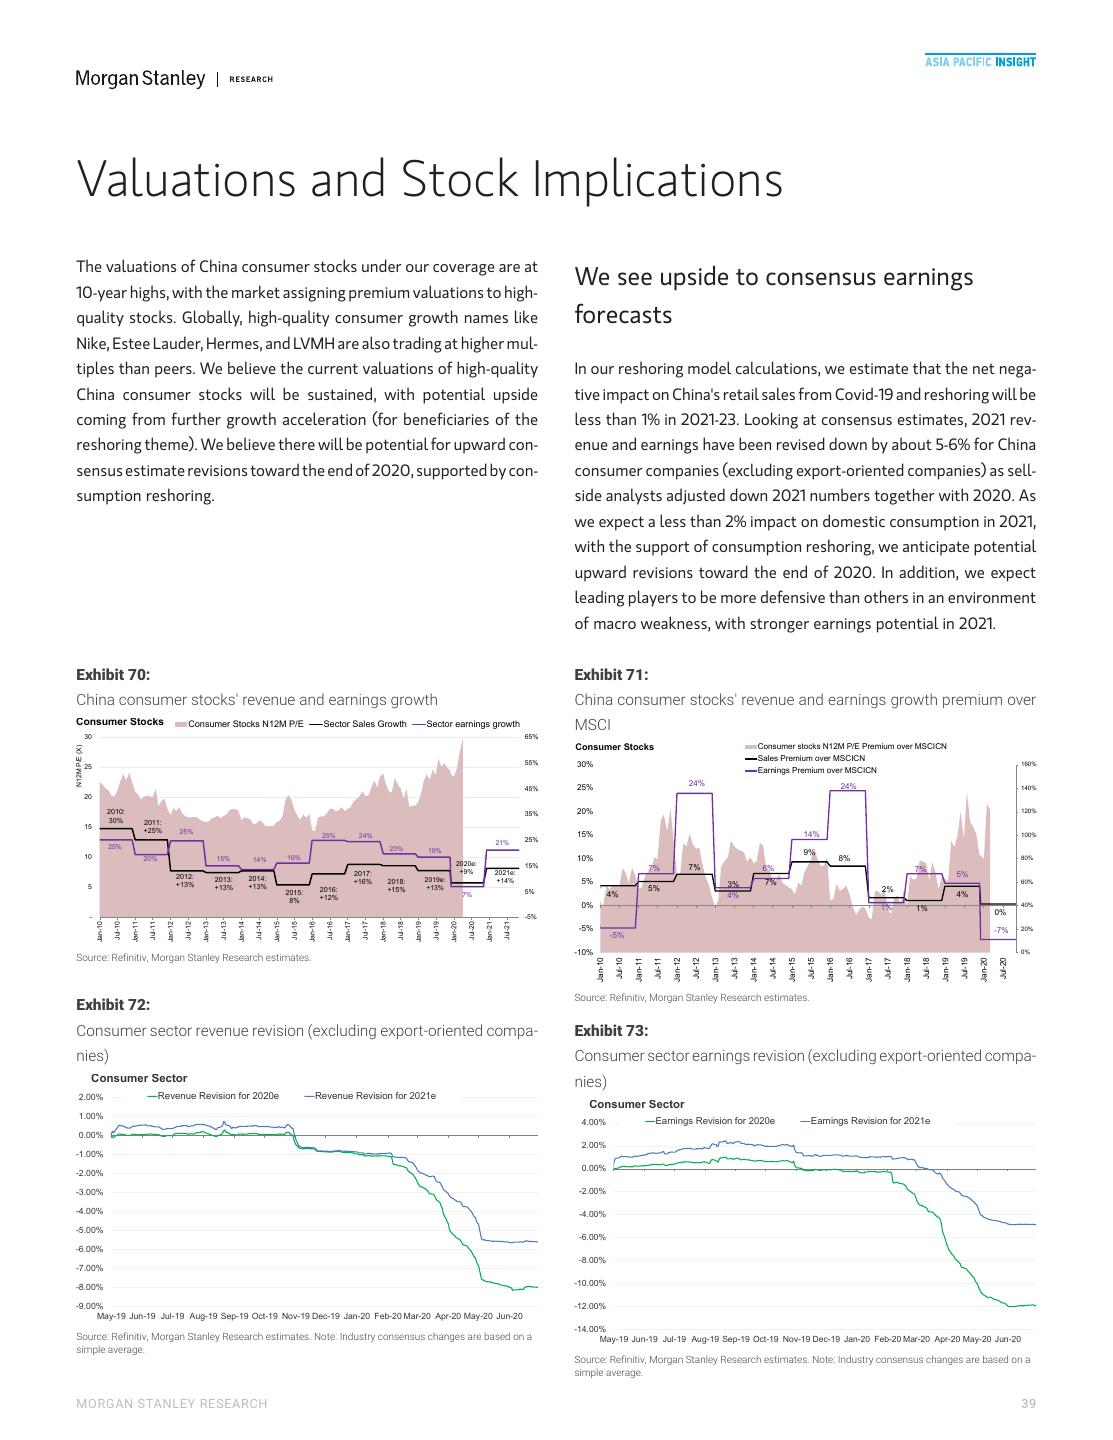
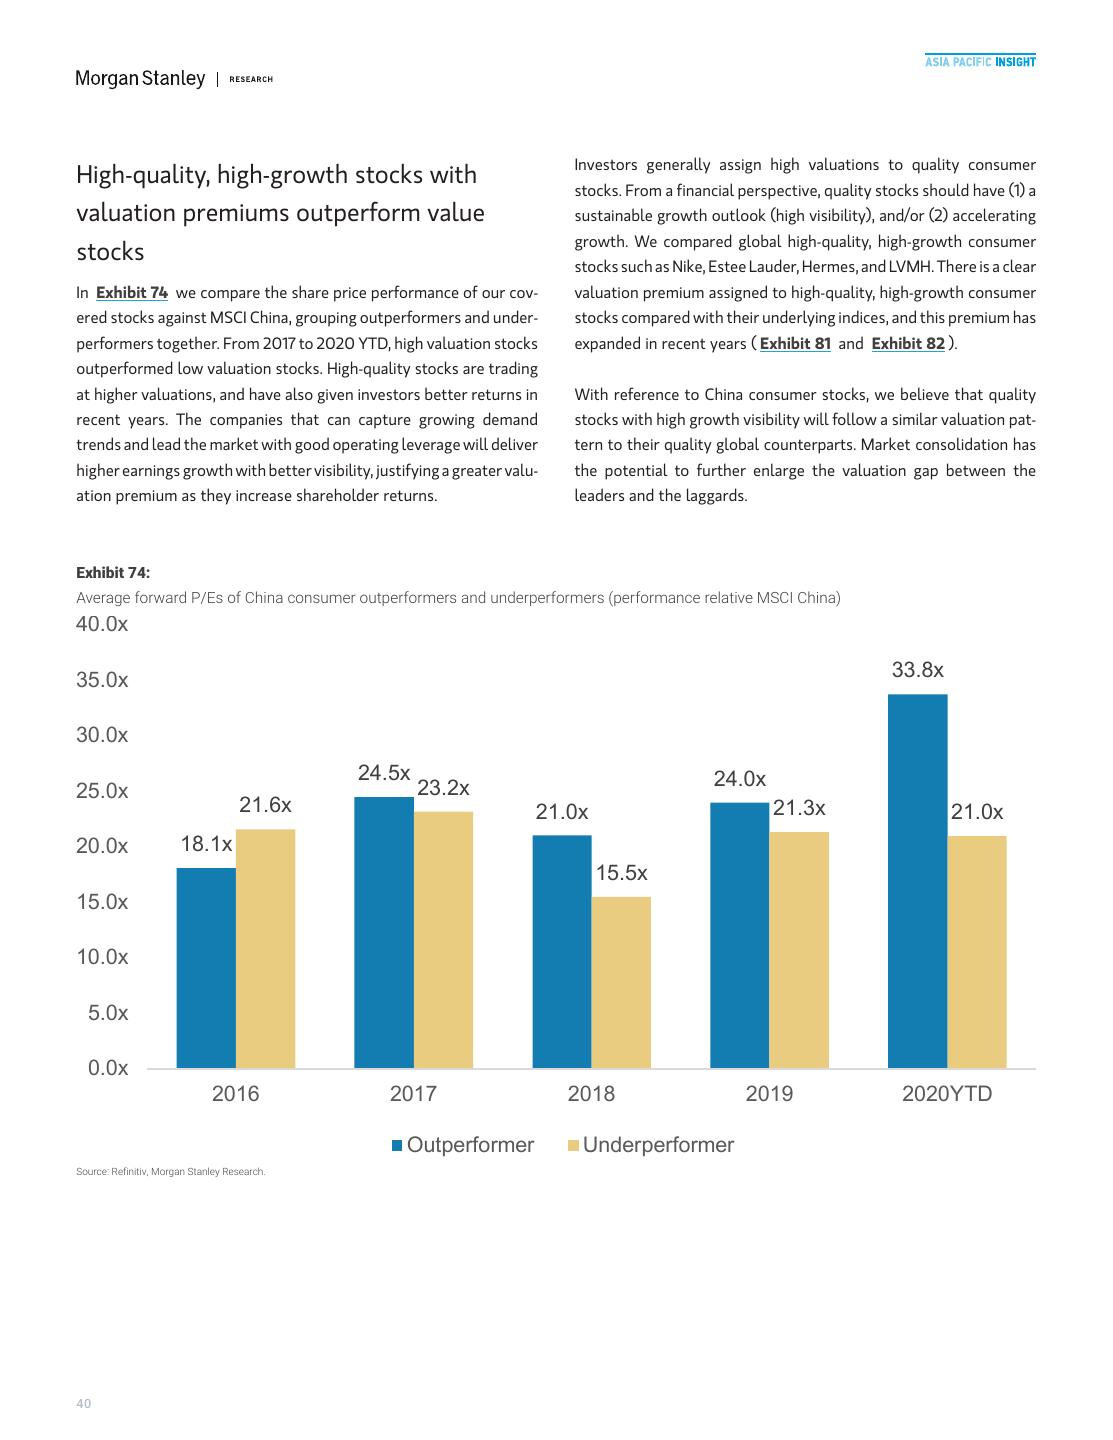
14 .M M Exhibit 16: Comparison between economic cycle (MS-CHEX Index), consumer companies' revenue growth, and ex-factory ASP growth 30% 25% 20% 15% 10% 5% 0% 1Q05 2Q05 3Q05 4Q05 1Q06 2Q06 3Q06 4Q06 1Q07 2Q07 3Q07 4Q07 1Q08 2Q08 3Q08 4Q08 1Q09 2Q09 3Q09 4Q09 1Q10 2Q10 3Q10 4Q10 1Q11 2Q11 3Q11 4Q11 1Q12 2Q12 3Q12 4Q12 1Q13 2Q13 3Q13 4Q13 1Q14 2Q14 3Q14 4Q14 1Q15 2Q15 3Q15 4Q15 1Q16 2Q16 3Q16 4Q16 1Q17 2Q17 3Q17 4Q17 1Q18 2Q18 3Q18 4Q18 1Q19 2Q19 3Q19 4Q19 1Q20 -5% Economic downcycle Consumer companies revenue growth ex-factory ASP MS-CHEX Index -10% Source: Morgan Stanley Research, company data. Note: Consumer companies only include companies covered by Morgan Stanley Research. ibility, thereby justifying a valuation premium over companies unable Valuation: We expect upward earnings to capture these trends. Higher valuation stocks delivered better potential in 2021, and valuation premium share performance from 2017 to YTD2020 ( Exhibit 19 ), and we expect such valuation divergence to continue. to remain As a result, we believe the stocks with higher earnings growth We see upside potential to current 2021 consensus estimates. visibility and durability will continue enjoying a valuation pre- Consensus earnings estimates for consumer companies in 2021 mium. Currently, China consumer stocks under Morgan Stanley (excluding export-oriented companies) has decreased by 6%, on Research coverage are trading at 10-year high P/Es ( Exhibit 20 and average, since the outbreak of Covid-19 ( Exhibit 17 and Exhibit 18 ). Exhibit 21 ). History suggests that stocks with growth acceleration As we expect a less than 2% impact on domestic consumption in or high growth visibility are likely to trade at higher multiples. In addi- 2021, with the support of consumption reshoring, we see the poten- tion, high-quality global consumer growth names also carry high val- tial for upward revisions toward the end of 2020. uations, such as Nike, Estee Lauder, Hermes, and LVMH. We expect widening polarization in fundamental performance Structurally, we think the following names in our coverage will ben- and valuation among consumer stocks. Various moving factors in efit from the trend we expect to unfold: China Tourism Group Duty the market have created a tougher operating environment for con- Free (CTGDF), LVMH, Prada, LGHH, Shiseido, Unicharm, KOSE, sumer companies – and thus for the valuation framework for con- Zhongsheng, MeiDong, Yongda, Hang Lung Properties, PDD, JD, sumer stocks. The companies that can capture the growing demand Alibaba, Meituan, S.F. Holding, ANTA, Li Ning, Topsports, Shenzhou, trends (as discussed above), and lead the market with good oper- Gree, Joyoung, Suofeiya, Moutai, Wuliangye, CRB, Bud APAC, YUMC, ating leverage, should deliver higher earnings growth with better vis- Tingyi. MORGAN STANLEY RESEARCH 13
15 .M M Exhibit 17: Exhibit 18: Consumer sector revenue revision (excluding export-oriented compa- Consumer sector earnings revision (excluding export-oriented compa- nies) nies) Consumer Sector Consumer Sector 2.00% Revenue Revision for 2020e Revenue Revision for 2021e 4.00% Earnings Revision for 2020e Earnings Revision for 2021e 1.00% 2.00% 0.00% 0.00% -1.00% -2.00% -2.00% -3.00% -4.00% -4.00% -6.00% -5.00% -8.00% -6.00% -10.00% -7.00% -12.00% -8.00% -9.00% -14.00% May-19 Jun-19 Jul-19 Aug-19 Sep-19 Oct-19 Nov-19 Dec-19 Jan-20 Feb-20 Mar-20 Apr-20 May-20 Jun-20 May-19 Jun-19 Jul-19 Aug-19 Sep-19 Oct-19 Nov-19 Dec-19 Jan-20 Feb-20 Mar-20 Apr-20 May-20 Jun-20 Source: Refinitiv, Morgan Stanley Research. Note: Industry consensus changes are based on a simple Source: Refinitiv, Morgan Stanley Research. Note: Industry consensus changes are based on a simple average. average. Exhibit 19: Average valuation of China consumer stocks outperformers and underperformers 40.0x 35.0x 33.9x 30.0x 24.5x 24.0x 25.0x 23.2x 21.6x 21.0x 21.3x 21.0x 20.0x 18.1x 15.5x 15.0x 10.0x 5.0x 0.0x 2016 2017 2018 2019 2020YTD Outperformer Underperformer Source: Refinitiv, Morgan Stanley Research. Exhibit 20: Exhibit 21: China consumer stocks' P/E vs revenue and earnings growth China consumer stocks' revenue and earnings growth premium over Consumer Stocks Consumer Stocks N12M P/E Sector Sales Growth Sector earnings growth MSCI 30 65% Consumer Stocks Consumer stocks N12M P/E Premium over MSCICN N12M P/E (X) 55% Sales Premium over MSCICN 25 30% 160% Earnings Premium over MSCICN 24% 24% 45% 25% 140% 20 2010: 35% 20% 120% 30% 2011: 15 +25% 25% 25% 24% 15% 14% 100% 21% 25% 25% 20% 19% 9% 10 20% 15% 14% 16% 10% 8% 80% 2020e: 15% +9% 7% 7% 6% 7% 2012: 2017: 2021e: 5% 2013: 2014: +16% 2018: 2019e: +14% 5% +13% 3% 7% 60% 5 +13% +13% 2016: +15% +13% 5% 2% 2015: 5% 4% +12% 7% 4% 4% 8% 0% 1% 1% 40% 0% - -5% Jan-10 Jul-10 Jan-11 Jul-11 Jan-12 Jul-12 Jan-13 Jul-13 Jan-14 Jul-18 Jul-19 Jul-20 Jul-14 Jan-15 Jul-15 Jan-16 Jul-16 Jan-17 Jul-17 Jan-18 Jan-19 Jan-20 Jan-21 Jul-21 -5% -7% 20% -5% -10% 0% Source: Refinitiv, Morgan Stanley Research estimates. Jul-10 Jan-11 Jul-11 Jan-12 Jul-12 Jan-13 Jul-13 Jan-14 Jul-14 Jan-15 Jul-15 Jan-16 Jul-16 Jan-17 Jul-17 Jan-18 Jul-18 Jan-19 Jul-19 Jan-20 Jul-20 Jan-10 Source: Refinitiv, Morgan Stanley Research estimates. 14
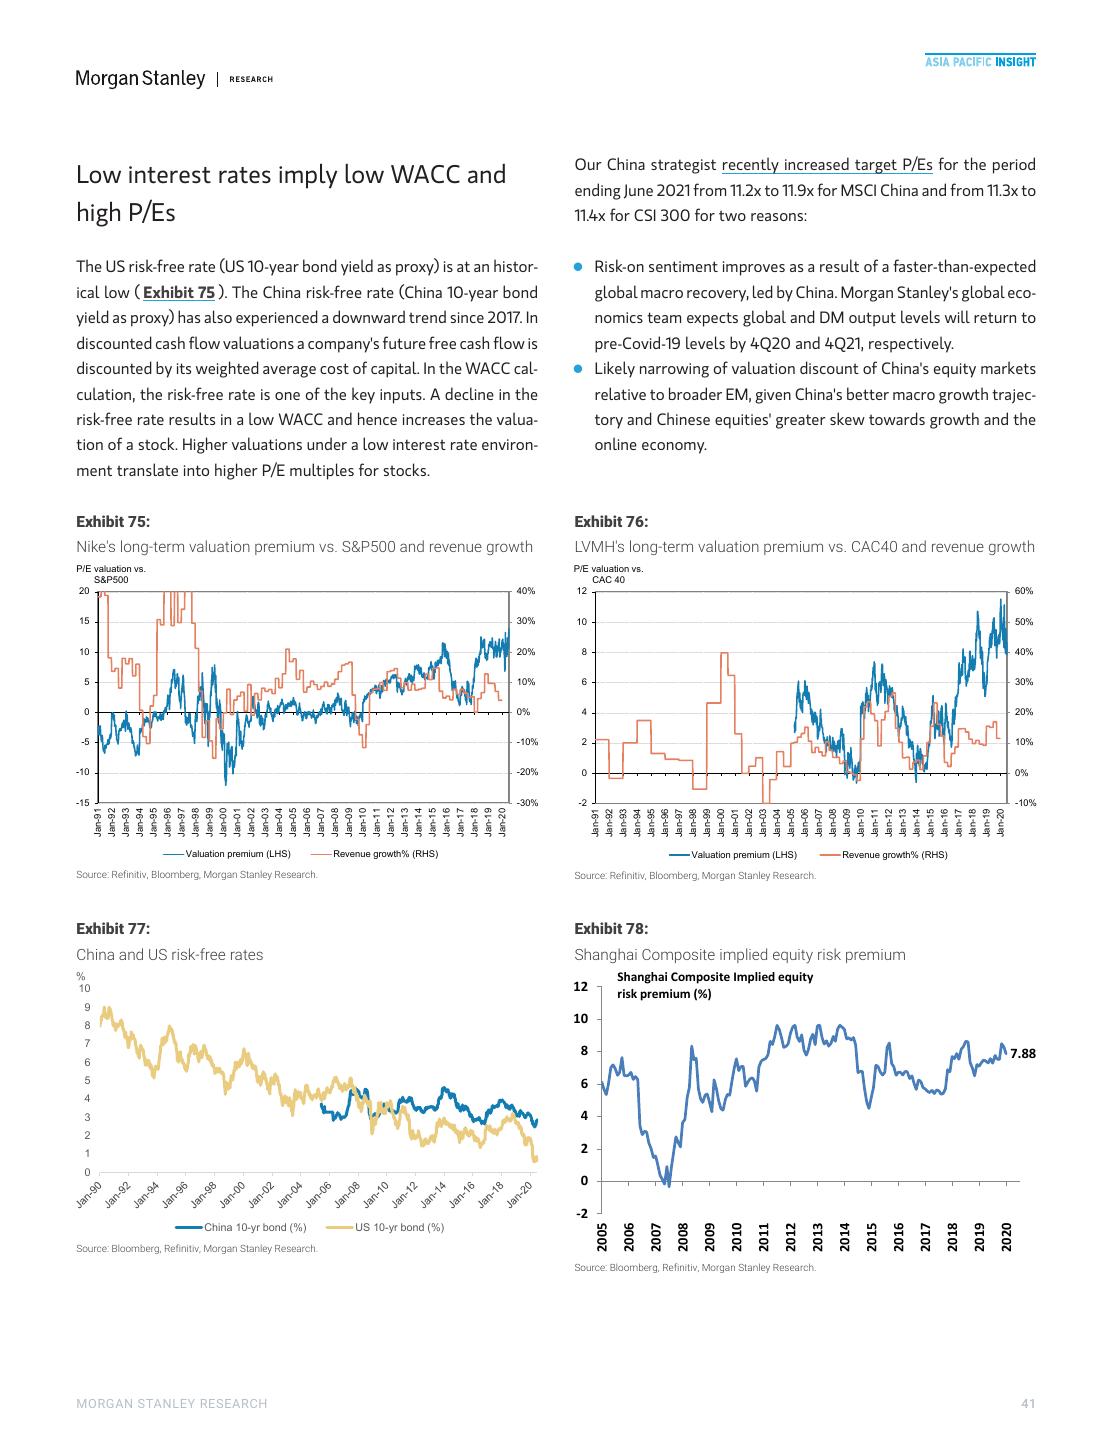
16 .M M Steady Consumption Recovery Amid Rise of the "Stay-Home" Economy We expect China's private consumption to resume its pre- ...with three cyclical supporting factors... Covid growth trend (8% YoY) by year-end and to reach strong growth of 10.5% in 2021, leading to an above- (1) Pass-through of policy easing measures: The annual National trend growth recovery next year. Aside from cyclical People's Congress (NPC) in May confirmed a Rmb5.7trn fiscal stim- factors, such as policy easing pass-through, the smooth ulus package (540bps of GDP widening in augmented fiscal deficit) reopening of service sectors, and the unleashing of pent- this year, half of which would be tax and fee cuts for corporates up demand, the rise of a "stay-home" economy amid ( Exhibit 23 ). Meanwhile, the People's Bank of China (PBoC) has structural consumption reshoring should support adopted a targeted credit policy to facilitate lending to SMEs. These domestic consumption over the next few years. measures could help stabilize the labor market and support a gradual We estimate that overseas spending by Chinese nationals recovery in wage growth – we expect wage growth to pick up to 4% averaged US$260bn annually in 2015-19 in the form of YoY in 2H20 and 11% in 2021 (vs. merely 0.9% in 1H20 and 8.9% in education, travel, purchases of luxury goods, etc. We 2019; Exhibit 24 ). expect funds that might otherwise have been allocated to global travel are likely to be diverted, and should now (2) Smooth reopening of service sectors: Our latest (June) survey support domestic consumption – by US$140-165bn in of our equity research analysts suggests that most service sectors 2020 and US$70-130bn in 2021-23. This could fuel might return to normal by end-3Q20/early 4Q20 ( Exhibit 26 ). domestic consumption growth by 1-2ppts in 2021-23, and Defying recent market concerns about a rebound of new Covid-19 bring a ~10% annual spending boost in the key categories cases in Beijing, any second wave of infection would be more manage- that we expect to benefit (luxury, beauty products, able than the first, in our view, as active surveillance and improved sportswear, luxury cars, leisure and travel). testing/contact tracing would likely result in selective rather than widespread lockdowns, facilitating a smooth reopening of service sectors in most regions of China. Domestic consumption is shifting from (3) Release of pent-up demand: According to our China Financials laggard to leader... team, the household balance sheet has remained robust, despite the Covid-19 disruption (see the following "box" section: Still-healthy In our Mid-year China Economic Outlook (June 15, 2020), we identi- consumer balance sheets, despite Covid-19 shock). In our view, this fied China as Covid-19's “first in, first out” economy in the world, with sets a good foundation for a release of pent-up demand when the GDP returning to its potential growth trend (slightly above 6%) by negative output gap closes. In particular, the stronger-than-seasonal 4Q20 and rebounding to 9.2% in 2021. The key growth drivers in the uptick in household savings YTD ( Exhibit 25 ), despite weaker initial recovery stages have been industrial production and construc- income growth, has implied increased precautionary savings, which tion, which returned to positive growth as early as April. While pri- would likely be released as the virus threat abates and create a surge vate consumption has recovered at a relatively slow pace because of in demand later in the year when uncertainties about the job market continued soft social distancing measures and a sluggish job market, and Covid-19 fade. we believe it could resume the pre-virus growth trend (~8% YoY) and accelerate further, to 10.5% in 2021 (vs. -4.4% in 1H20 and 6.3% in 2019), becoming a key driver to an above-trend economic recovery next year ( Exhibit 22 ). MORGAN STANLEY RESEARCH 15
17 .M M Exhibit 22: Exhibit 23: Private consumption to emerge as a key growth driver in 2021 Half of 2020 fiscal package goes to tax & fee cuts for corporates YoY% RMB Trn 20 Private Consumption 6 MSe 0.9 Gross Fixed Capital Formation 5 (GFCF) 10 4 1.6 3 2020 Fiscal Deficit 0 2.0 2 -10 1 1Q18 2Q18 3Q18 4Q18 1Q19 2Q19 3Q19 4Q19 1Q20 2Q20E 3Q20E 4Q20E 1Q21E 2Q21E 3Q21E 4Q21E 1.2 0 Cyclical Shortfall in Income Public Investment Social Insurance Cut Other Tax & Fee Cuts Source: CEIC, Morgan Stanley Research estimates. Source: 2020 Government Work Report, Morgan Stanley Research estimates. Exhibit 24: Exhibit 25: Wage growth will likely remain subdued in the near term Precautionary household savings surged YTD 30% YoY Nominal Wage Growth 45% Household Saving Rate in 1Q,% of Disposable Income -LS 5.7 6.0 MSe 5.4 Nominal GDP Growth New Household Deposits in Jan-Apr, RMB Trn-RS 5.5 25% 40% 5.0 20% 41% 35% 4.5 15% 4.0 35% 10% 30% 3.5 5% 3.0 25% 2.5 0% 20% 2.0 -5% 2013 2014 2015 2016 2017 2018 2019 2020 Dec-03 Dec-05 Dec-07 Dec-09 Dec-11 Dec-13 Dec-15 Dec-17 Dec-19 Dec-21 Source: CEIC, Morgan Stanley Research. Source: CEIC, Morgan Stanley Research estimates. Exhibit 26: We expect most service sectors to normalize by late 3Q20/early 4Q20 Operating Capacity vs. Normal Levels Demand vs. Normal Levels Date of Date of End-May End-Jun (E) End-May End-Jun (E) Normalization Normalization Property Construction Elly Chen 100% 100% May 100% 100% Apr Property Sales Elly Chen 100% 100% Apr 100% 100% May Auto Sales at Dealers Shelley Wang/Jack Yeung 100% 100% Mid-Apr 100% 100% May Banking Richard Xu 100% 100% Apr 100% 100% May Offline Education Sheng Zhong 80% 90-95% Jul-Aug 100% 100% End-Mar Medical Services Sean Wu 90% 100% End-Jun 85% 90% End-Jul Airline Qianlei Fan 85% 95% 3Q20 50% 65% 4Q20 Rail Transport Qianlei Fan 100% 100% Early-Apr 60% 80% 3Q20 IT Gary Yu/Yang Liu 100% 100% End-Mar 100% 100% Apr Shopping Mall Praveen Choudhary/Hildy Ling 90% 95% Jul-Aug 80% 80-90% Jul-Aug Restaurant^ Lillian Lou/Gary Yu 95% 95-100% End-June 50-80% 60-90% End-3Q Food delivery Lillian Lou/Gary Yu 100% 100% Apr 90% 100% End-June Recreational Personal Care Lillian Lou/Gary Yu 85-90% 95-100% End-June 50-70% 60-80% 2H (e.g. beauty salon, massage services) Tourism Praveen Choudhary/Hildy Ling 30% 30% 3Q 50% 50% 4Q Hotels Praveen Choudhary/Dan Xu 95% 100% End-Jun 60-65% 70% End-4Q Cinema Rebecca Xu 0% 25-40% Aug 0% 15-30% Oct Total 80-90% 90-100% Jun-Aug 65-75% 75-85% 4Q 0-19% in red , 20-39% in pink , 40-59% in orange , 60-79% in yellow , 80-94% in light green , 95-100% in dark green Dates in grey mean already normalized Source: Morgan Stanley Research. ^The operating capacity of restaurants is estimated, based on number of restaurant reopenings. 16
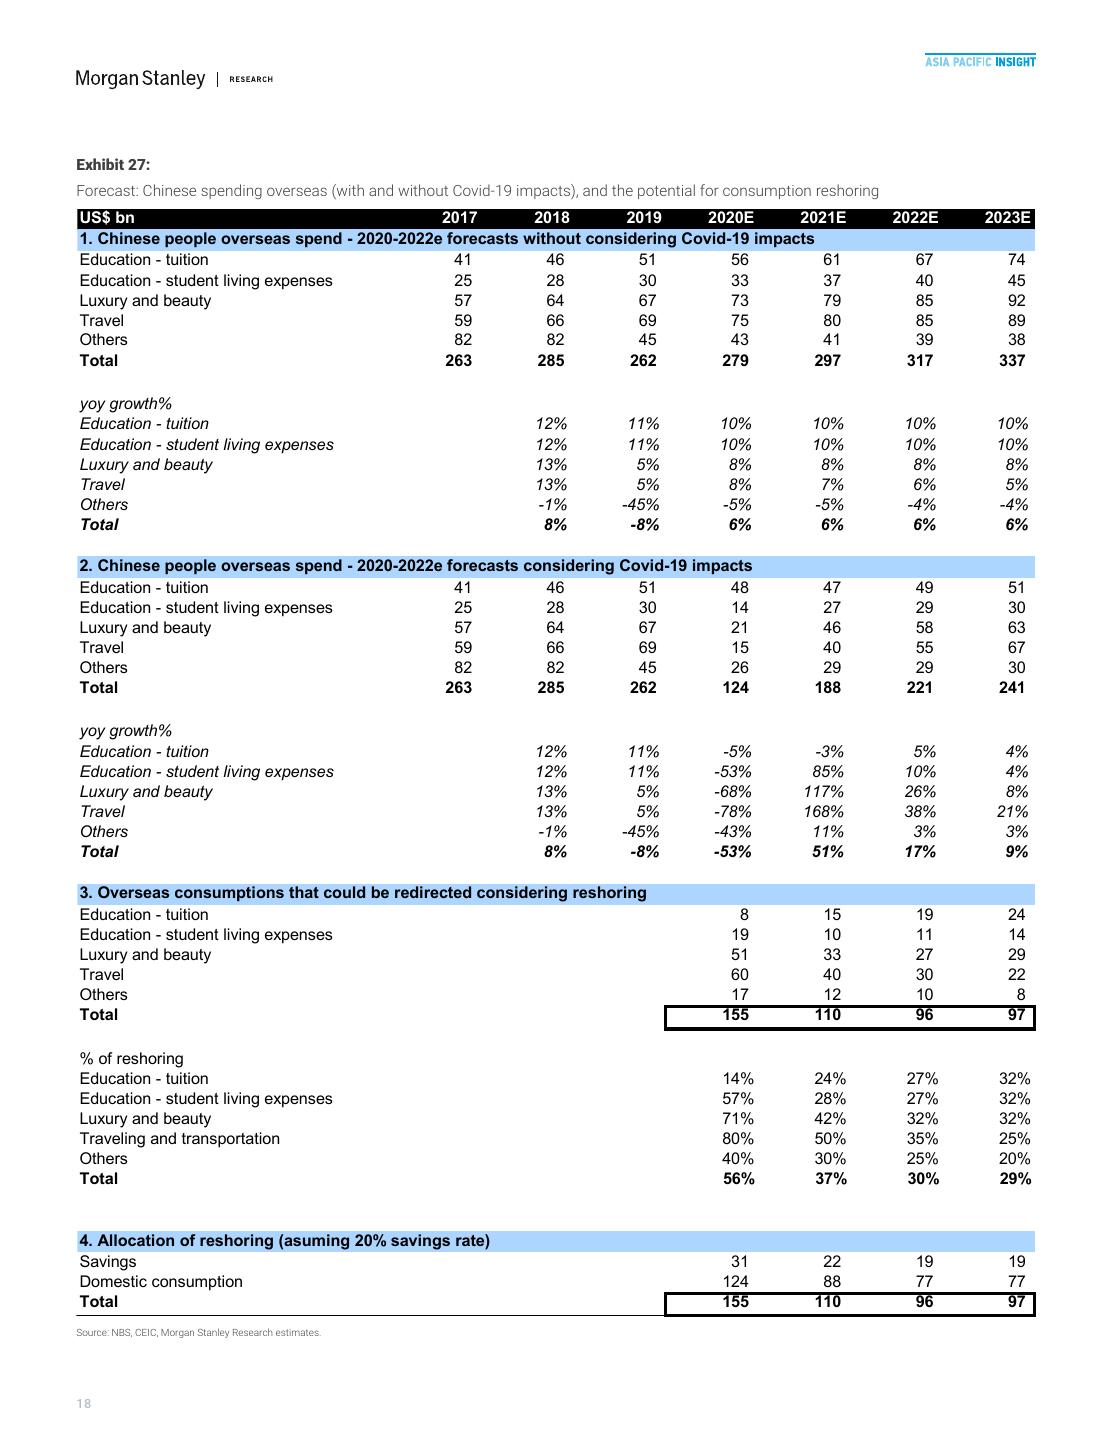
18 .M M including raising the annual duty-free purchase limit from Rmb30K/ ...and structural consumption reshoring year to Rmb100K/year, allowing Hainan residents to purchase selected imported goods at duty-free prices within the list of allowed Besides the aforementioned cyclical drivers, we anticipate a rise of products on the island, and organizing an "international consumable the "stay-home" economy amid consumption spending reshoring, expo". Such policy efforts could help redirect more overseas con- which could provide a boost to domestic consumption over the sumption demand back to China (for details, please see Mapping the coming few years rather than quarters. New Normal: China's Duty-Free Evolution (8 Jun 2020)). According to our US biotech analyst, Matthew Harrison, the Covid-19 In this context, we estimate the consumption reshoring amount situation is unlikely to be resolved until a vaccine is administered to could reach US$140-165bn in 2020 and US$70-130bn annually 60% of the population in developed countries, which could occur by in 2021-23 ( Exhibit 27 ). This could mitigate the negative effect of summer 2021. Meanwhile, ongoing US-China trade tensions could Covid-19 on domestic consumption this year, and supplement con- mean more restrictions on US travel and student visas for Chinese sumption growth by 1-2ppts in 2021-23. Luxury, beauty products, nationals. These factors, combined, could lead to an abrupt dip in sportswear, luxury cars, and travel and leisure (segments that China's overseas spending on tourism and education over the next amount to a combined market size of US$1tn) will likely benefit the few years (from US$260bn per year in 2015-19). Indeed, such most, as overseas spending tends to be concentrated within these spending already dipped to US$46bn in 1Q20 (vs. US$64bn in 1Q of segments (in the past 3 years, China accounted for two-thirds of 2015-19). luxury industry growth, as well as 80% of world travel retail growth in beauty products, according to our sector teams' estimates). We That said, the other side of the coin is that part of the reduced over- estimate that reshored demand could boost annual consumption in seas spending could translate into domestic consumption. This trend these segments by around 10%. There could also be a spillover effect could be further strengthened by the Chinese government's open- to boost domestic consumption in other categories, such as duty- ing-up initiatives. As a case in point, the State Council set detailed free shops, premium shopping malls, household durables, conve- guidance for developing Hainan into a duty-free island in early June, nience type products. MORGAN STANLEY RESEARCH 17
19 .M M Exhibit 27: Forecast: Chinese spending overseas (with and without Covid-19 impacts), and the potential for consumption reshoring US$ bn 2017 2018 2019 2020E 2021E 2022E 2023E 1. Chinese people overseas spend - 2020-2022e forecasts without considering Covid-19 impacts Education - tuition 41 46 51 56 61 67 74 Education - student living expenses 25 28 30 33 37 40 45 Luxury and beauty 57 64 67 73 79 85 92 Travel 59 66 69 75 80 85 89 Others 82 82 45 43 41 39 38 Total 263 285 262 279 297 317 337 yoy growth% Education - tuition 12% 11% 10% 10% 10% 10% Education - student living expenses 12% 11% 10% 10% 10% 10% Luxury and beauty 13% 5% 8% 8% 8% 8% Travel 13% 5% 8% 7% 6% 5% Others -1% -45% -5% -5% -4% -4% Total 8% -8% 6% 6% 6% 6% 2. Chinese people overseas spend - 2020-2022e forecasts considering Covid-19 impacts Education - tuition 41 46 51 48 47 49 51 Education - student living expenses 25 28 30 14 27 29 30 Luxury and beauty 57 64 67 21 46 58 63 Travel 59 66 69 15 40 55 67 Others 82 82 45 26 29 29 30 Total 263 285 262 124 188 221 241 yoy growth% Education - tuition 12% 11% -5% -3% 5% 4% Education - student living expenses 12% 11% -53% 85% 10% 4% Luxury and beauty 13% 5% -68% 117% 26% 8% Travel 13% 5% -78% 168% 38% 21% Others -1% -45% -43% 11% 3% 3% Total 8% -8% -53% 51% 17% 9% 3. Overseas consumptions that could be redirected considering reshoring Education - tuition 8 15 19 24 Education - student living expenses 19 10 11 14 Luxury and beauty 51 33 27 29 Travel 60 40 30 22 Others 17 12 10 8 Total 155 110 96 97 % of reshoring Education - tuition 14% 24% 27% 32% Education - student living expenses 57% 28% 27% 32% Luxury and beauty 71% 42% 32% 32% Traveling and transportation 80% 50% 35% 25% Others 40% 30% 25% 20% Total 56% 37% 30% 29% 4. Allocation of reshoring (asuming 20% savings rate) Savings 31 22 19 19 Domestic consumption 124 88 77 77 Total 155 110 96 97 Source: NBS, CEIC, Morgan Stanley Research estimates. 18
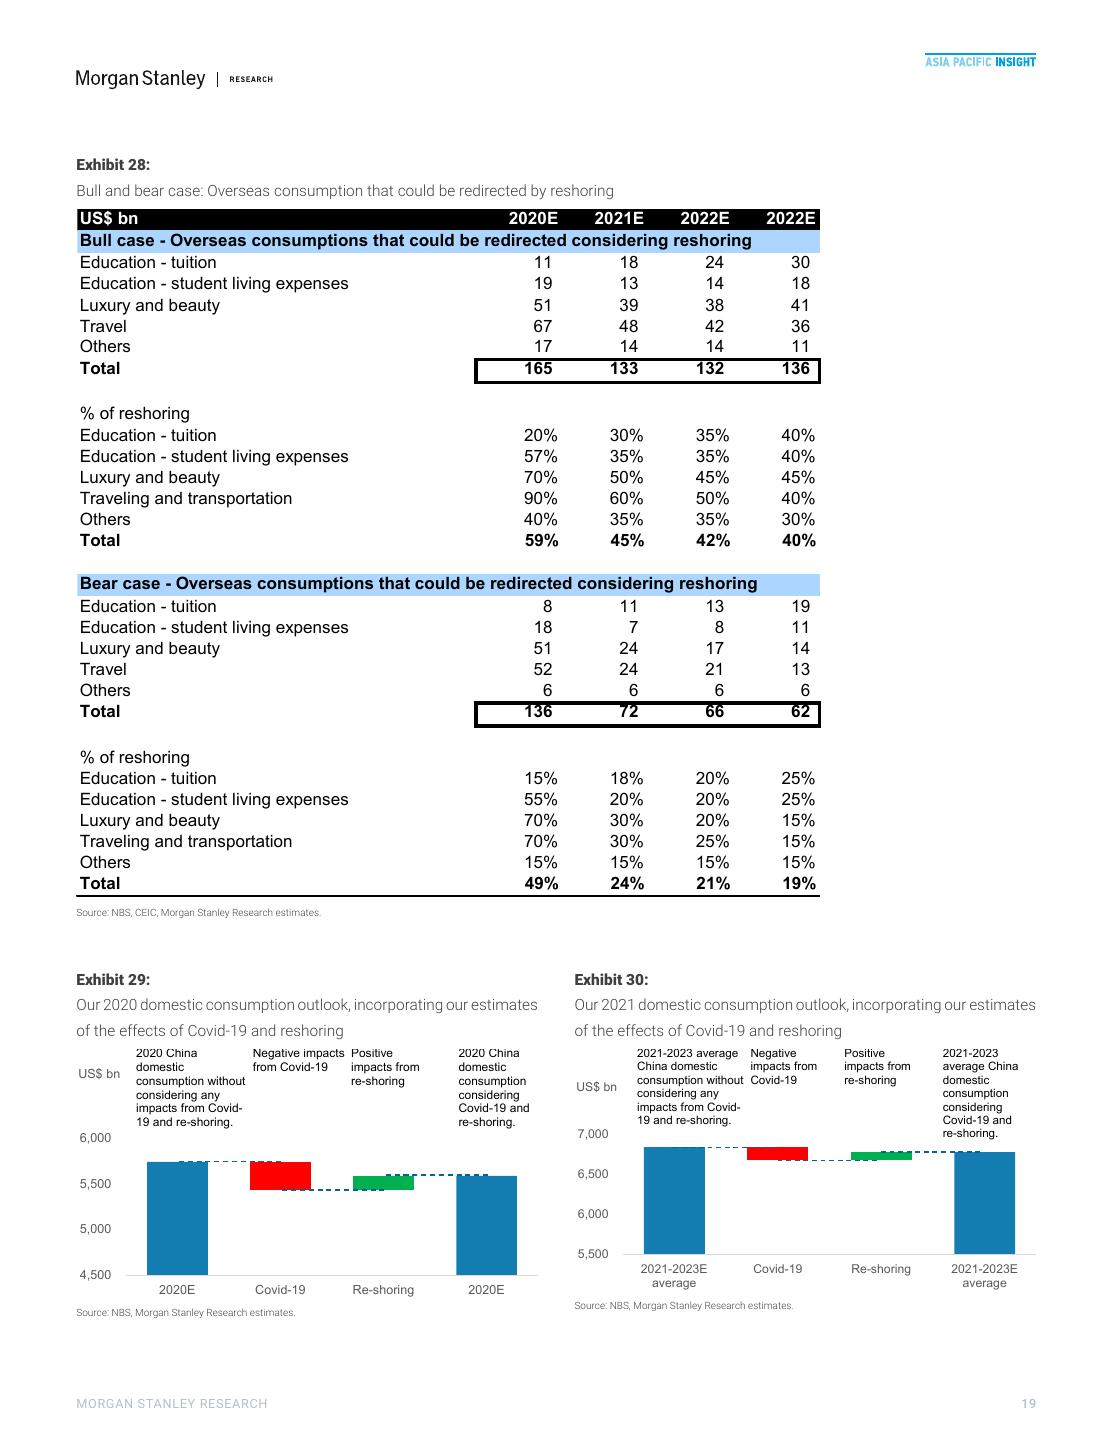
20 .M M Exhibit 28: Bull and bear case: Overseas consumption that could be redirected by reshoring US$ bn 2020E 2021E 2022E 2022E Bull case - Overseas consumptions that could be redirected considering reshoring Education - tuition 11 18 24 30 Education - student living expenses 19 13 14 18 Luxury and beauty 51 39 38 41 Travel 67 48 42 36 Others 17 14 14 11 Total 165 133 132 136 % of reshoring Education - tuition 20% 30% 35% 40% Education - student living expenses 57% 35% 35% 40% Luxury and beauty 70% 50% 45% 45% Traveling and transportation 90% 60% 50% 40% Others 40% 35% 35% 30% Total 59% 45% 42% 40% Bear case - Overseas consumptions that could be redirected considering reshoring Education - tuition 8 11 13 19 Education - student living expenses 18 7 8 11 Luxury and beauty 51 24 17 14 Travel 52 24 21 13 Others 6 6 6 6 Total 136 72 66 62 % of reshoring Education - tuition 15% 18% 20% 25% Education - student living expenses 55% 20% 20% 25% Luxury and beauty 70% 30% 20% 15% Traveling and transportation 70% 30% 25% 15% Others 15% 15% 15% 15% Total 49% 24% 21% 19% Source: NBS, CEIC, Morgan Stanley Research estimates. Exhibit 29: Exhibit 30: Our 2020 domestic consumption outlook, incorporating our estimates Our 2021 domestic consumption outlook, incorporating our estimates of the effects of Covid-19 and reshoring of the effects of Covid-19 and reshoring 2020 China Negative impacts Positive 2020 China 2021-2023 average Negative Positive 2021-2023 domestic from Covid-19 impacts from domestic China domestic impacts from impacts from average China US$ bn consumption without Covid-19 re-shoring domestic consumption without re-shoring consumption US$ bn considering any considering considering any consumption impacts from Covid- Covid-19 and impacts from Covid- considering 19 and re-shoring. re-shoring. 19 and re-shoring. Covid-19 and 6,000 7,000 re-shoring. 6,500 5,500 6,000 5,000 5,500 2021-2023E Covid-19 Re-shoring 2021-2023E 4,500 average average 2020E Covid-19 Re-shoring 2020E Source: NBS, Morgan Stanley Research estimates. Source: NBS, Morgan Stanley Research estimates. MORGAN STANLEY RESEARCH 19
21 .M M Still-healthy consumer balance sheets, despite Covid-19 shock Despite some slowdown in the pace of growth of household wage income and total disposable income in 1Q20, our China Financials team expects the overall household balance sheet to remain healthy, supported by delayed consumption, which spurred the rapid recovery in household deposit growth in March 2020, as well as more resilient household financial asset growth ( Exhibit 31 and Exhibit 32 ). The cleanup of excessive consumption credit growth, particularly in high-risk and high-yield P2P lending, has prepared China's households for some economic volatility ( Exhibit 33 ). While the net debt servicing burden picked up, to 9.7% of disposable income in 2020 (vs. 7.7% in 2019) due to slower income growth, we expect it to stabilize at 10% in 2021, with labor market normalization ( Exhibit 34 ). Exhibit 31: Exhibit 32: Household deposits may have contributed to Improving trend in household credit/financial still-resilient household financial asset growth assets, thanks to a resilient household balance in 1Q20 sheet situation Source: PBOC, NBS, SSE, CEIC, Wind, Morgan Source: PBOC, NBS, SSE, CEIC, Wind, Morgan Stanley Research. Stanley Research. Exhibit 33: Exhibit 34: We expect a slowdown in the growth of non- Household credit impact on disposable income mortgage retail credit in 2020, in line with the is estimated to be 10% in 2020 prudent approach taken by banks amid COVID- 19 Source: CEIC, Morgan Stanley Research estimates. Source: CEIC, Morgan Stanley Research estimates. 20
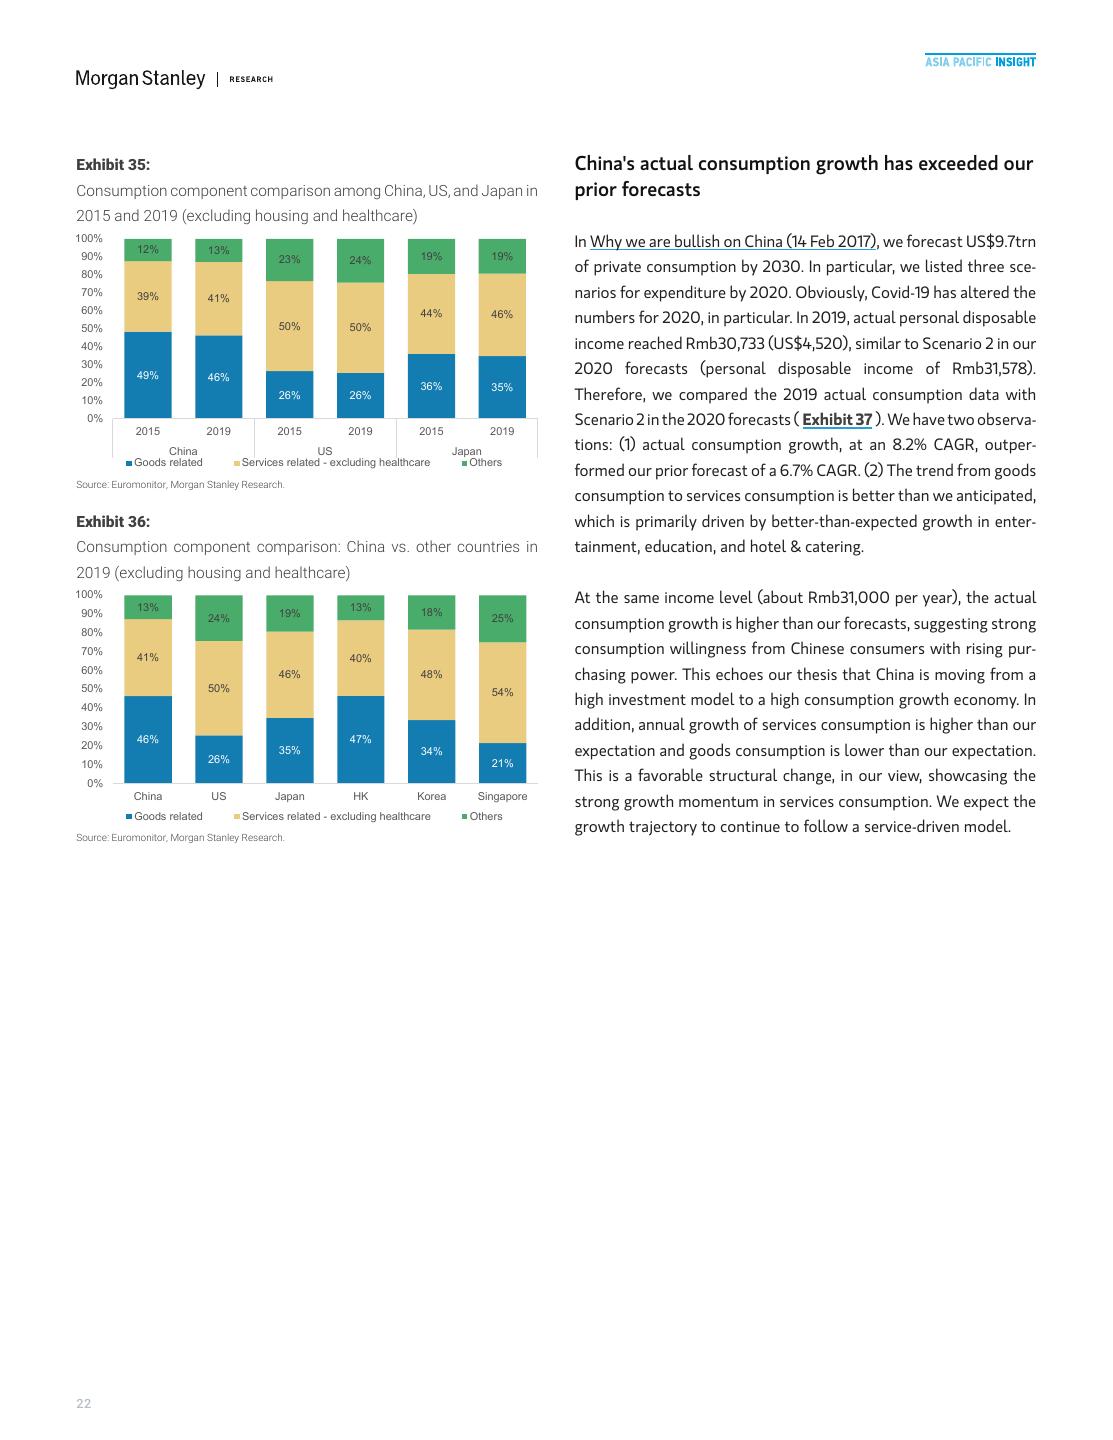
22 .M M New Shapes in Consumption Compared with the consumption structure of developed countries, China is currently more focused on goods than services. We believe that reshoring could change China's domestic consumption structure, shifting it toward a service-driven growth model. Both near- and long-term, consumers are seeking better quality of life, shifting the focus from basic needs to experience-related lifestyle. This is occurring across all income groups, but we expect more significant changes in the high-income group from the reshoring effect. Though we are more positive on premium spending than mass spending, the mass market companies, particularly leading players, are likely to consolidate the market, leveraging their strong balance sheets. Economies of scale will enhance margin profiles. In the short term, we expect pressure from ASP growth deceleration, i.e., disinflation. Given the relatively weak economic outlook, companies do not have strong intentions to continue raising prices. Recalling the experience in 2014 and 2015, when the economy was heading into a downcycle, we observed an ASP growth deceleration. We expect similar trends in 2020 and 2021. Cross-country consumption structure comparison (1) Acceleration in service and experience- consumption upgrade For goods-related consumption, we include food, beverages, apparel, footwear, and household goods. For services-related con- The change to service-related from goods-related consumption has sumption, we include transport, communications, leisure, recreation, its underlying drivers, including demography, household income, and education, lodging, and catering. We exclude housing and healthcare development of the economy. We believe that Covid-19 accelerated in our cross-country comparison because of significant differences this trend, given that more high-income consumers are reshoring, arising from the countries' different systems. From 2015 to 2019, boosting domestic consumption. Experiences from other countries shares of China service-related consumption rose from 39% to 41%, suggest that wallet share of different consumption categories will while goods-related consumption declined from 49% to 46% share gradually shift. Typically, as disposable incomes rise, the typical con- ( Exhibit 35 ). Rise in household disposable income was the primary sumer will likely allocate a larger share of consumption towards ser- reason for higher service-related consumption. vices relative to goods. Specifically, Euromonitor data suggest that as per capita income rises to US$8,000-11,000, expenditure growth Though China is gradually moving toward more service consumption in goods-related consumption slows, while services-related con- in the consumer realm, the contribution from service-related con- sumption growth starts to pick up. When comparing with more sumption is still below levels in other countries. At end-2019, the US developed countries and territories, such as US and Japan, we find had 50% of its consumer consumption from services, and Japan had that there is more room for high-end, service-driven, and experience- about 46%, both higher than China. Developed countries, such as US related consumption for Chinese consumers. and Japan, are good benchmarks for China. In the longer term, for China domestic consumption, we expect service-related and high-end consumption to continue delivering higher growth rates than goods-related consumption, arising from higher disposable income and a shift in consumer appetites. MORGAN STANLEY RESEARCH 21
23 .M M Exhibit 35: China's actual consumption growth has exceeded our Consumption component comparison among China, US, and Japan in prior forecasts 2015 and 2019 (excluding housing and healthcare) 100% In Why we are bullish on China (14 Feb 2017), we forecast US$9.7trn 12% 13% 90% 23% 24% 19% 19% 80% of private consumption by 2030. In particular, we listed three sce- 70% 39% 41% narios for expenditure by 2020. Obviously, Covid-19 has altered the 60% 44% 46% 50% 50% numbers for 2020, in particular. In 2019, actual personal disposable 50% 40% income reached Rmb30,733 (US$4,520), similar to Scenario 2 in our 30% 49% 46% 2020 forecasts (personal disposable income of Rmb31,578). 20% 36% 35% 10% 26% 26% Therefore, we compared the 2019 actual consumption data with 0% Scenario 2 in the 2020 forecasts ( Exhibit 37 ). We have two observa- 2015 2019 2015 2019 2015 2019 China US Japan tions: (1) actual consumption growth, at an 8.2% CAGR, outper- Goods related Services related - excluding healthcare Others formed our prior forecast of a 6.7% CAGR. (2) The trend from goods Source: Euromonitor, Morgan Stanley Research. consumption to services consumption is better than we anticipated, Exhibit 36: which is primarily driven by better-than-expected growth in enter- Consumption component comparison: China vs. other countries in tainment, education, and hotel & catering. 2019 (excluding housing and healthcare) 100% At the same income level (about Rmb31,000 per year), the actual 13% 13% 18% 90% 24% 19% 25% 80% consumption growth is higher than our forecasts, suggesting strong 70% 41% 40% consumption willingness from Chinese consumers with rising pur- 60% 46% 48% chasing power. This echoes our thesis that China is moving from a 50% 50% 54% 40% high investment model to a high consumption growth economy. In 30% addition, annual growth of services consumption is higher than our 46% 47% 20% 26% 35% 34% expectation and goods consumption is lower than our expectation. 10% 21% 0% This is a favorable structural change, in our view, showcasing the China US Japan HK Korea Singapore strong growth momentum in services consumption. We expect the Goods related Services related - excluding healthcare Others growth trajectory to continue to follow a service-driven model. Source: Euromonitor, Morgan Stanley Research. 22
24 .M M Exhibit 37: Comparison between actual results and our prior forecasts 2015-2019 2015-2020E Difference 2019A 2015A 2019A growth Prior 2020E growth vs. 2020E Per capita income (Rmb) 22,514 30,733 37% 31,578 40% -3% Consumption (Rmb mn) Food 6,388,758 8,206,070 28% 8,370,816 31% -2% Alcoholic beverages 887,985 952,947 7% 1,181,311 33% -19% Apparel and services 2,199,801 2,470,256 12% 3,180,922 45% -22% Housing 4,380,428 8,504,685 94% 5,916,368 35% 44% Household Goods and Services 1,621,159 1,348,453 -17% 2,263,157 40% -40% Healthcare 1,737,056 2,025,195 17% 2,455,614 41% -18% Transportation 1,926,553 4,367,891 127% 2,773,434 44% 57% Communication 984,426 885,591 -10% 1,291,353 31% -31% Entertainment 831,870 2,080,851 150% 1,253,615 51% 66% Education 529,295 2,172,605 310% 816,359 54% 166% Hotel & catering 963,277 1,912,341 99% 1,522,199 58% 26% Miscellaneous 3,149,261 3,539,183 12% 4,373,901 39% -19% Total 25,599,869 38,466,067 50% 35,399,048 38% 9% Goods 11,097,704 12,977,726 17% 14,996,205 35% -13% Services 5,235,420 11,419,279 118% 7,656,961 46% 49% Housing 4,380,428 8,504,685 94% 5,916,368 35% 44% Healthcare 1,737,056 2,025,195 17% 2,455,614 41% -18% Miscellaneous 3,149,261 3,539,183 12% 4,373,901 39% -19% Total 25,599,869 38,466,067 50% 35,399,048 38% 9% Contribution% Consumption Food 25% 21% 4ppts 24% 1ppts -2ppts Alcoholic beverages 3% 2% 1ppts 3% 0ppts -1ppts Apparel and services 9% 6% 2ppts 9% 0ppts -3ppts Housing 17% 22% -5ppts 17% 0ppts 5ppts Household Goods and Services 6% 4% 3ppts 6% 0ppts -3ppts Healthcare 7% 5% 2ppts 7% 0ppts -2ppts Transportation 8% 11% -4ppts 8% 0ppts 4ppts Communication 4% 2% 2ppts 4% 0ppts -1ppts Entertainment 3% 5% -2ppts 4% 0ppts 2ppts Education 2% 6% -4ppts 2% 0ppts 3ppts Hotel & catering 4% 5% -1ppts 4% -1ppts 1ppts Miscellaneous 12% 9% 3ppts 12% 0ppts -3ppts Total 100% 100% 0ppts 100% 0ppts 0ppts Goods 43% 34% 10ppts 42% 1ppts -9ppts Services 20% 30% -9ppts 22% -1ppts 8ppts Housing 17% 22% -5ppts 17% 0ppts 5ppts Healthcare 7% 5% 2ppts 7% 0ppts -2ppts Miscellaneous 12% 9% 3ppts 12% 0ppts -3ppts Total 100% 100% 0ppts 100% 0ppts 0ppts Source: Euromonitor, Morgan Stanley Research. MORGAN STANLEY RESEARCH 23
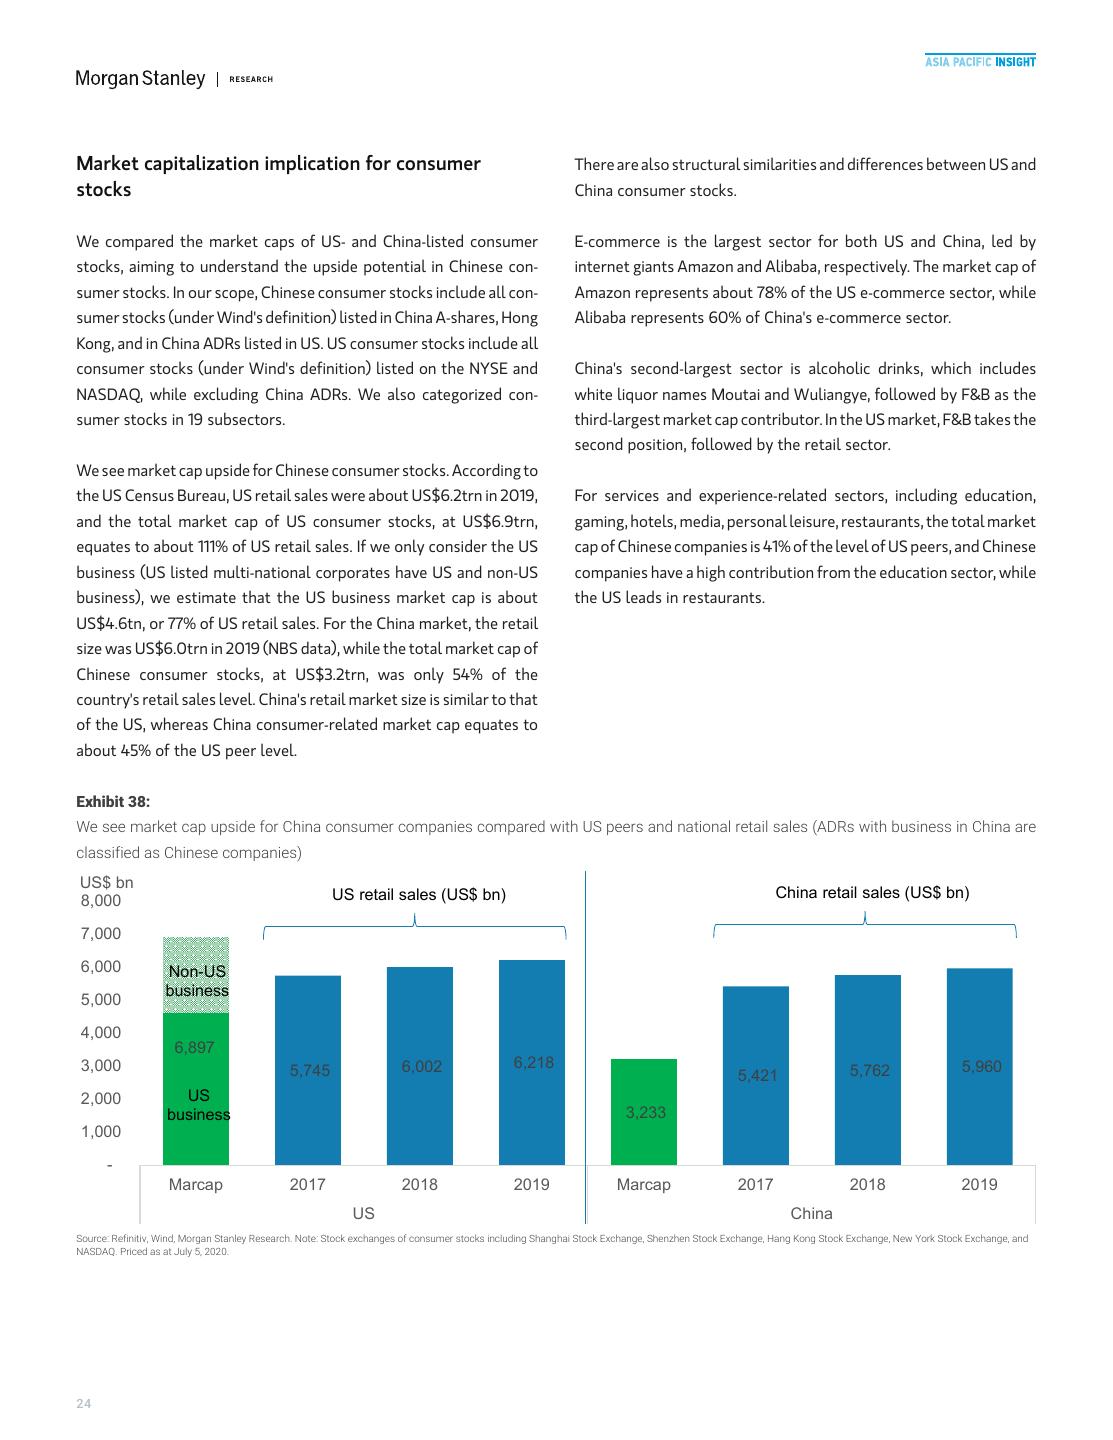
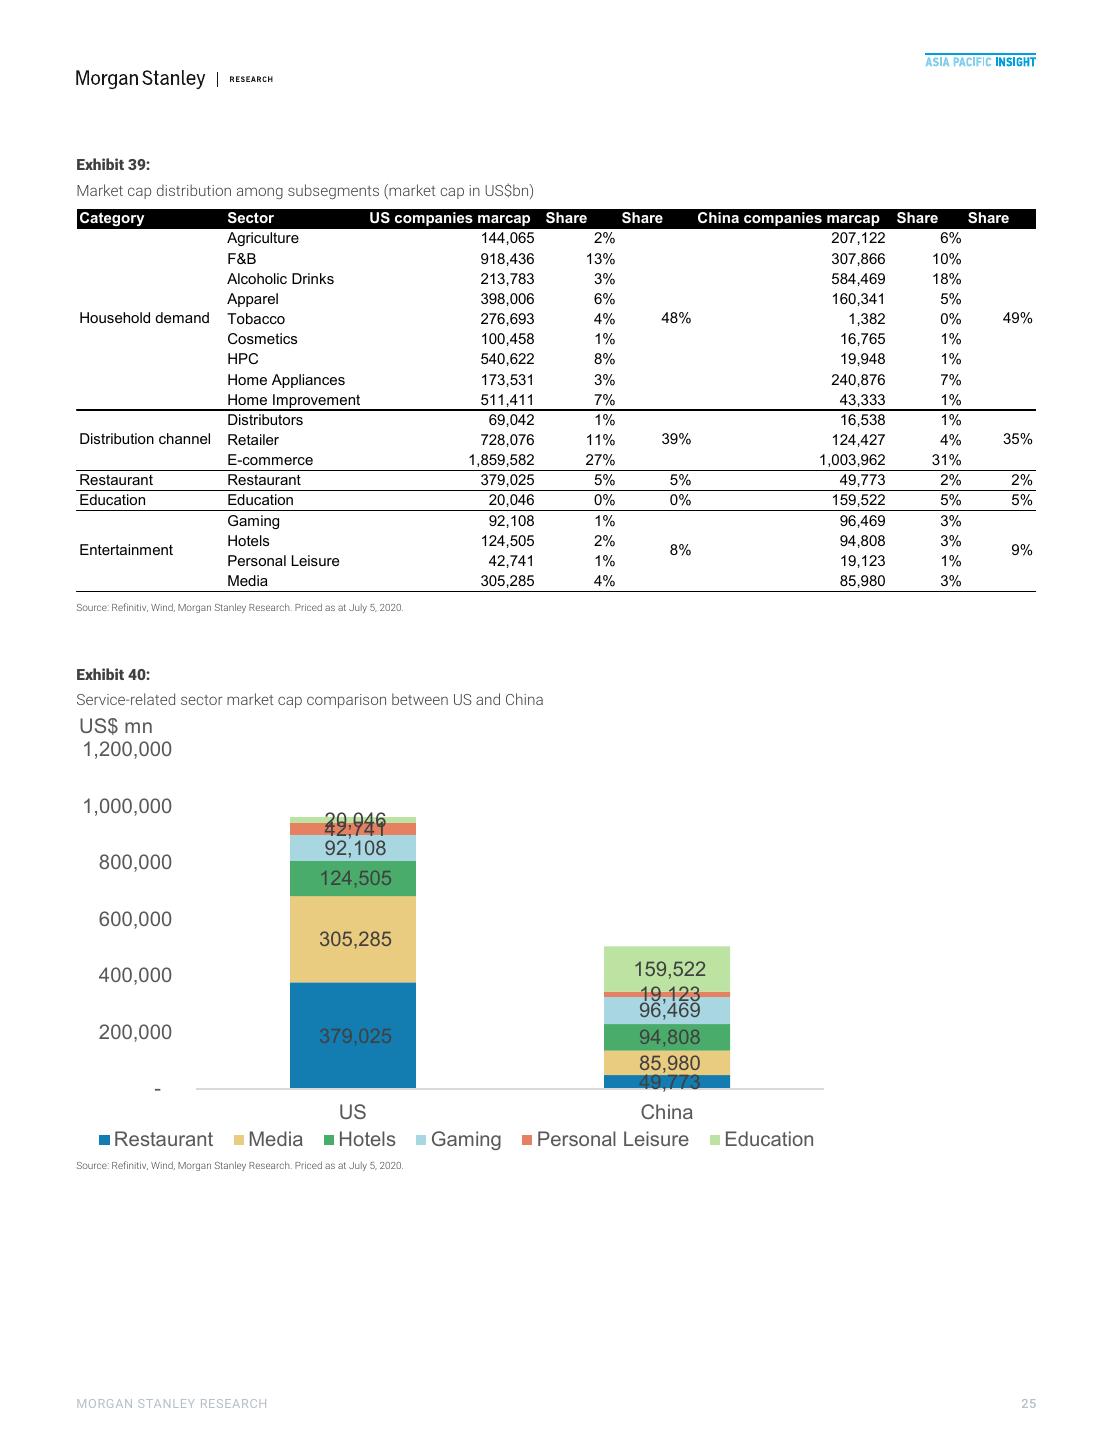
25 .M M Market capitalization implication for consumer There are also structural similarities and differences between US and stocks China consumer stocks. We compared the market caps of US- and China-listed consumer E-commerce is the largest sector for both US and China, led by stocks, aiming to understand the upside potential in Chinese con- internet giants Amazon and Alibaba, respectively. The market cap of sumer stocks. In our scope, Chinese consumer stocks include all con- Amazon represents about 78% of the US e-commerce sector, while sumer stocks (under Wind's definition) listed in China A-shares, Hong Alibaba represents 60% of China's e-commerce sector. Kong, and in China ADRs listed in US. US consumer stocks include all consumer stocks (under Wind's definition) listed on the NYSE and China's second-largest sector is alcoholic drinks, which includes NASDAQ, while excluding China ADRs. We also categorized con- white liquor names Moutai and Wuliangye, followed by F&B as the sumer stocks in 19 subsectors. third-largest market cap contributor. In the US market, F&B takes the second position, followed by the retail sector. We see market cap upside for Chinese consumer stocks. According to the US Census Bureau, US retail sales were about US$6.2trn in 2019, For services and experience-related sectors, including education, and the total market cap of US consumer stocks, at US$6.9trn, gaming, hotels, media, personal leisure, restaurants, the total market equates to about 111% of US retail sales. If we only consider the US cap of Chinese companies is 41% of the level of US peers, and Chinese business (US listed multi-national corporates have US and non-US companies have a high contribution from the education sector, while business), we estimate that the US business market cap is about the US leads in restaurants. US$4.6tn, or 77% of US retail sales. For the China market, the retail size was US$6.0trn in 2019 (NBS data), while the total market cap of Chinese consumer stocks, at US$3.2trn, was only 54% of the country's retail sales level. China's retail market size is similar to that of the US, whereas China consumer-related market cap equates to about 45% of the US peer level. Exhibit 38: We see market cap upside for China consumer companies compared with US peers and national retail sales (ADRs with business in China are classified as Chinese companies) US$ bn 8,000 US retail sales (US$ bn) China retail sales (US$ bn) 7,000 6,000 Non-US business 5,000 4,000 6,897 3,000 5,745 6,002 6,218 5,762 5,960 5,421 2,000 US business 3,233 1,000 - Marcap 2017 2018 2019 Marcap 2017 2018 2019 US China Source: Refinitiv, Wind, Morgan Stanley Research. Note: Stock exchanges of consumer stocks including Shanghai Stock Exchange, Shenzhen Stock Exchange, Hang Kong Stock Exchange, New York Stock Exchange, and NASDAQ. Priced as at July 5, 2020. 24
26 .M M Exhibit 39: Market cap distribution among subsegments (market cap in US$bn) Category Sector US companies marcap Share Share China companies marcap Share Share Agriculture 144,065 2% 207,122 6% F&B 918,436 13% 307,866 10% Alcoholic Drinks 213,783 3% 584,469 18% Apparel 398,006 6% 160,341 5% Household demand Tobacco 276,693 4% 48% 1,382 0% 49% Cosmetics 100,458 1% 16,765 1% HPC 540,622 8% 19,948 1% Home Appliances 173,531 3% 240,876 7% Home Improvement 511,411 7% 43,333 1% Distributors 69,042 1% 16,538 1% Distribution channel Retailer 728,076 11% 39% 124,427 4% 35% E-commerce 1,859,582 27% 1,003,962 31% Restaurant Restaurant 379,025 5% 5% 49,773 2% 2% Education Education 20,046 0% 0% 159,522 5% 5% Gaming 92,108 1% 96,469 3% Hotels 124,505 2% 94,808 3% Entertainment 8% 9% Personal Leisure 42,741 1% 19,123 1% Media 305,285 4% 85,980 3% Source: Refinitiv, Wind, Morgan Stanley Research. Priced as at July 5, 2020. Exhibit 40: Service-related sector market cap comparison between US and China US$ mn 1,200,000 1,000,000 20,046 42,741 92,108 800,000 124,505 600,000 305,285 400,000 159,522 19,123 96,469 200,000 379,025 94,808 85,980 - 49,773 US China Restaurant Media Hotels Gaming Personal Leisure Education Source: Refinitiv, Wind, Morgan Stanley Research. Priced as at July 5, 2020. MORGAN STANLEY RESEARCH 25
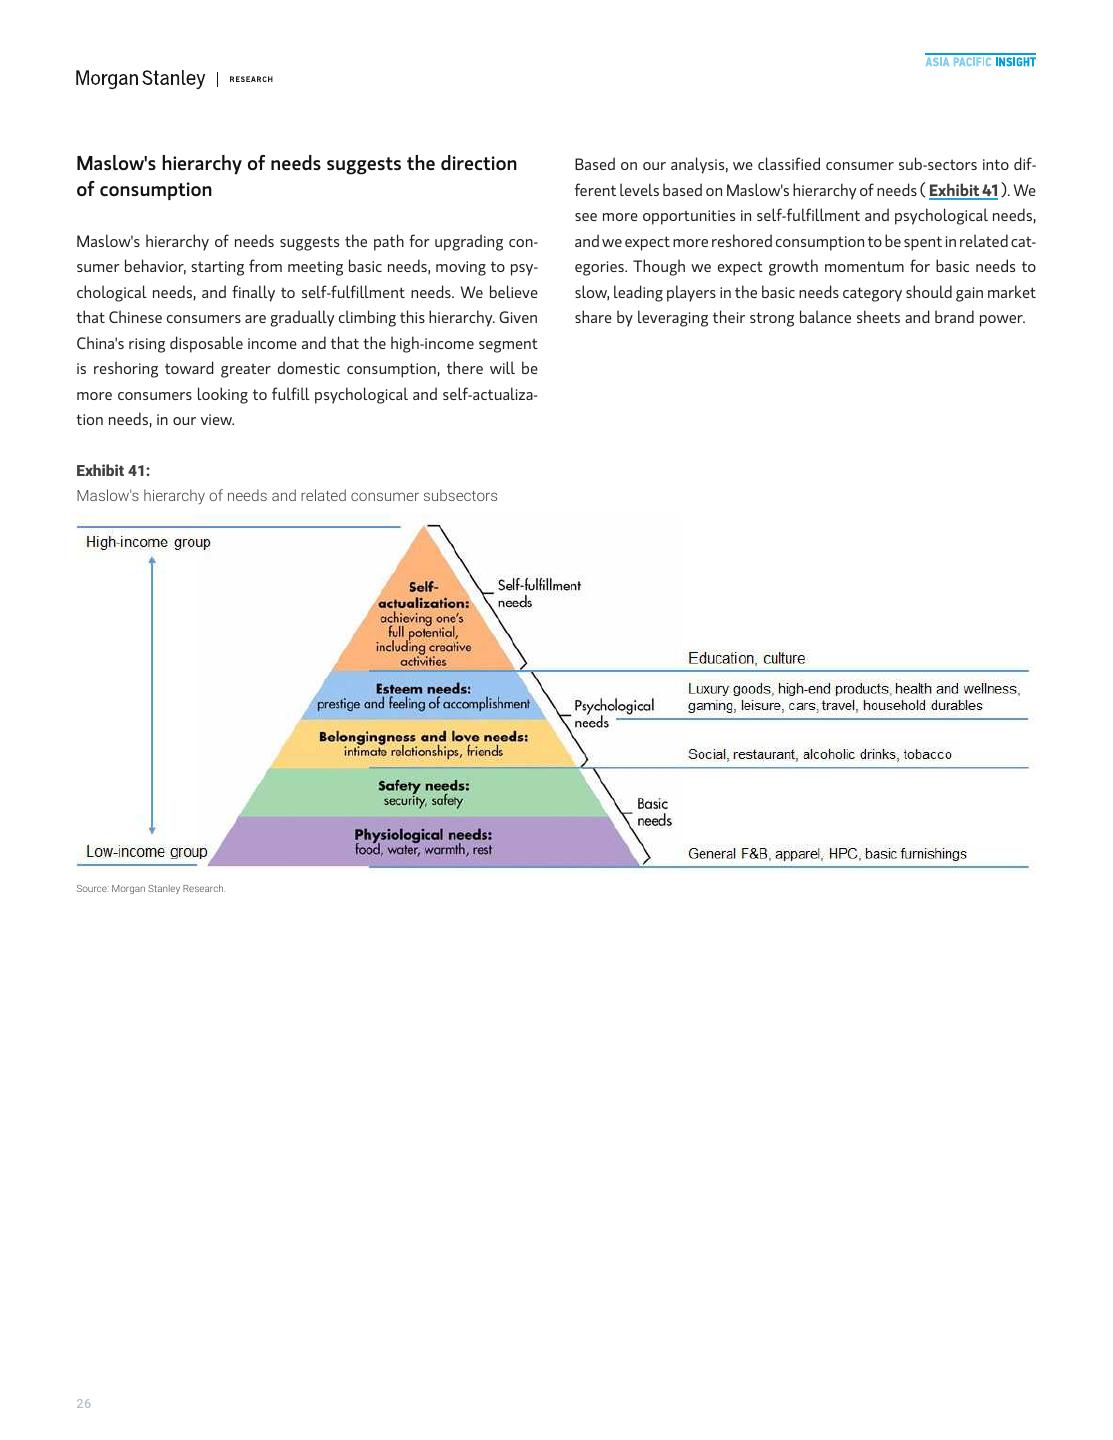
27 .M M Maslow's hierarchy of needs suggests the direction Based on our analysis, we classified consumer sub-sectors into dif- of consumption ferent levels based on Maslow's hierarchy of needs ( Exhibit 41 ). We see more opportunities in self-fulfillment and psychological needs, Maslow's hierarchy of needs suggests the path for upgrading con- and we expect more reshored consumption to be spent in related cat- sumer behavior, starting from meeting basic needs, moving to psy- egories. Though we expect growth momentum for basic needs to chological needs, and finally to self-fulfillment needs. We believe slow, leading players in the basic needs category should gain market that Chinese consumers are gradually climbing this hierarchy. Given share by leveraging their strong balance sheets and brand power. China's rising disposable income and that the high-income segment is reshoring toward greater domestic consumption, there will be more consumers looking to fulfill psychological and self-actualiza- tion needs, in our view. Exhibit 41: Maslow's hierarchy of needs and related consumer subsectors Source: Morgan Stanley Research. 26
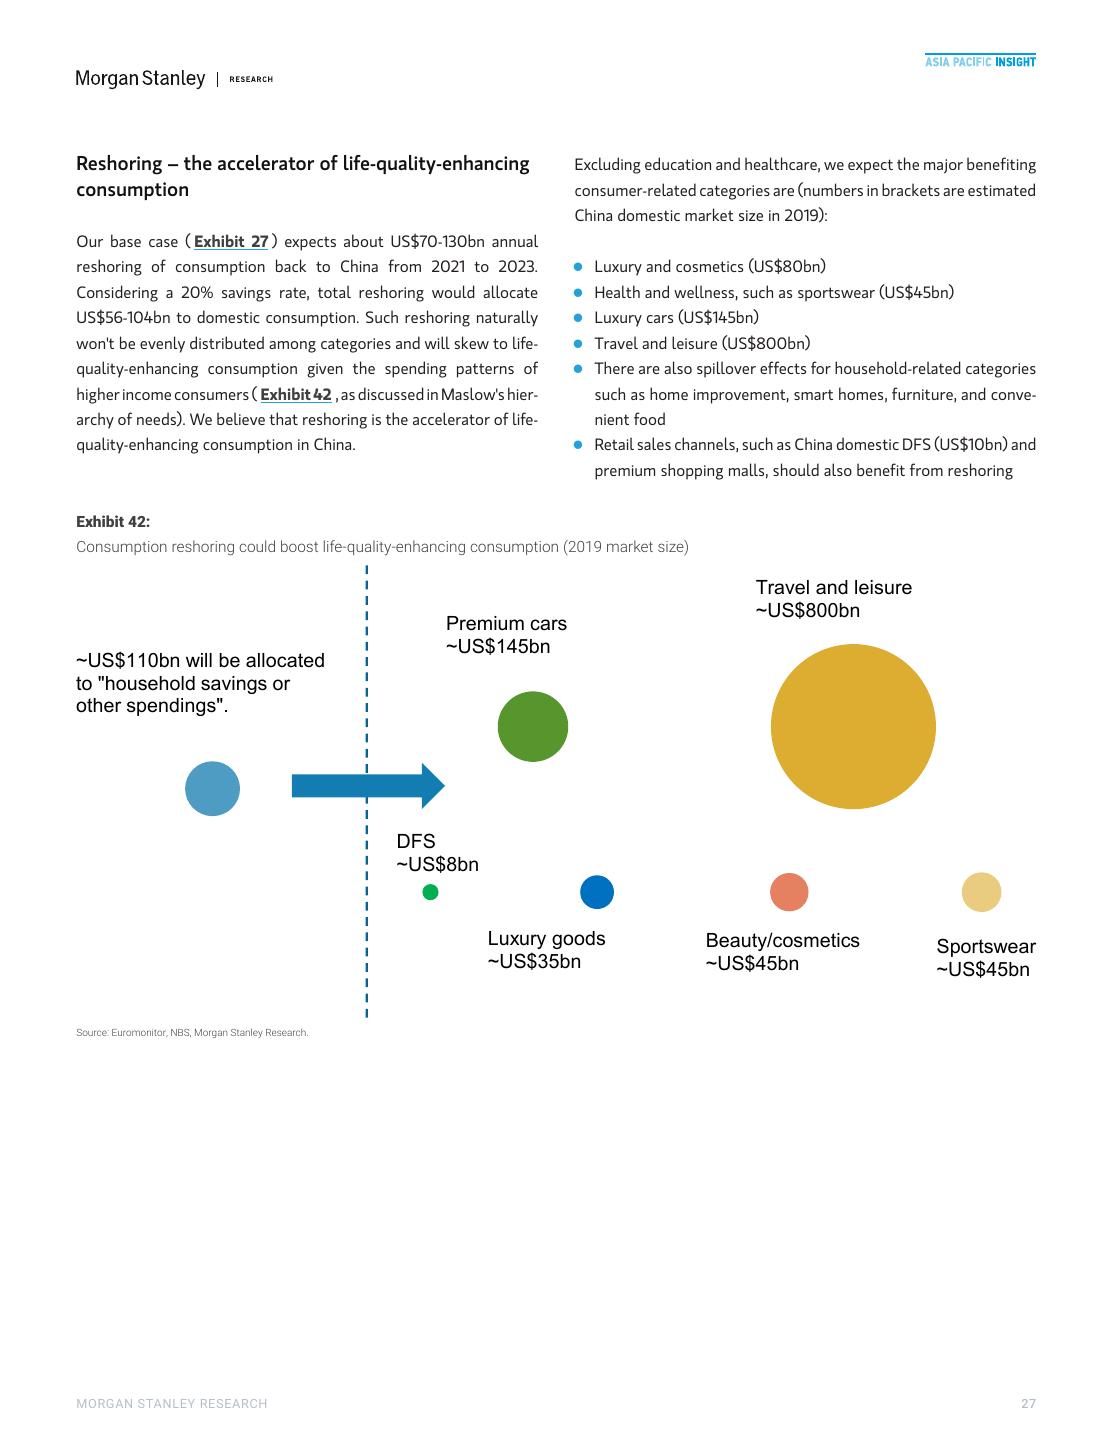
28 .M M Reshoring – the accelerator of life-quality-enhancing Excluding education and healthcare, we expect the major benefiting consumption consumer-related categories are (numbers in brackets are estimated China domestic market size in 2019): Our base case ( Exhibit 27 ) expects about US$70-130bn annual reshoring of consumption back to China from 2021 to 2023. l Luxury and cosmetics (US$80bn) Considering a 20% savings rate, total reshoring would allocate l Health and wellness, such as sportswear (US$45bn) US$56-104bn to domestic consumption. Such reshoring naturally l Luxury cars (US$145bn) won't be evenly distributed among categories and will skew to life- l Travel and leisure (US$800bn) quality-enhancing consumption given the spending patterns of l There are also spillover effects for household-related categories higher income consumers ( Exhibit 42 , as discussed in Maslow's hier- such as home improvement, smart homes, furniture, and conve- archy of needs). We believe that reshoring is the accelerator of life- nient food quality-enhancing consumption in China. l Retail sales channels, such as China domestic DFS (US$10bn) and premium shopping malls, should also benefit from reshoring Exhibit 42: Consumption reshoring could boost life-quality-enhancing consumption (2019 market size) Travel and leisure ~US$800bn Premium cars ~US$145bn ~US$110bn will be allocated to "household savings or other spendings". DFS ~US$8bn Luxury goods Beauty/cosmetics Sportswear ~US$35bn ~US$45bn ~US$45bn Source: Euromonitor, NBS, Morgan Stanley Research. MORGAN STANLEY RESEARCH 27
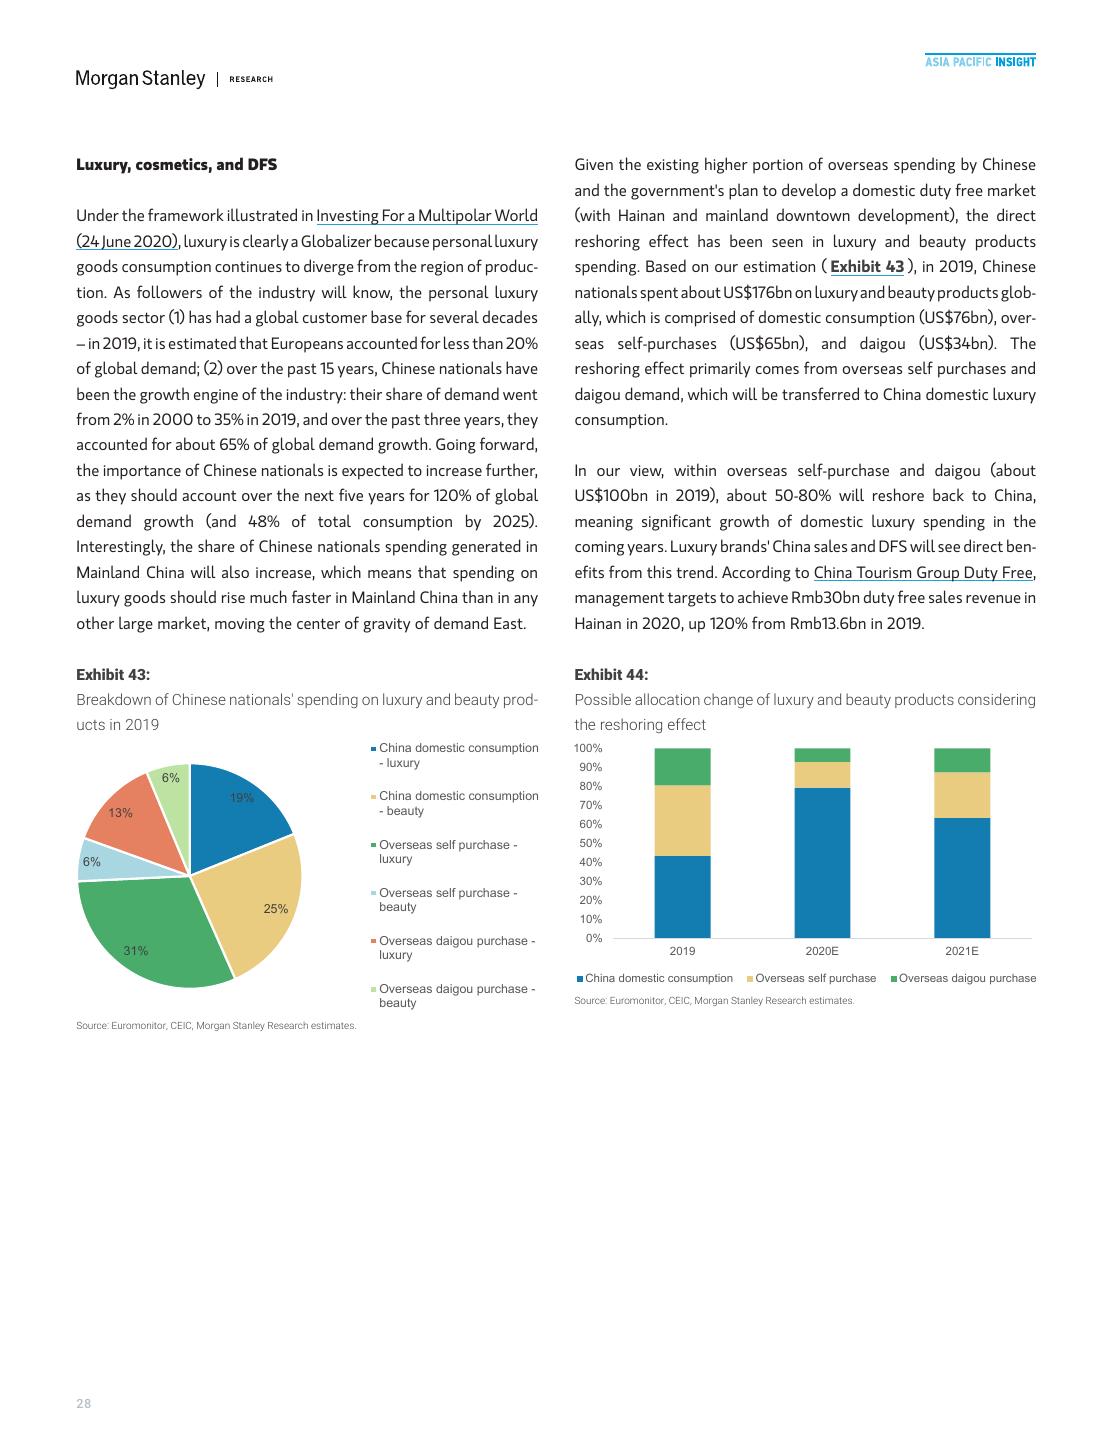
29 .M M Luxury, cosmetics, and DFS Given the existing higher portion of overseas spending by Chinese and the government's plan to develop a domestic duty free market Under the framework illustrated in Investing For a Multipolar World (with Hainan and mainland downtown development), the direct (24 June 2020), luxury is clearly a Globalizer because personal luxury reshoring effect has been seen in luxury and beauty products goods consumption continues to diverge from the region of produc- spending. Based on our estimation ( Exhibit 43 ), in 2019, Chinese tion. As followers of the industry will know, the personal luxury nationals spent about US$176bn on luxury and beauty products glob- goods sector (1) has had a global customer base for several decades ally, which is comprised of domestic consumption (US$76bn), over- – in 2019, it is estimated that Europeans accounted for less than 20% seas self-purchases (US$65bn), and daigou (US$34bn). The of global demand; (2) over the past 15 years, Chinese nationals have reshoring effect primarily comes from overseas self purchases and been the growth engine of the industry: their share of demand went daigou demand, which will be transferred to China domestic luxury from 2% in 2000 to 35% in 2019, and over the past three years, they consumption. accounted for about 65% of global demand growth. Going forward, the importance of Chinese nationals is expected to increase further, In our view, within overseas self-purchase and daigou (about as they should account over the next five years for 120% of global US$100bn in 2019), about 50-80% will reshore back to China, demand growth (and 48% of total consumption by 2025). meaning significant growth of domestic luxury spending in the Interestingly, the share of Chinese nationals spending generated in coming years. Luxury brands' China sales and DFS will see direct ben- Mainland China will also increase, which means that spending on efits from this trend. According to China Tourism Group Duty Free, luxury goods should rise much faster in Mainland China than in any management targets to achieve Rmb30bn duty free sales revenue in other large market, moving the center of gravity of demand East. Hainan in 2020, up 120% from Rmb13.6bn in 2019. Exhibit 43: Exhibit 44: Breakdown of Chinese nationals' spending on luxury and beauty prod- Possible allocation change of luxury and beauty products considering ucts in 2019 the reshoring effect China domestic consumption 100% - luxury 90% 6% 80% 19% China domestic consumption 70% 13% - beauty 60% Overseas self purchase - 50% 6% luxury 40% 30% Overseas self purchase - 20% 25% beauty 10% Overseas daigou purchase - 0% 31% luxury 2019 2020E 2021E China domestic consumption Overseas self purchase Overseas daigou purchase Overseas daigou purchase - beauty Source: Euromonitor, CEIC, Morgan Stanley Research estimates. Source: Euromonitor, CEIC, Morgan Stanley Research estimates. 28


