- 快召唤伙伴们来围观吧
- 微博 QQ QQ空间 贴吧
- 文档嵌入链接
- 复制
- 微信扫一扫分享
- 已成功复制到剪贴板
Conquering Hadoop 和 Apache Spar用于军事
展开查看详情
1 .Conquering Hadoop & Spark with Operational Intelligence Akshay Rai Senior Software Engineer LinkedIn #Exp2SAIS
2 .About Me • Sr. Software Engineer in the Data Platform team at LinkedIn • Engineering lead for Dr. Elephant • Building an operational intelligence platform for Hadoop & Spark #Exp2SAIS
3 . OUR VISION Create economic opportunity for every member of the global workforce
4 . OUR MISSION Connect the world’s professionals to make them more productive and successful
5 .Today’s Talk • Everyday problems with Hadoop & Spark • Approach & its complexity • Application Metrics Architecture • Operational Intelligence Vision • Examples & Use-cases #Exp2SAIS 5
6 . Everyday problems with Hadoop & Spark Debug issues like slow jobs Track user behavior Generate metric reports for jobs Debug & address global issues Hadoop/Spark Users Platform Developers Setup alerts and monitor flows Capacity Planning Cluster snapshot with slice & dice Generate Cost to Serve Reports Operational Experts Engineering Leads #Exp2SAIS 6
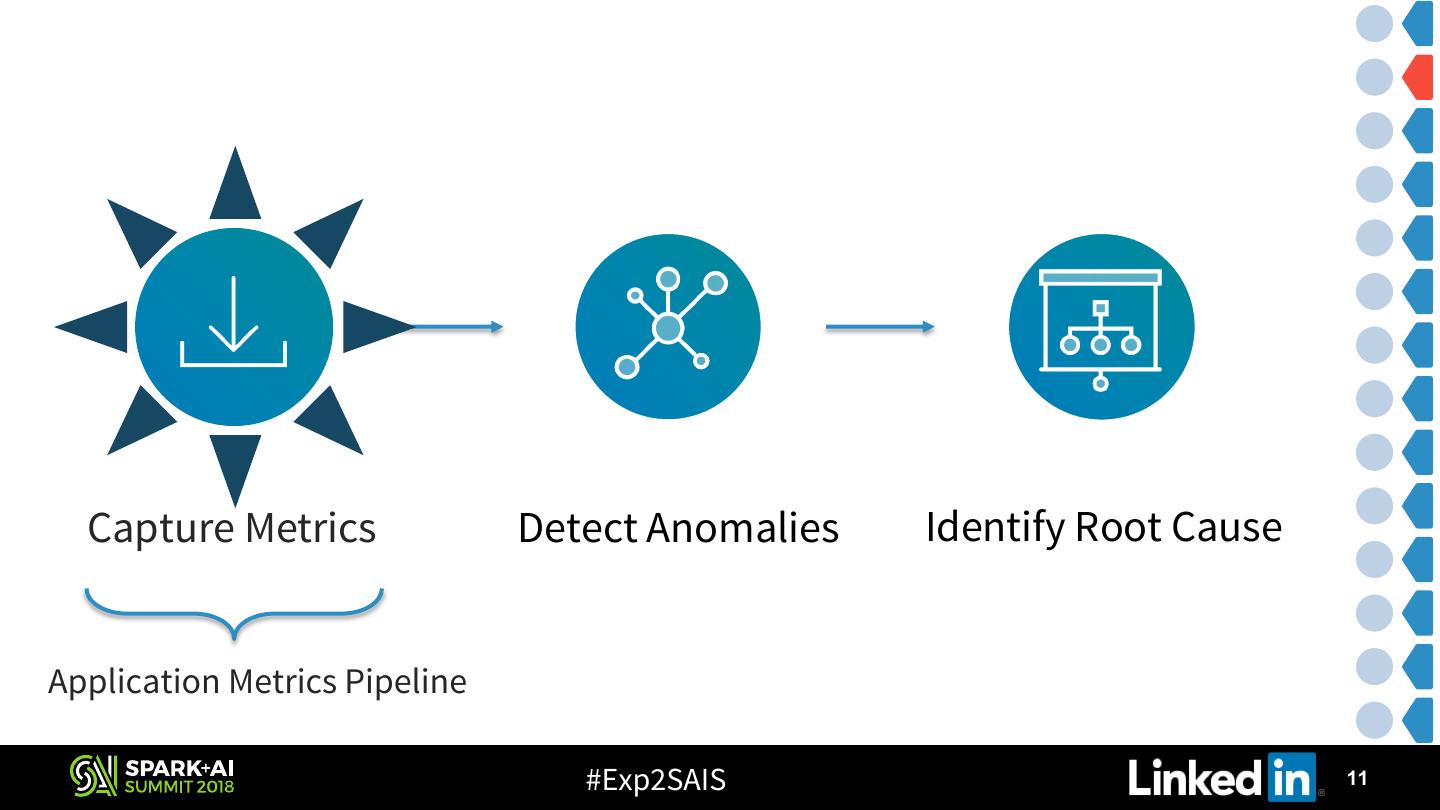
7 . Bird’s-Eye View Capture Metrics Detect Anomalies Identify Root Cause #Exp2SAIS 7
8 . Complexity of the approach • Collect application metrics in near real time • Collect metrics from multiple engines like MR and Spark • Integrate app metrics with data lineage and metadata Capture Metrics #Exp2SAIS 8
9 . Complexity of the approach • Knowledge of various modeling techniques • In-depth knowledge of Hadoop and Spark Metrics • Event based anomaly detection and alerting Detect Anomalies #Exp2SAIS 9
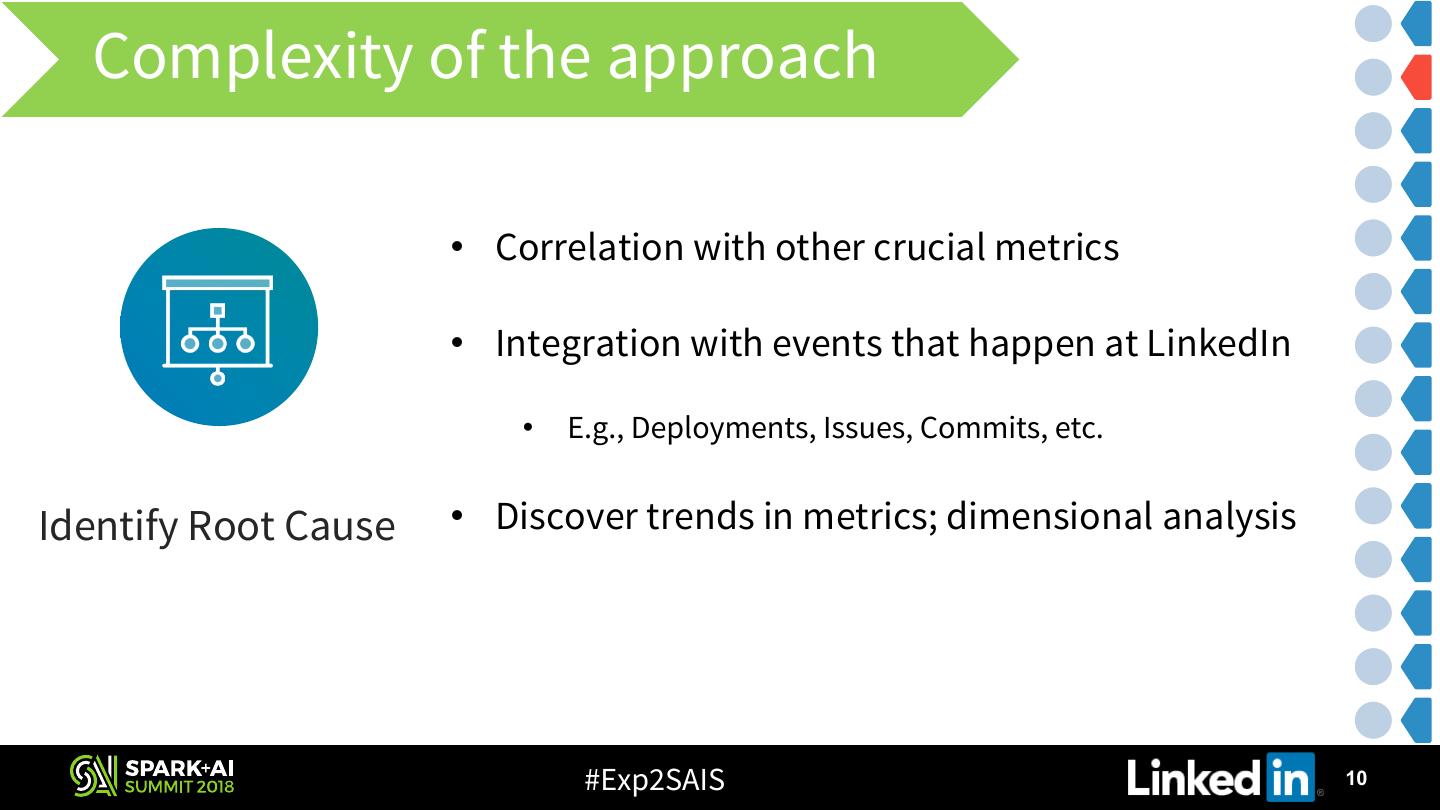
10 . Complexity of the approach • Correlation with other crucial metrics • Integration with events that happen at LinkedIn • E.g., Deployments, Issues, Commits, etc. Identify Root Cause • Discover trends in metrics; dimensional analysis #Exp2SAIS 10
11 . Capture Metrics Detect Anomalies Identify Root Cause Application Metrics Pipeline #Exp2SAIS 11
12 .Capture Metrics Detect Anomalies Identify Root Cause ThirdEye Github: https://github.com/linkedin/pinot/tree/master/thirdeye #Exp2SAIS 12
13 .Capture Metrics Application Metrics Architecture #Exp2SAIS 13
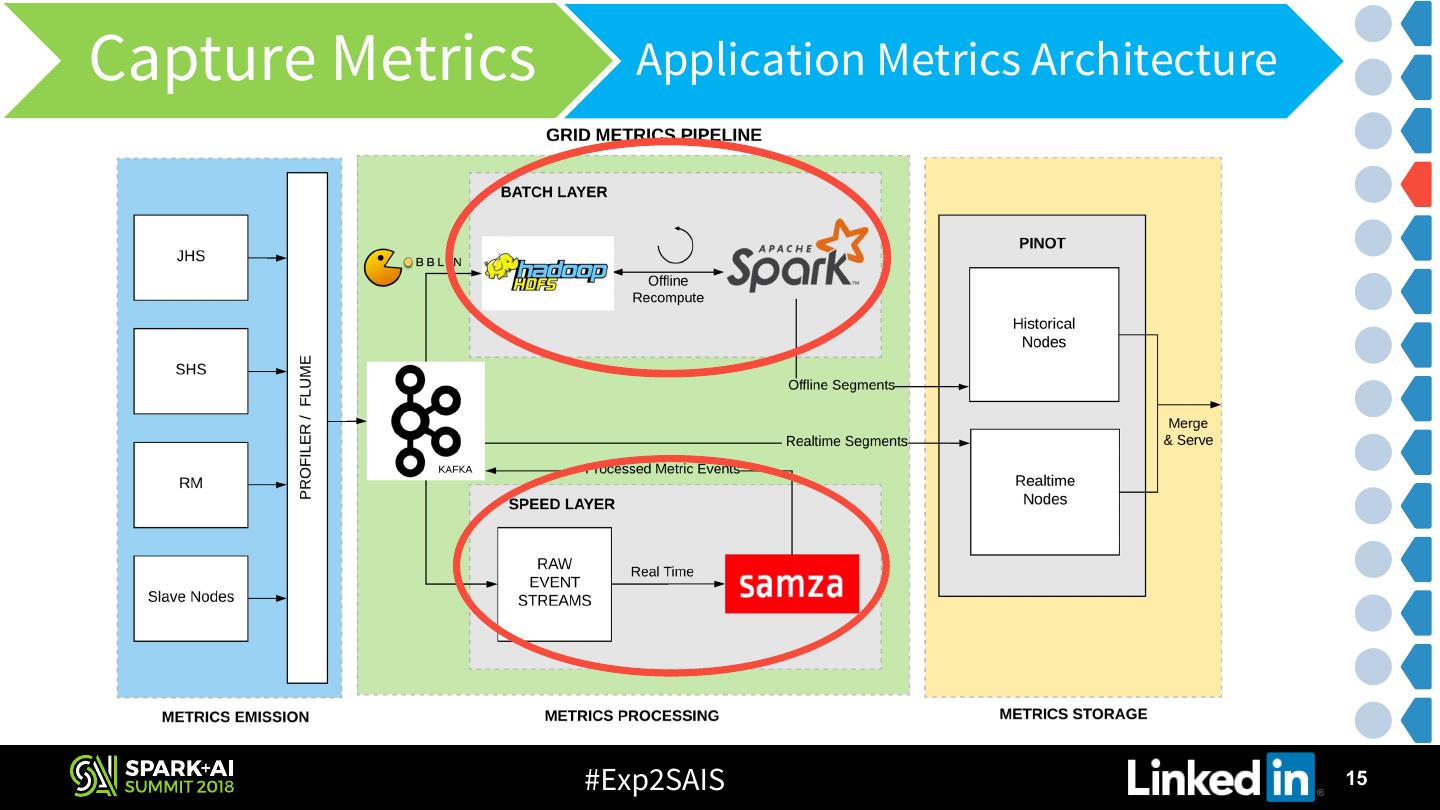
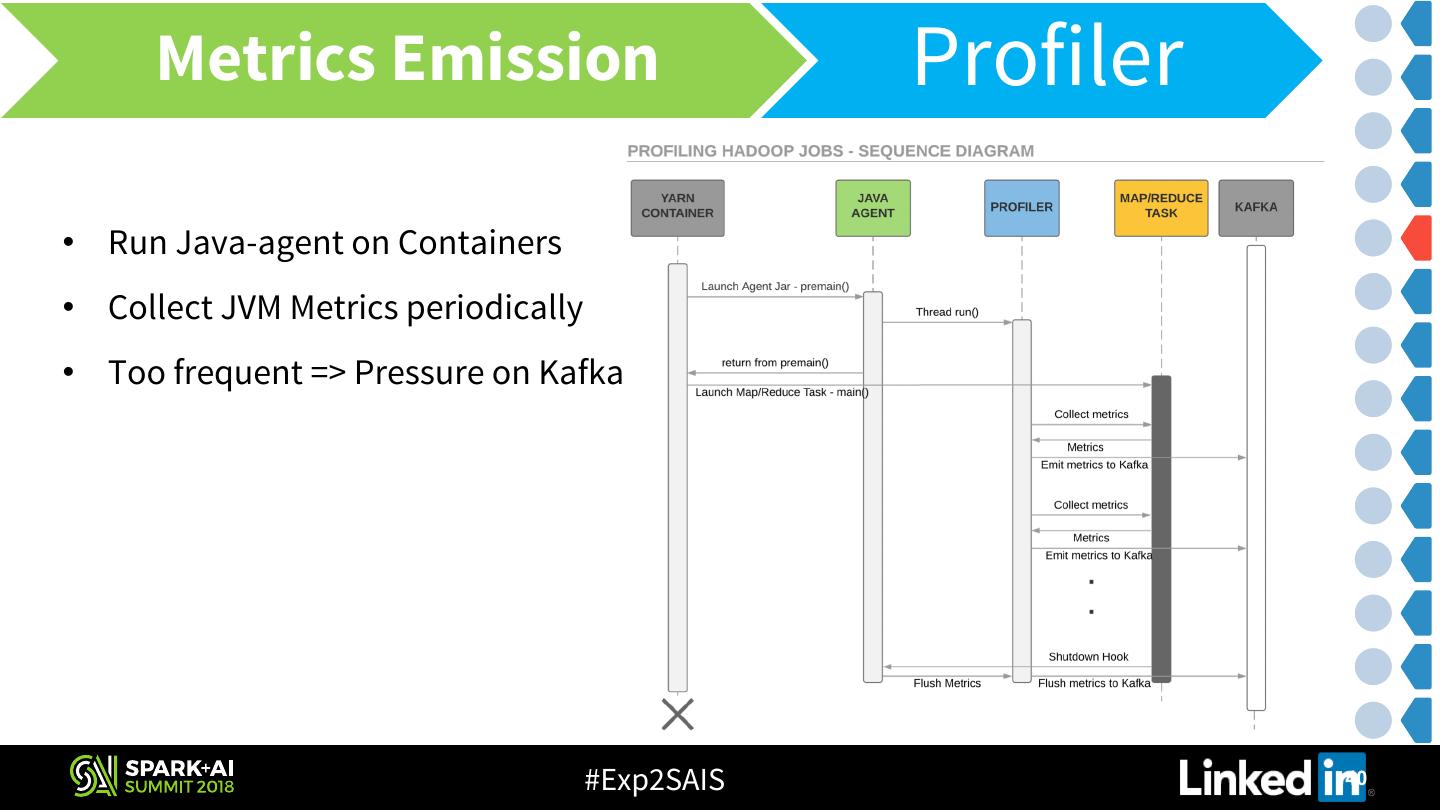
14 .Application Metrics Architecture Emission • Hadoop Metrics • Counters – Parse Job History files & emit to Kafka using Flume • JVM Metrics – Launch a java-agent & emit metrics to Kafka • Spark Metrics • Status API V1 metrics – Rest API of Spark History Server • JVM Metrics – “Spark Metrics System” • Derived Metrics • Resource & Time metrics - Parse RM logs using Flume & emit to Kafka #Exp2SAIS 14
15 .Capture Metrics Application Metrics Architecture #Exp2SAIS 15
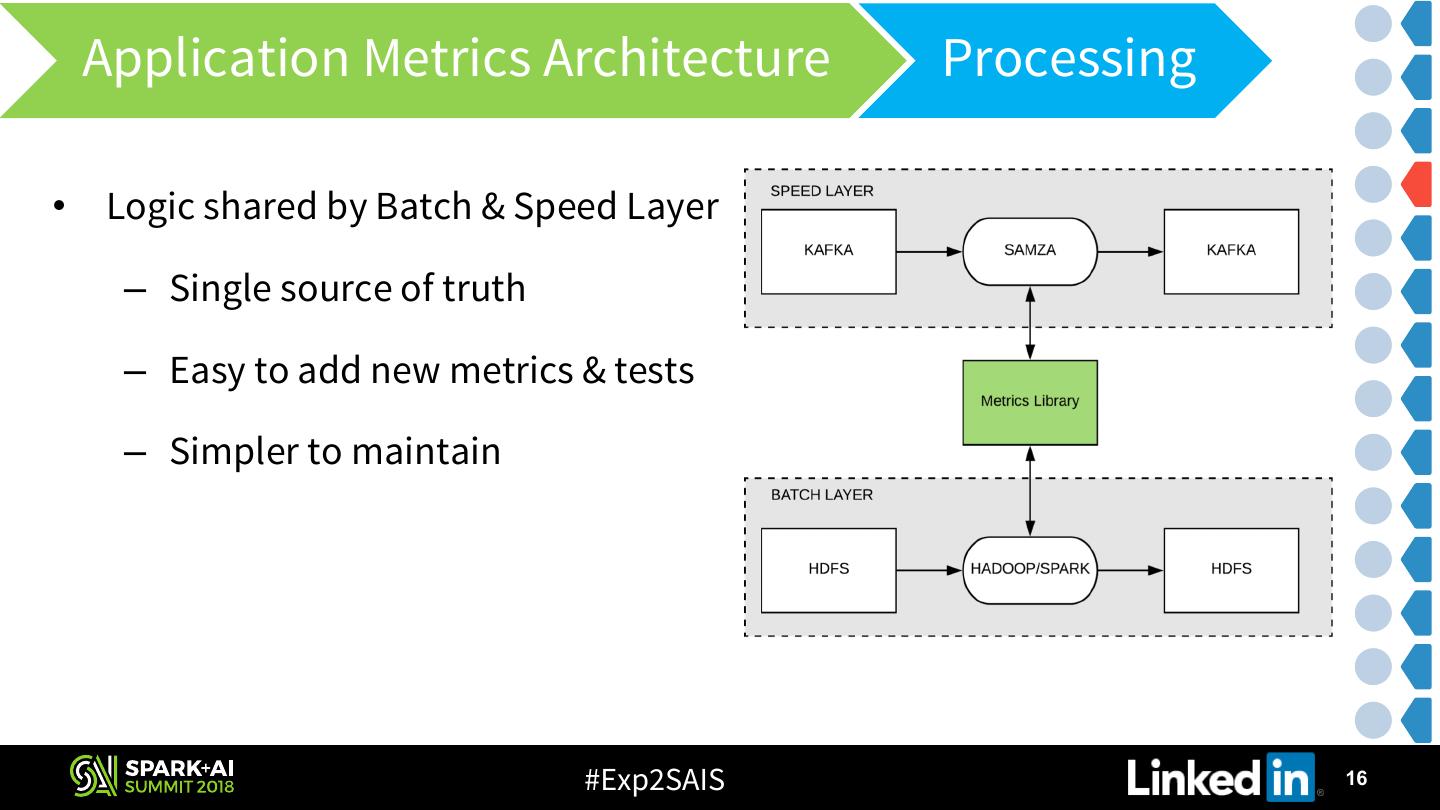
16 . Application Metrics Architecture Processing • Logic shared by Batch & Speed Layer – Single source of truth – Easy to add new metrics & tests – Simpler to maintain #Exp2SAIS 16
17 .Capture Metrics Application Metrics Architecture #Exp2SAIS 17
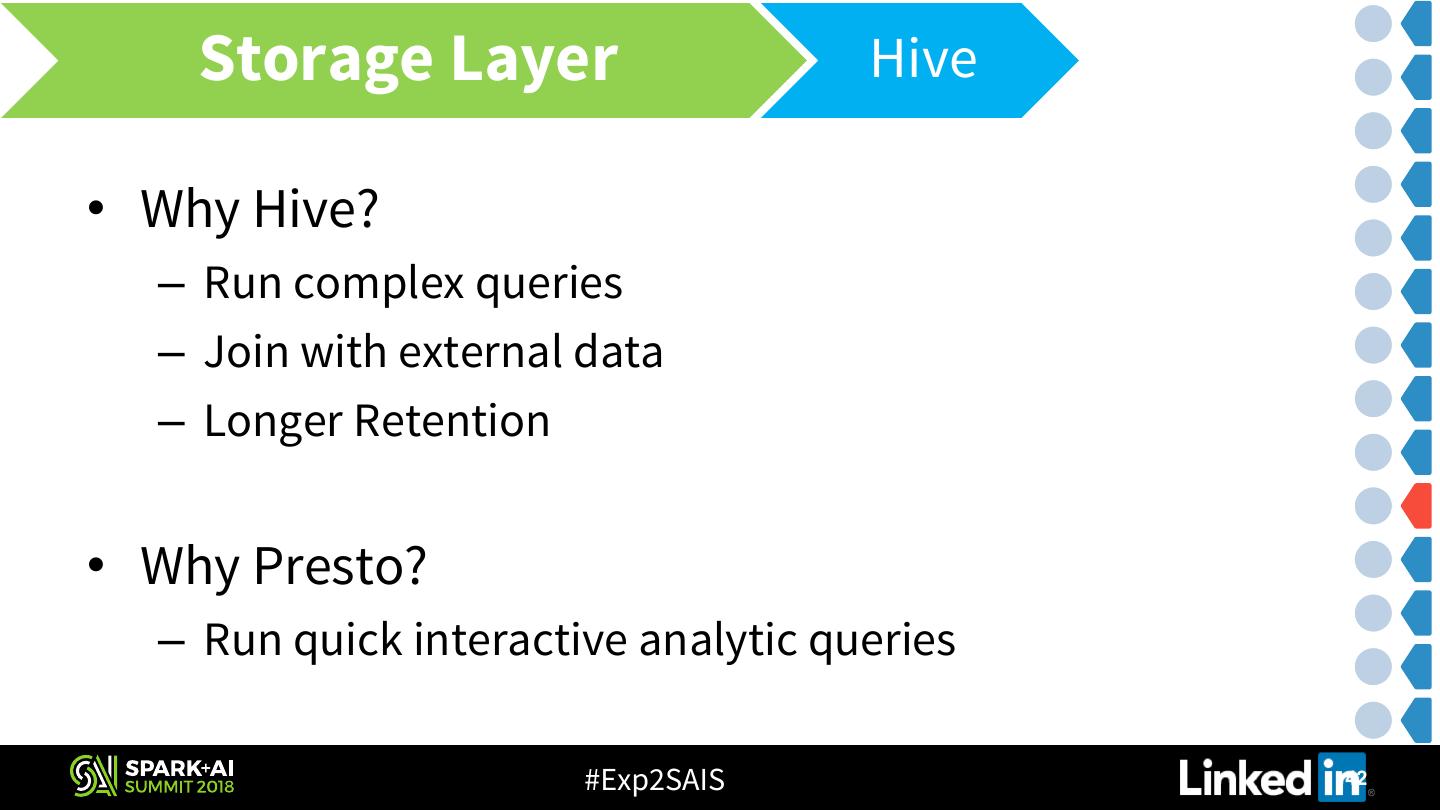
18 .Application Metrics Architecture Storage Query Pattern • Discover patterns and trends in the data • Gain insight into data through fast, consistent, interactive access • Supports selection, aggregation, filtering, group by, order by, distinct queries SELECT job_name, sum(metric_value), <other dimensions> FROM AppSummary WHERE counter_group_name="SPARK_EXECUTOR_METRICS” AND <other clauses> AND daypartition="2018-05-15”; #Exp2SAIS 18
19 .Application Metrics Architecture Storage Pinot • Realtime distributed OLAP datastore; open sourced by LinkedIn • Ingest data from offline & online data sources • Support SQL like query language • In-house expertise; well Integrated with LinkedIn’s infrastructure #Exp2SAIS 19
20 . Application Metrics Architecture Storage Schema • Application, Task, Stage and Job Level Tables • Support addition of arbitrary number of metrics – Dimensions followed by ONE metric per row; columnar compression! – Schema immune to growing metrics app_id status queue start_time finish_time grid … Metric Name Metric Value job_1508278384745_15795287 SUCCEEDED default 1526737272000 1526837272000 default … TOTAL_SHUFFLE_READ 84464656363 job_1508278384745_15795287 SUCCEEDED default 1526737272000 1526837272000 default … TOTAL_SHUFFLE_WRITE 104464656363 … … … … … … … … … job_1508278384745_15795287 SUCCEEDED default 1526737272000 1526837272000 default … RESOURCE_USAGE 3504.98 #Exp2SAIS 20
21 . Operational Intelligence Vision Curated Dashboards Investigate Anomalies Root Cause Analysis Reporting COHERENT OI EXPERIENCE Hadoop & Spark Metrics Anomaly Alerts Events & Metadata #Exp2SAIS 21
22 . Revisit our daily problems Debug issues like slow jobs Track user behavior Generate metric reports for jobs Debug & address global issues Hadoop/Spark Users Platform Developers Setup alerts and monitor flows Capacity Planning Cluster snapshot with slice & dice Generate Cost to Serve Reports Operational Experts Engineering Leads #Exp2SAIS 22
23 .Examples & Use-Cases Curated Dashboard #Exp2SAIS 23
24 . Examples & Use-Cases Debugging a slow job I want to know why my job ran slowly? Hadoop/Spark Users Duration Vs Delay #Exp2SAIS 24
25 .Examples & Use-Cases Debugging a slow job Duration Vs Input Records Root Cause: Job is slow because of a huge influx in the input data #Exp2SAIS 25
26 .Examples & Use-Cases Debugging a slow job Debug why a job ran slowly? #Exp2SAIS 26
27 .Examples & Use-Cases Debugging a slow job Delay Contribution Total Job Duration 50% slower due to delay in AM container allocation #Exp2SAIS 27
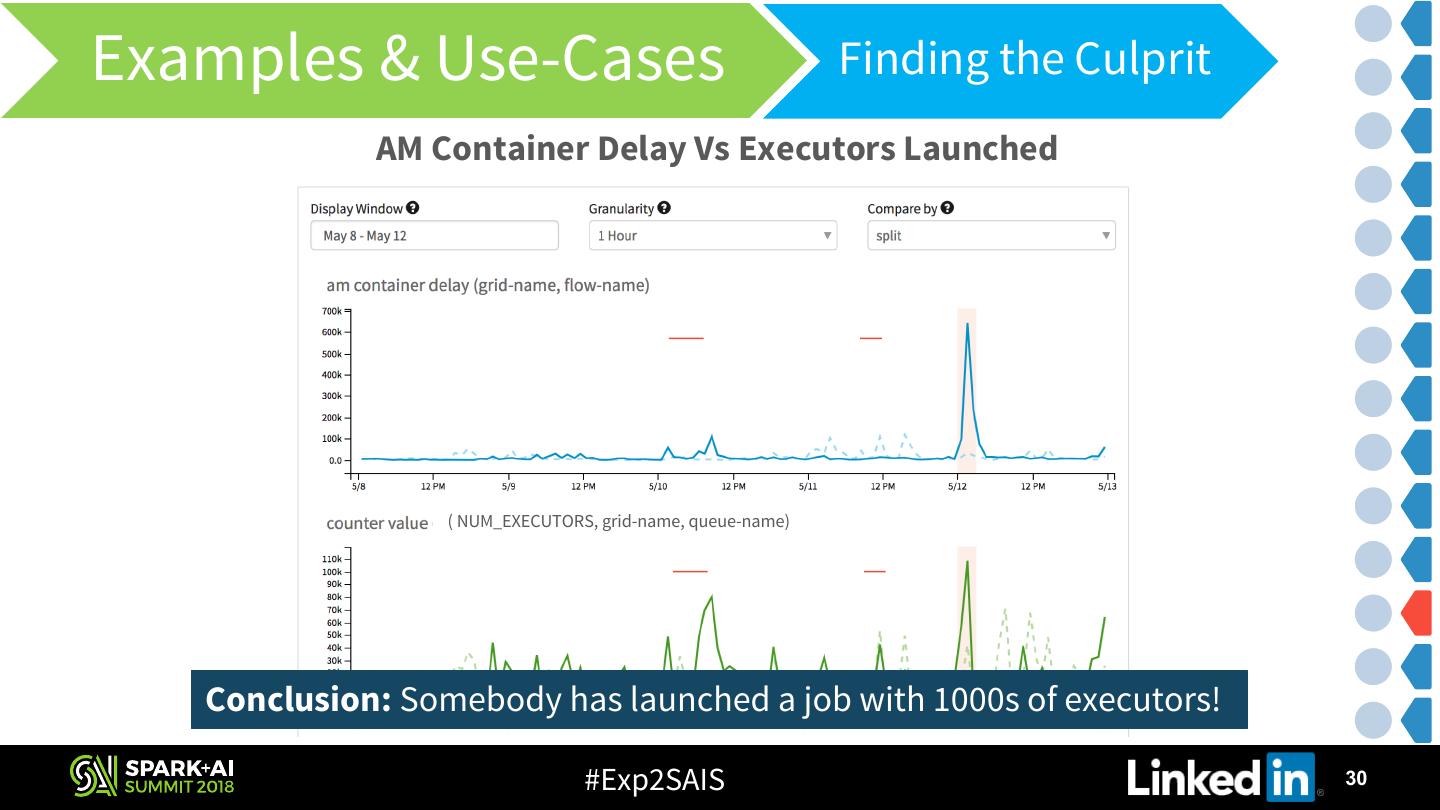
28 . Examples & Use-Cases Finding the Culprit What caused the the delay in Application Master allocation? AM Container Delay for Flow X Platform Developers #Exp2SAIS 28
29 .Examples & Use-Cases Finding the Culprit AM Container Delay Vs Queue Resource Usage Conclusion: Looks like the queue was operating at its peak load #Exp2SAIS 29


