- 快召唤伙伴们来围观吧
- 微博 QQ QQ空间 贴吧
- 文档嵌入链接
- 复制
- 微信扫一扫分享
- 已成功复制到剪贴板
集成电路的内存优化
展开查看详情
1 .Optimizing Power @ Design Time Circuits Dejan Marković Borivoje Nikoli ć
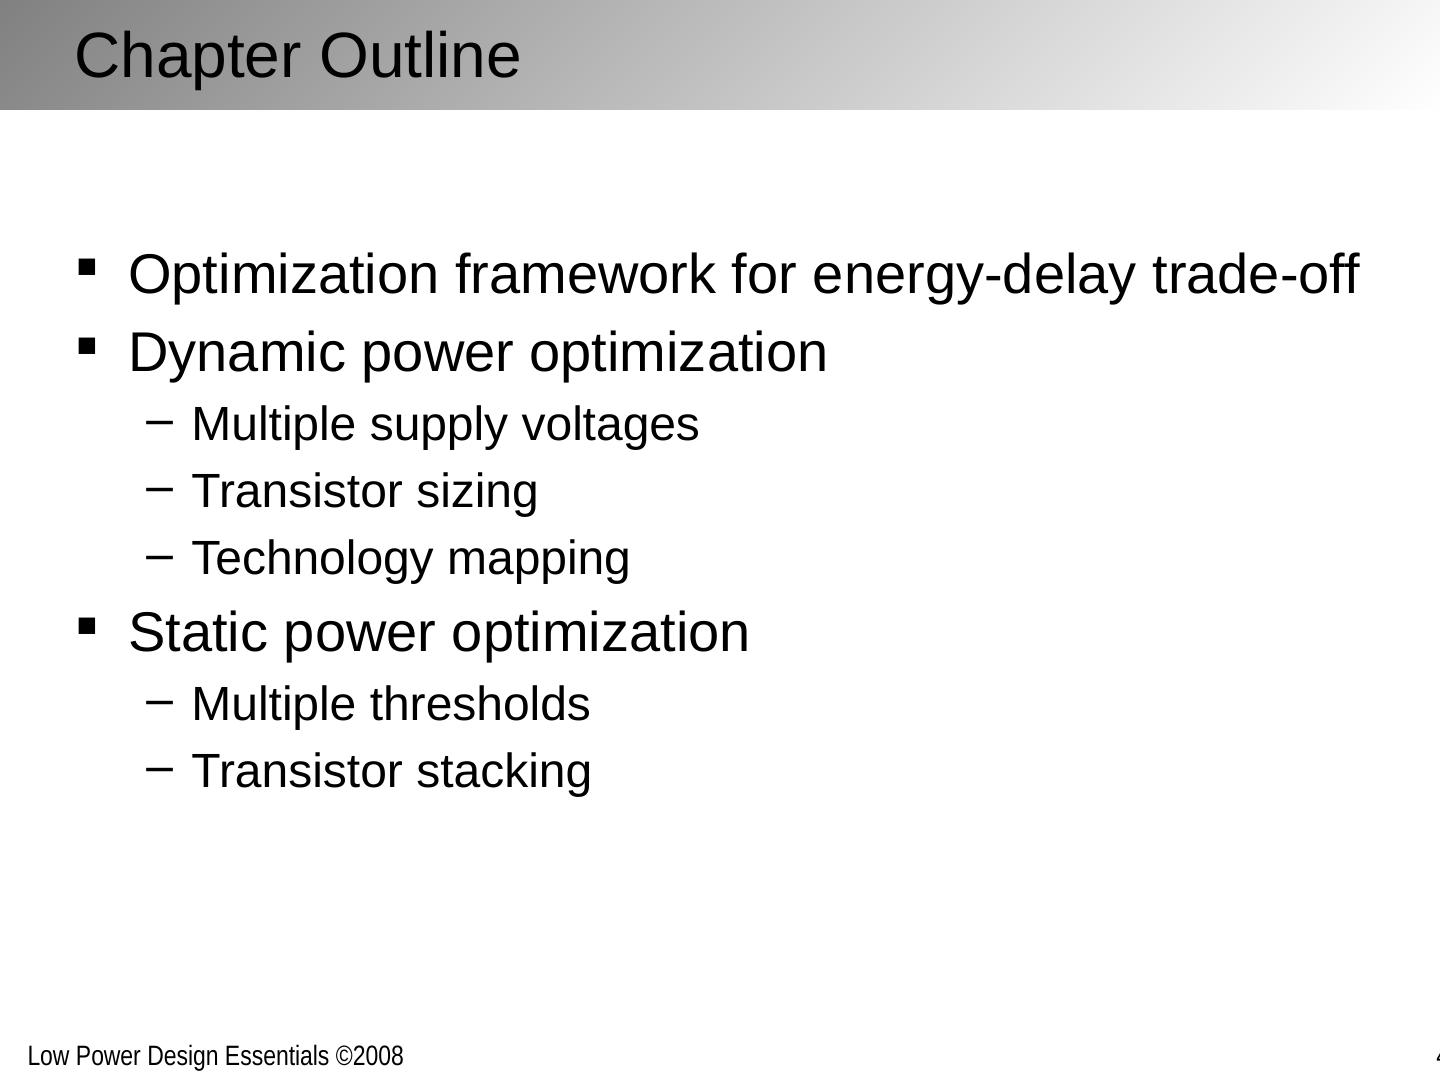
2 .Chapter Outline Optimization framework for energy-delay trade-off Dynamic power optimization Multiple supply voltages Transistor sizing Technology mapping Static power optimization Multiple thresholds Transistor stacking
3 .Energy/Power Optimization Strategy For given function and activity, an optimal operation point can be derived in the energy-performance space Time of optimization depends upon activity profile Different optimizations apply to active and static power Fixed Activity Variable Activity No Activity - Standby Active Design time Run time Sleep Static
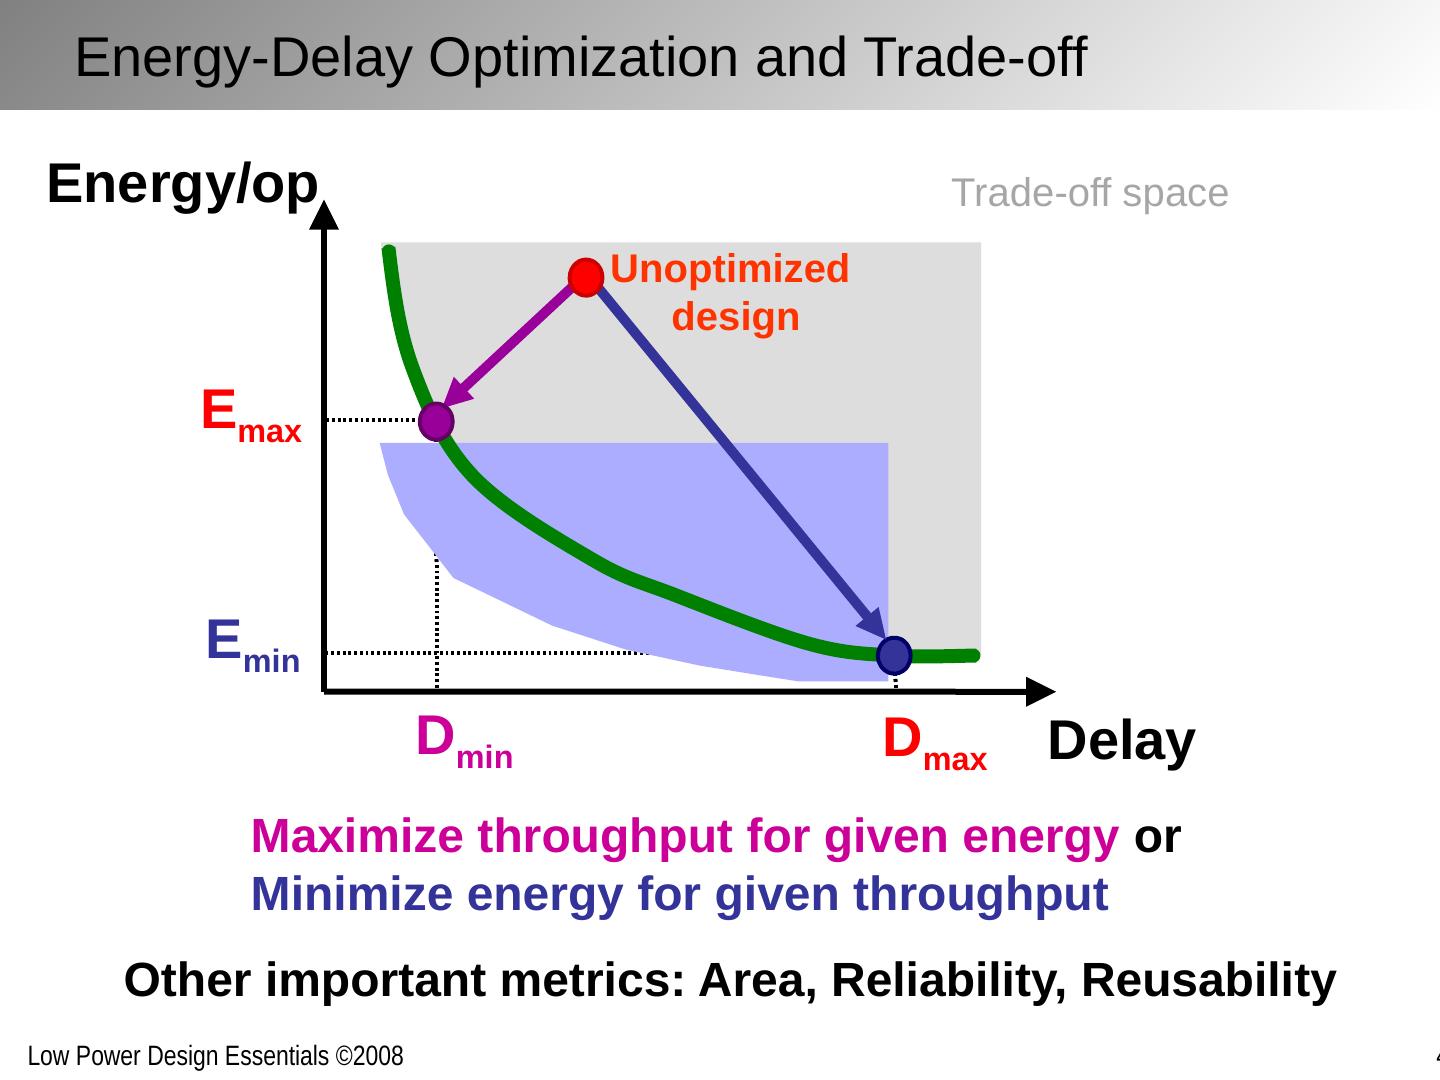
4 .Maximize throughput for given energy or Minimize energy for given throughput Delay Unoptimized design E max D max D min Energy/op E min Energy-Delay Optimization and Trade-off Trade-off space Other important metrics: Area, Reliability, Reusability
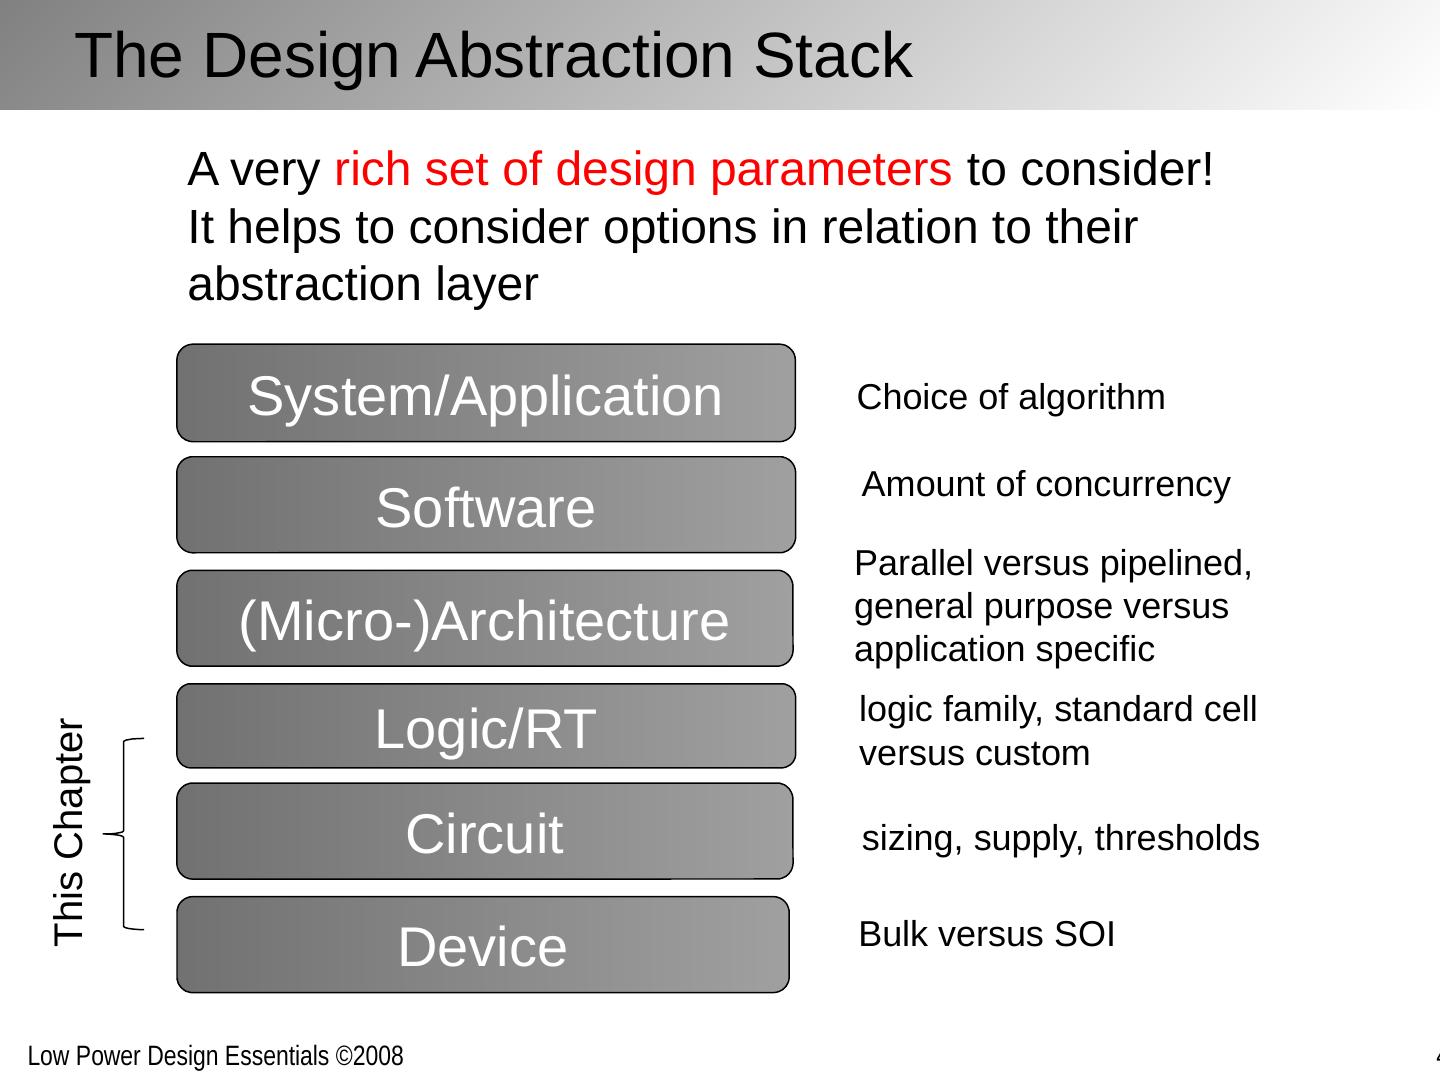
5 .The Design Abstraction Stack Logic/RT (Micro-)Architecture Software Circuit Device System/Application This Chapter A very rich set of design parameters to consider! It helps to consider options in relation to their abstraction layer sizing, supply, thresholds logic family, standard cell versus custom Parallel versus pipelined, general purpose versus application specific Bulk versus SOI Choice of algorithm Amount of concurrency
6 .Architecture Micro-Architecture Circuit (Logic & FFs) Optimization Can/Must Span Multiple Levels Design optimization combines top-down and bottom-up: “meet-in-the-middle”
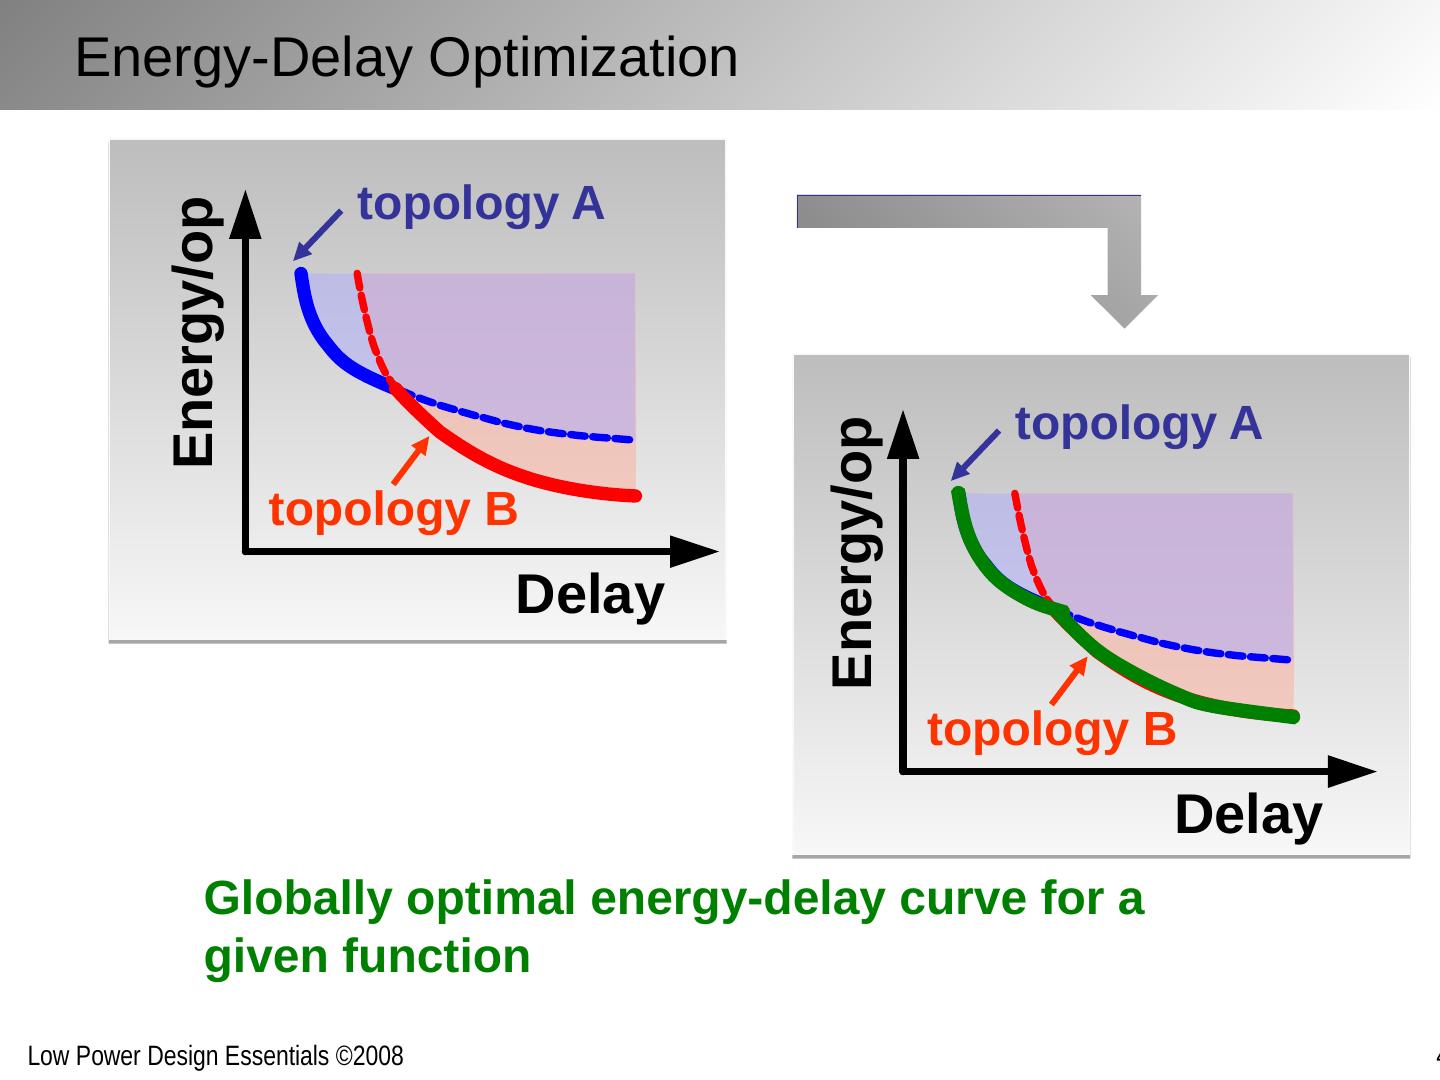
7 .topology A Delay Energy/op Globally optimal energy-delay curve for a given function Energy-Delay Optimization topology B topology A topology B Delay Energy/op
8 .Some Optimization Observations ∂ E / ∂A ∂ D / ∂A A=A 0 S A = S B S A f (A 0 ,B) f (A,B 0 ) Delay Energy D 0 (A 0 ,B 0 ) Energy-Delay Sensitivities [Ref: V. Stojanovic , ESSCIRC’02 ]
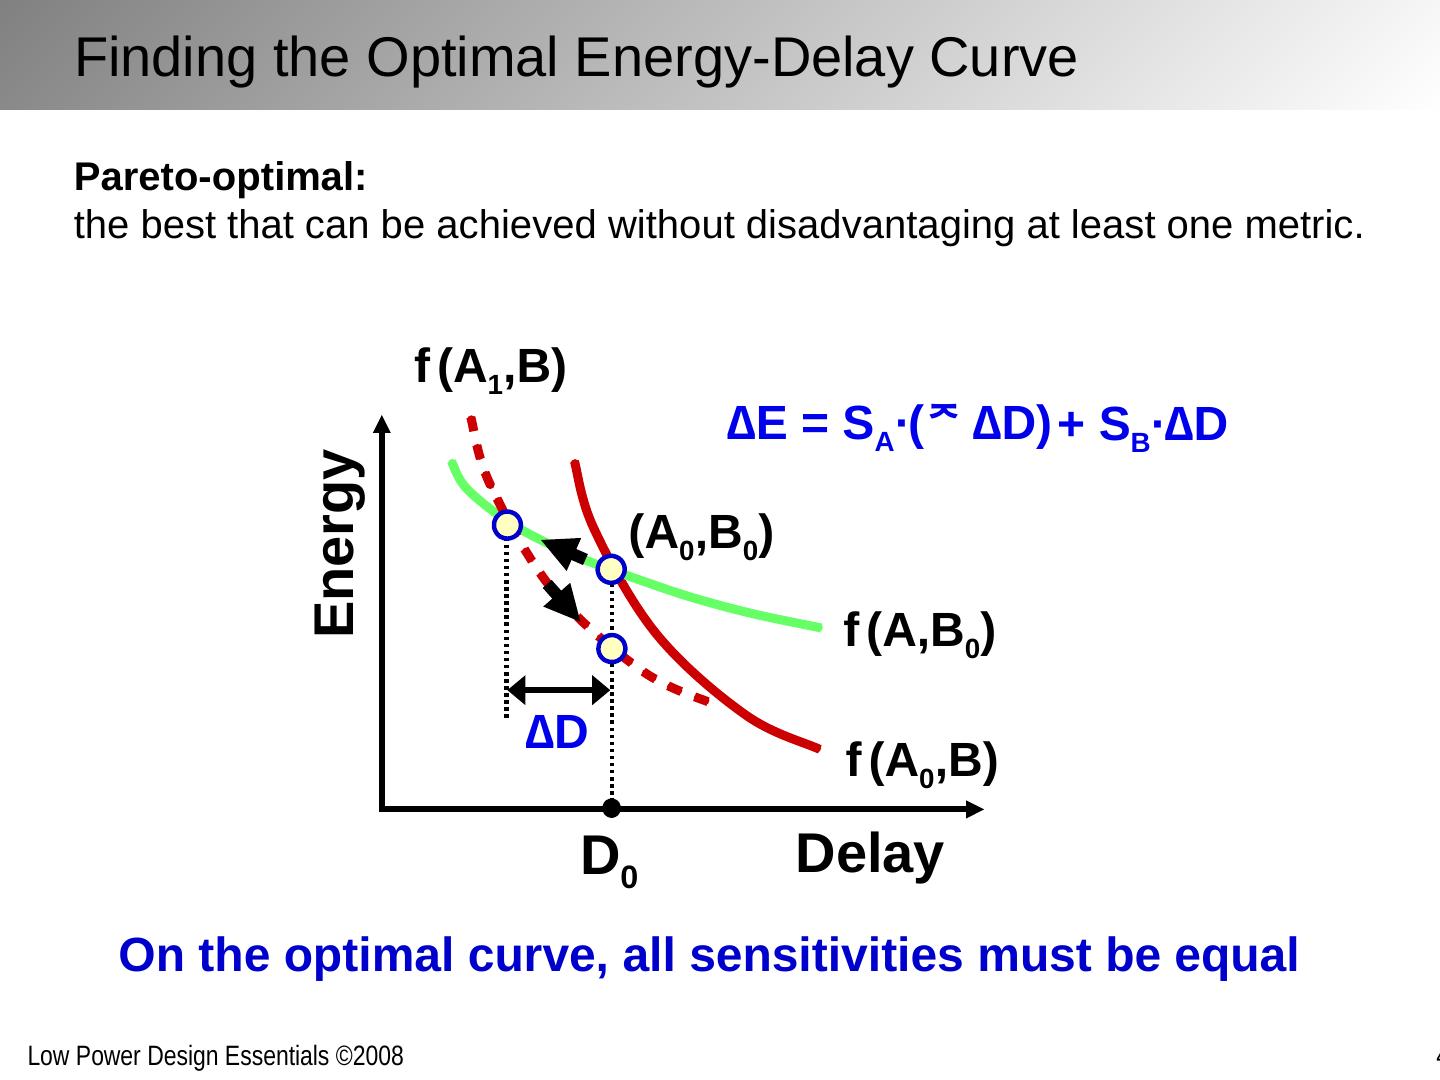
9 .∆E = S A ∙( ∆D ) + S B ∙ ∆D On the optimal curve, all sensitivities must be equal Finding the Optimal Energy-Delay Curve f (A 0 ,B) f (A,B 0 ) Delay Energy D 0 (A 0 ,B 0 ) ∆D f (A 1 ,B) Pareto-optimal: the best that can be achieved without disadvantaging at least one metric.
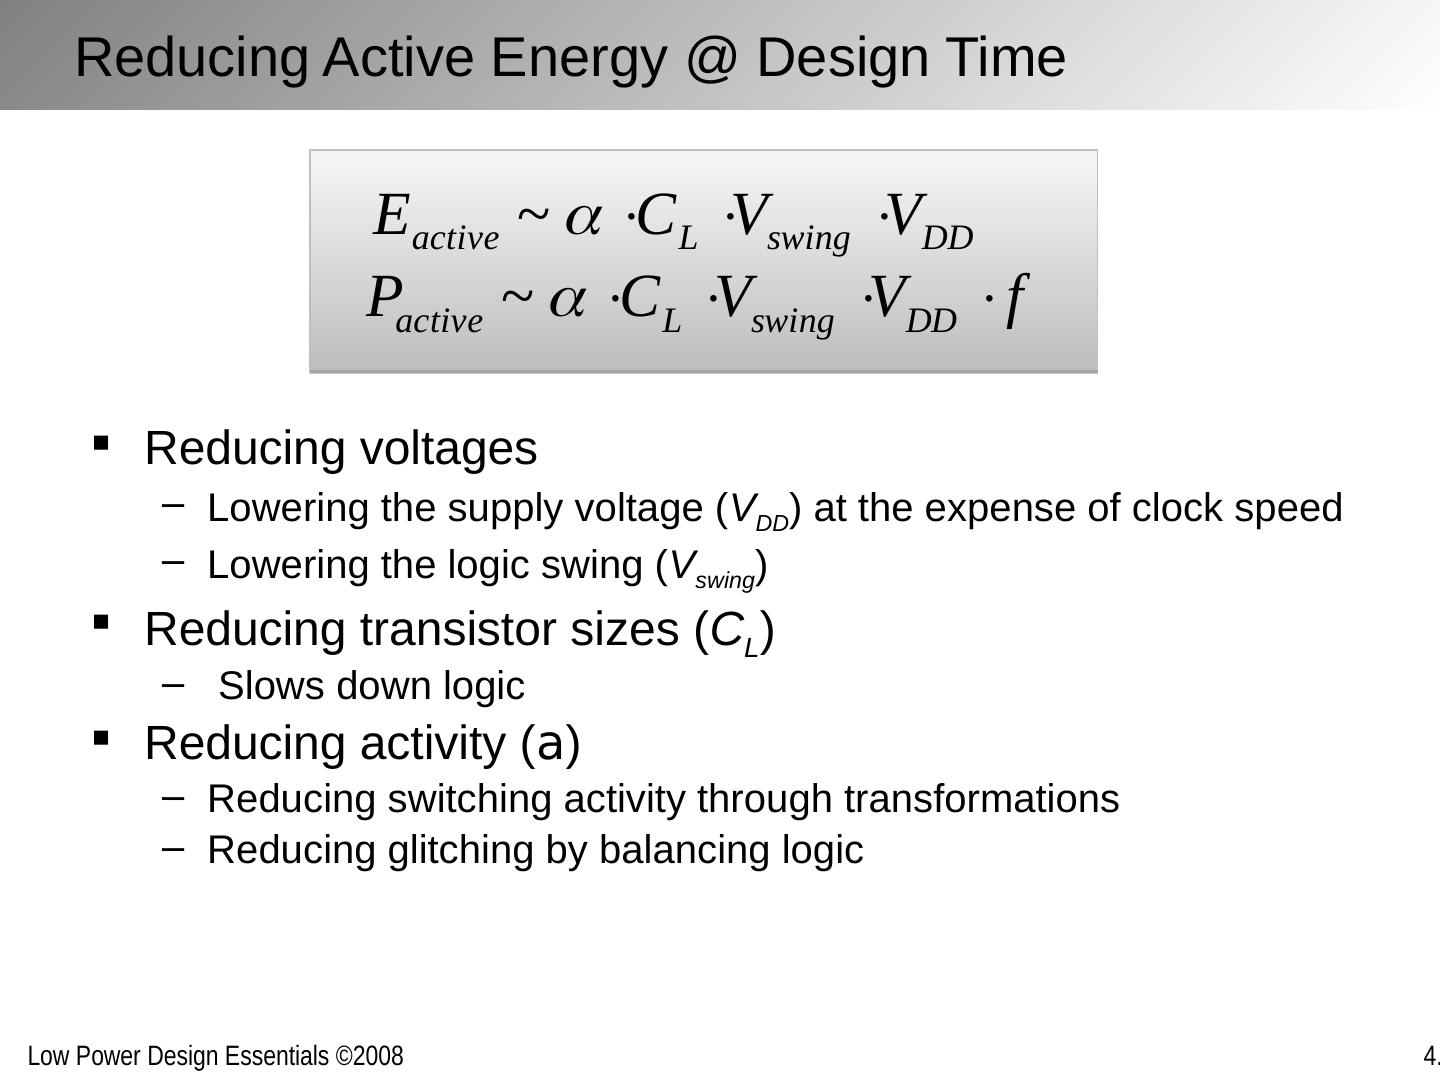
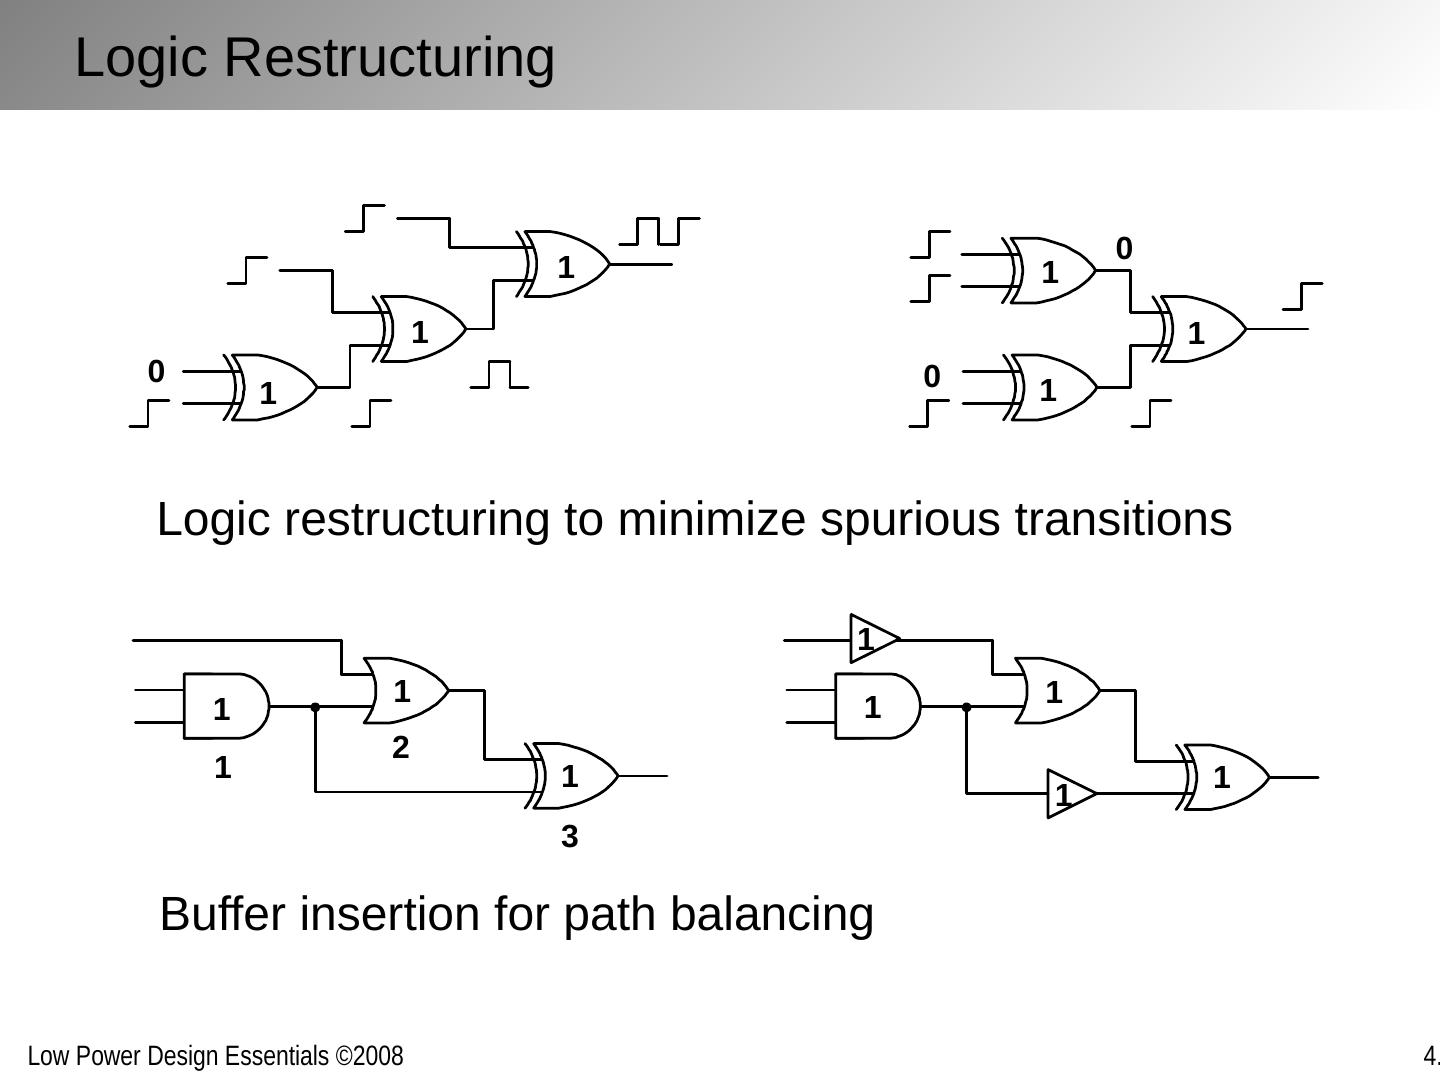
10 .Reducing voltages Lowering the supply voltage ( V DD ) at the expense of clock speed Lowering the logic swing ( V swing ) Reducing transistor sizes ( C L ) Slows down logic Reducing activity ( a ) Reducing switching activity through transformations Reducing glitching by balancing logic Reducing Active Energy @ Design Time
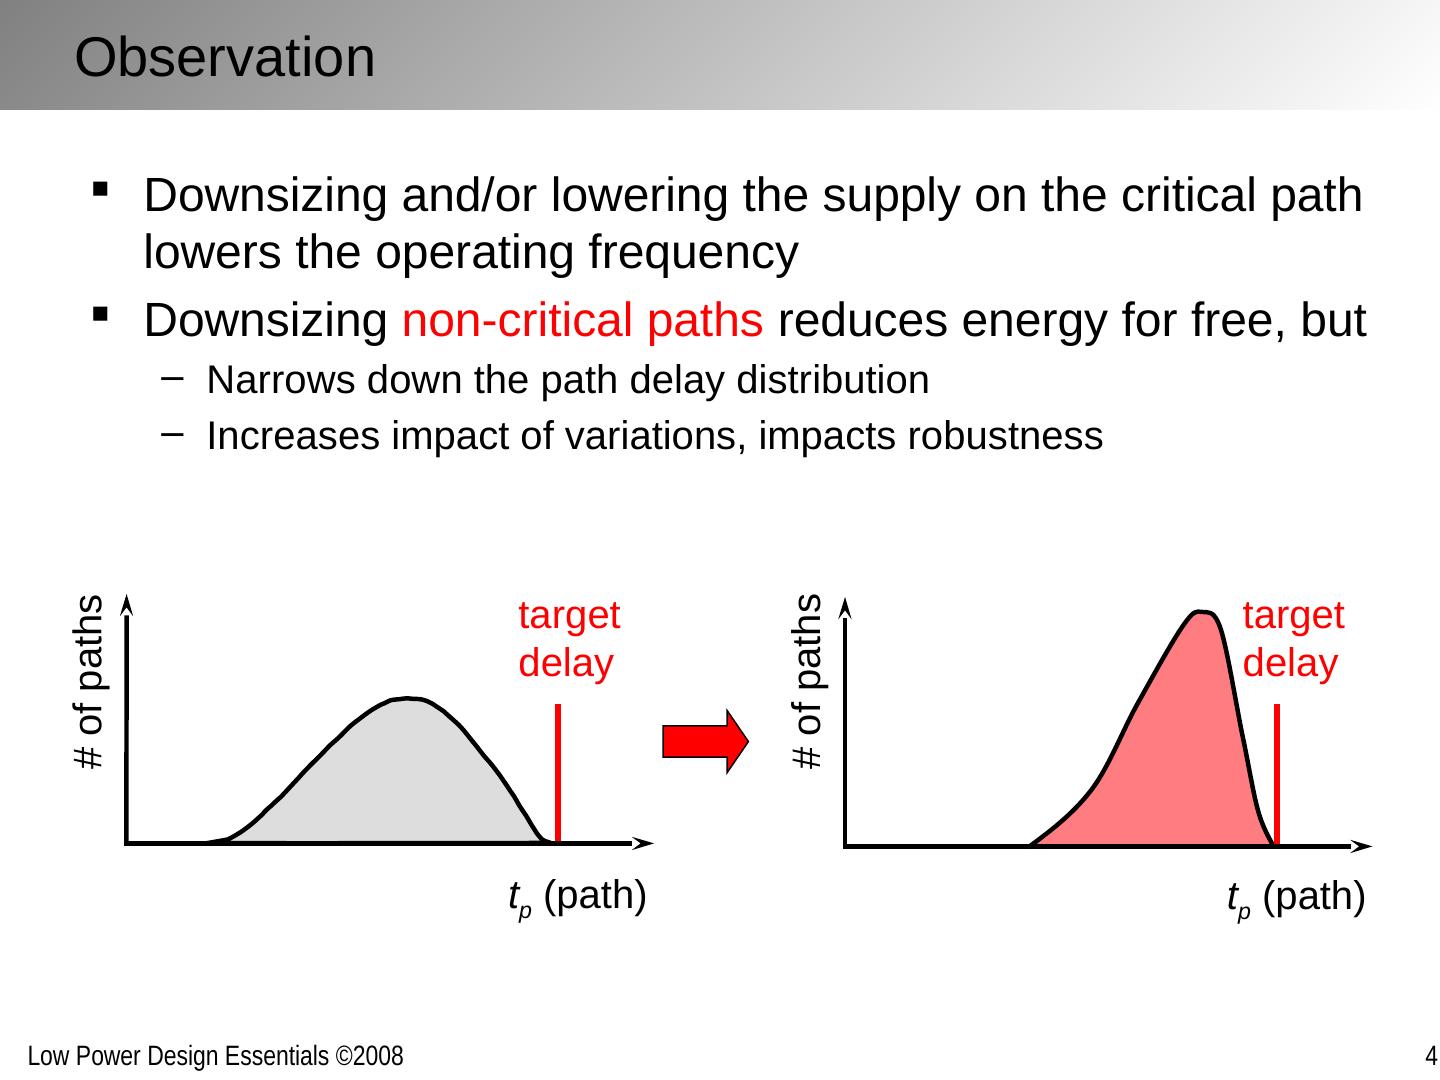
11 .Downsizing and/or lowering the supply on the critical path lowers the operating frequency Downsizing non-critical paths reduces energy for free, but Narrows down the path delay distribution Increases impact of variations, impacts robustness t p (path) # of paths target delay t p (path) # of paths target delay Observation
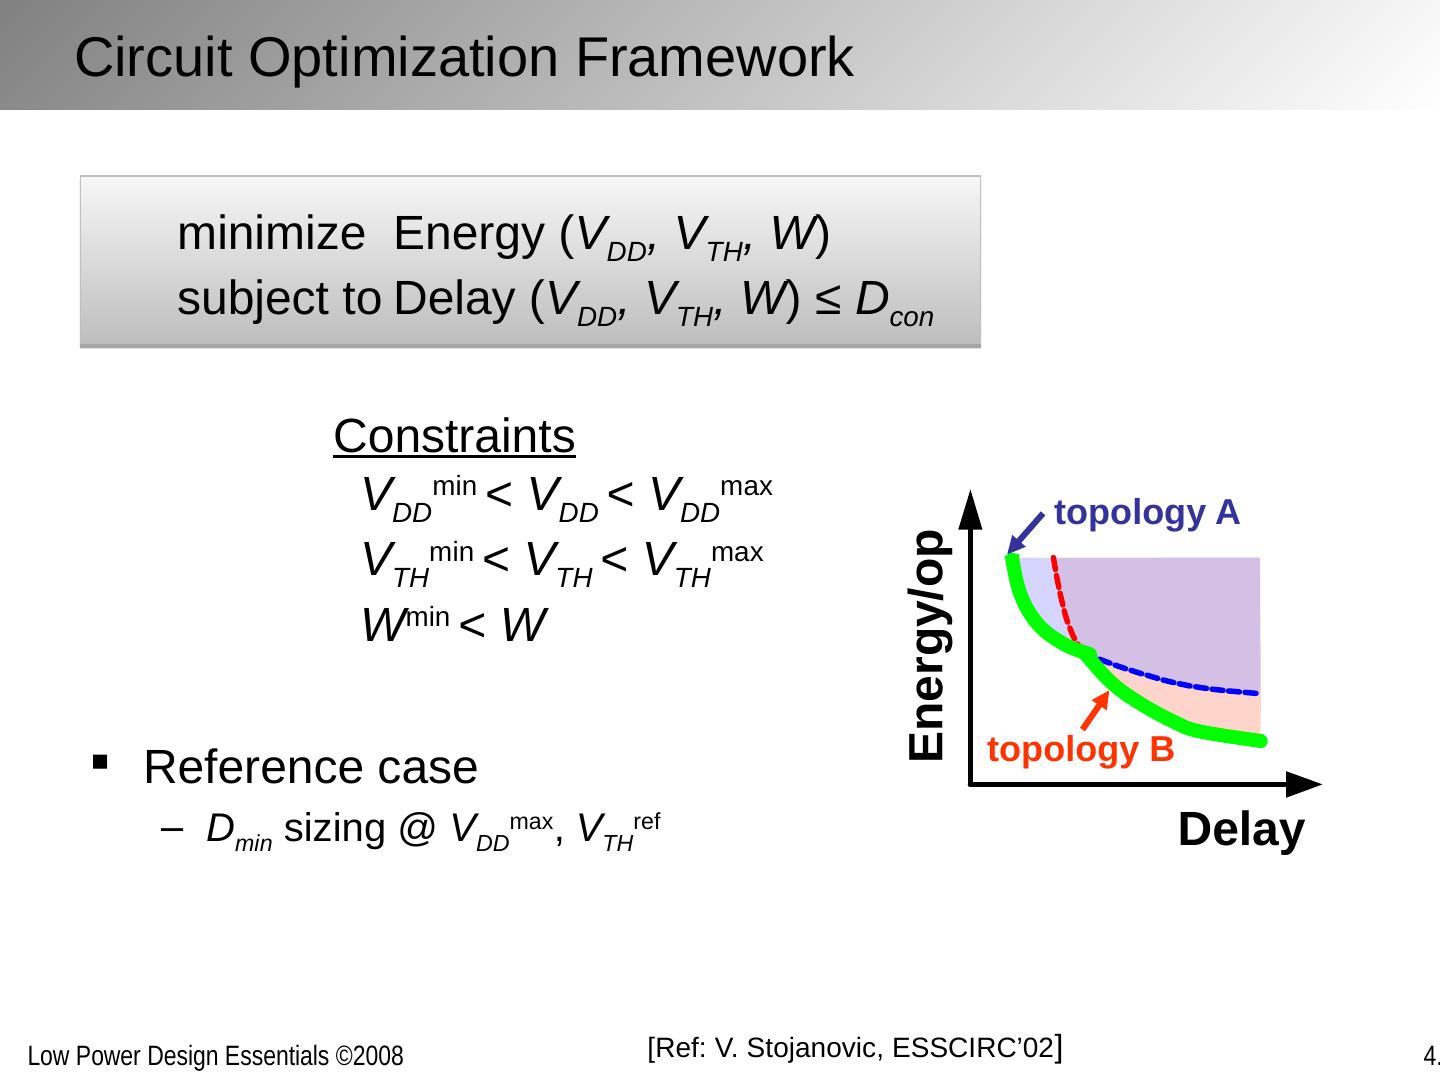
12 .topology A topology B Delay Energy/op Reference case D min sizing @ V DD max , V TH ref minimize Energy ( V DD , V TH , W ) subject to Delay ( V DD , V TH , W ) ≤ D con Constraints V DD min < V DD < V DD max V TH min < V TH < V TH max W min < W Circuit Optimization Framework [Ref: V. Stojanovic , ESSCIRC’02 ]
13 .i i+1 C w g C i C i C i+1 Optimization Framework: Generic Network V DD,i+1 V DD,i Gate in stage i loaded by fanout (stage i +1)
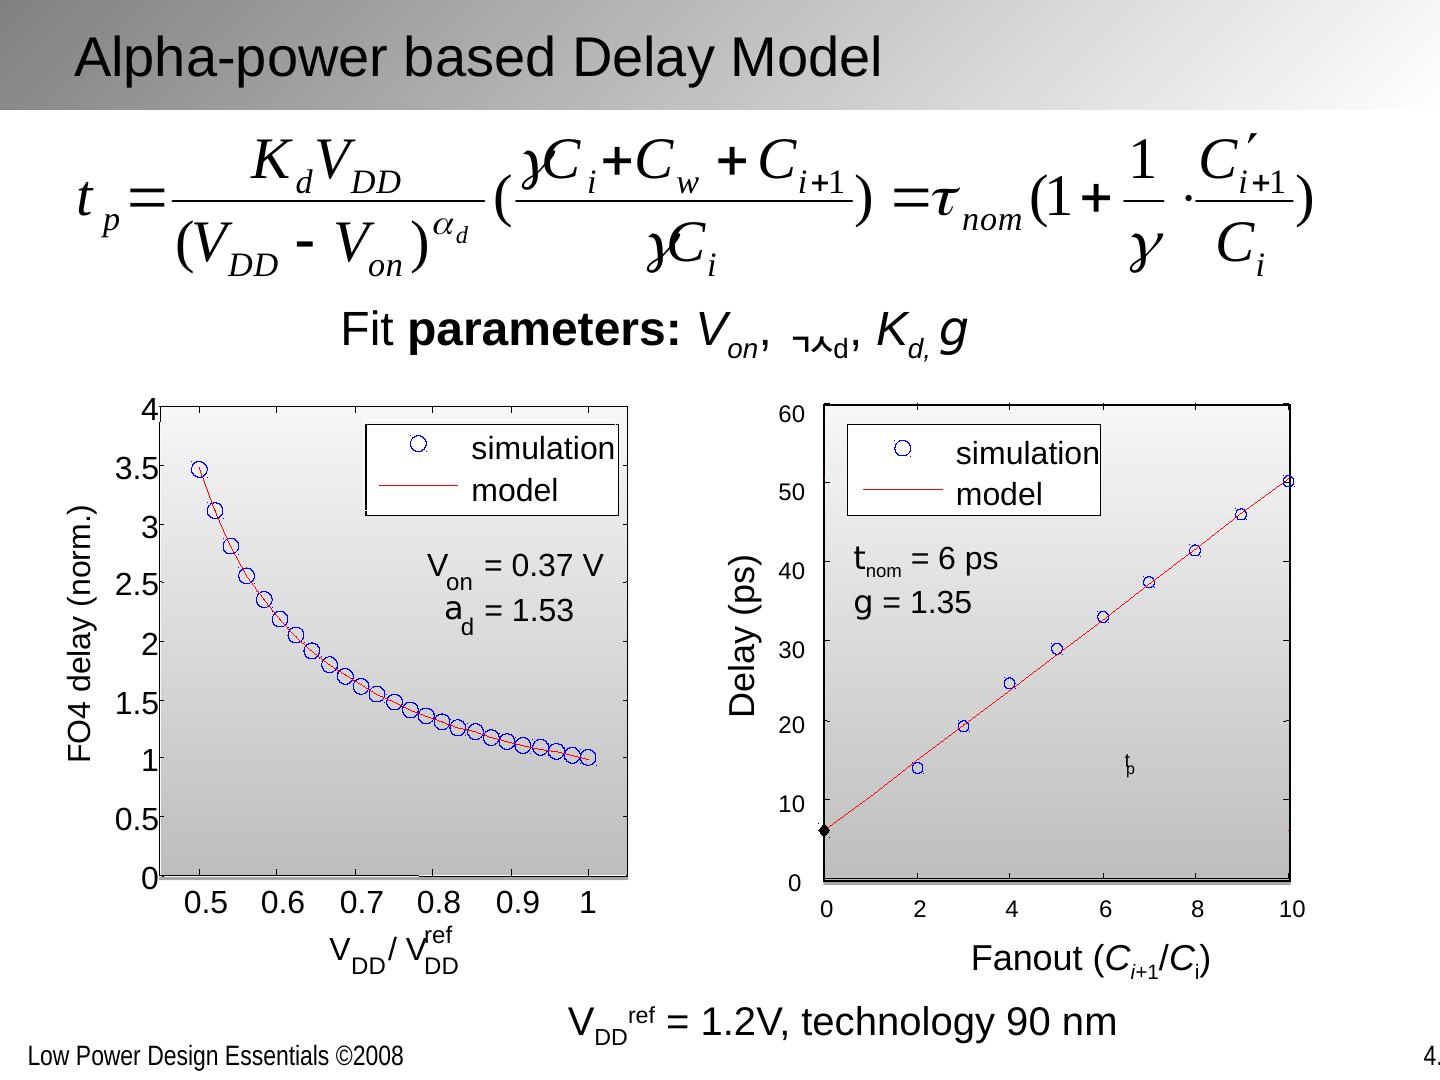
14 .Fit parameters: V on , d , K d, g Alpha-power based Delay Model V DD ref = 1.2V, technology 90 nm (90nm technology) 0 2 4 6 8 10 0 10 20 30 40 50 60 Fanout ( C i+ 1 / C i ) Delay (ps) t p 0.5 0.6 0.7 0.8 0.9 1 0 0.5 1 1.5 2 2.5 3 3.5 4 V DD / V DD ref FO4 delay (norm.) V on = 0.37 V a d = 1.53 simulation model t nom = 6 ps g = 1.35 simulation model
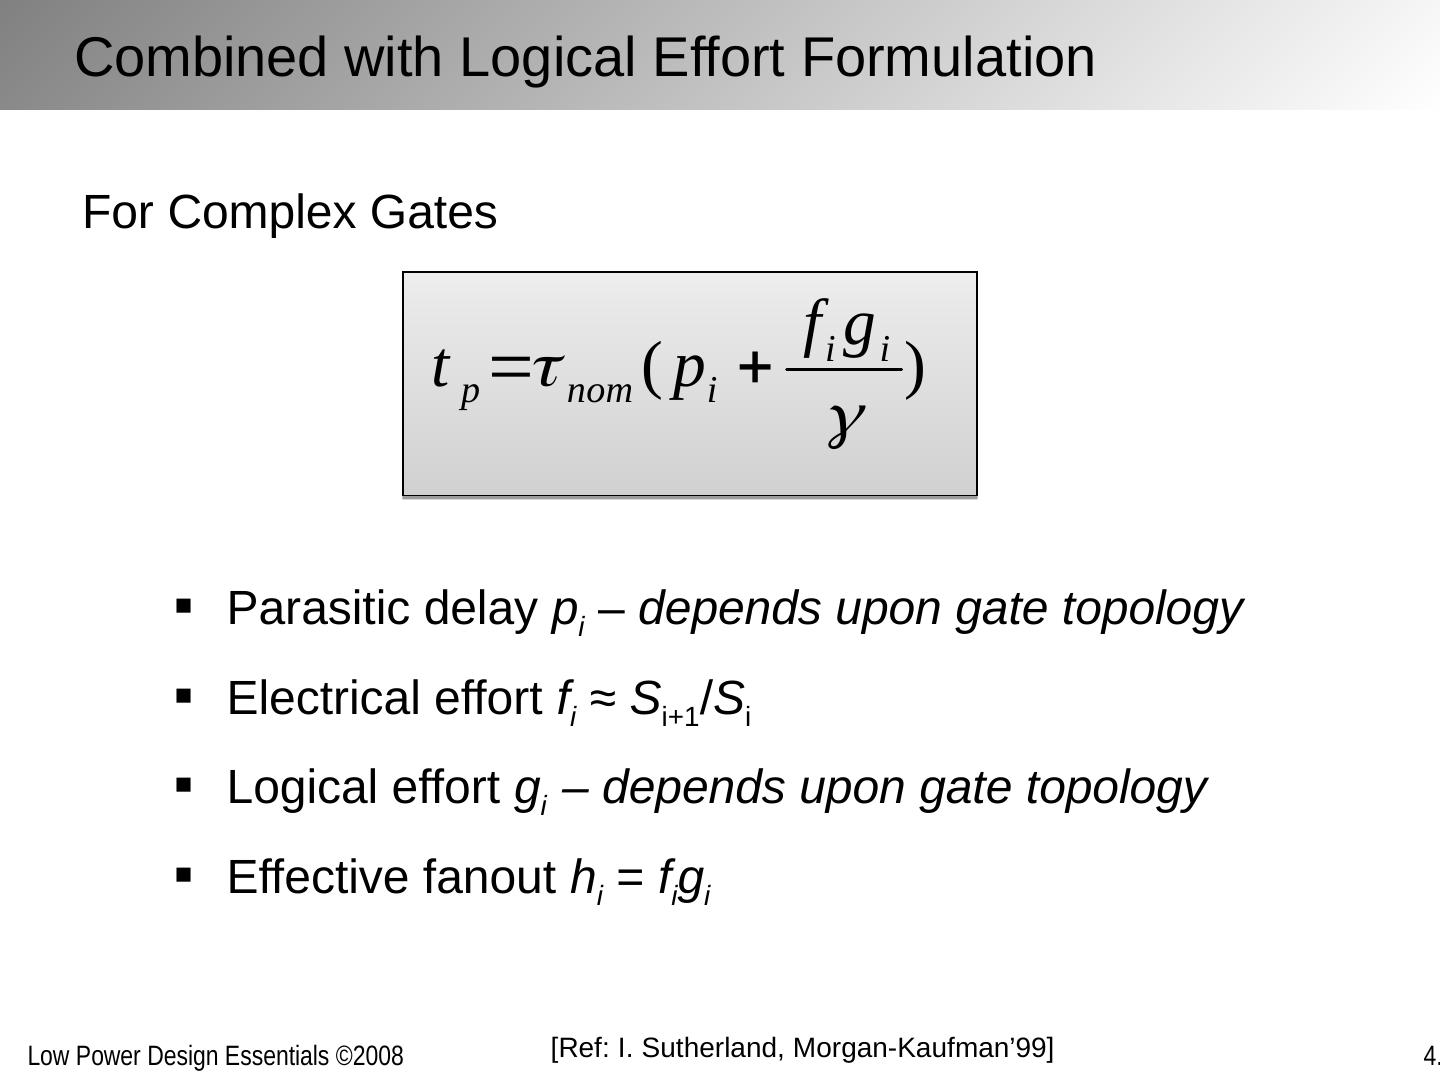
15 .Parasitic delay p i – depends upon gate topology Electrical effort f i ≈ S i+1 / S i Logical effort g i – depends upon gate topology Effective fanout h i = f i g i For Complex Gates [Ref: I. Sutherland, Morgan-Kaufman’99 ] Combined with Logical Effort Formulation
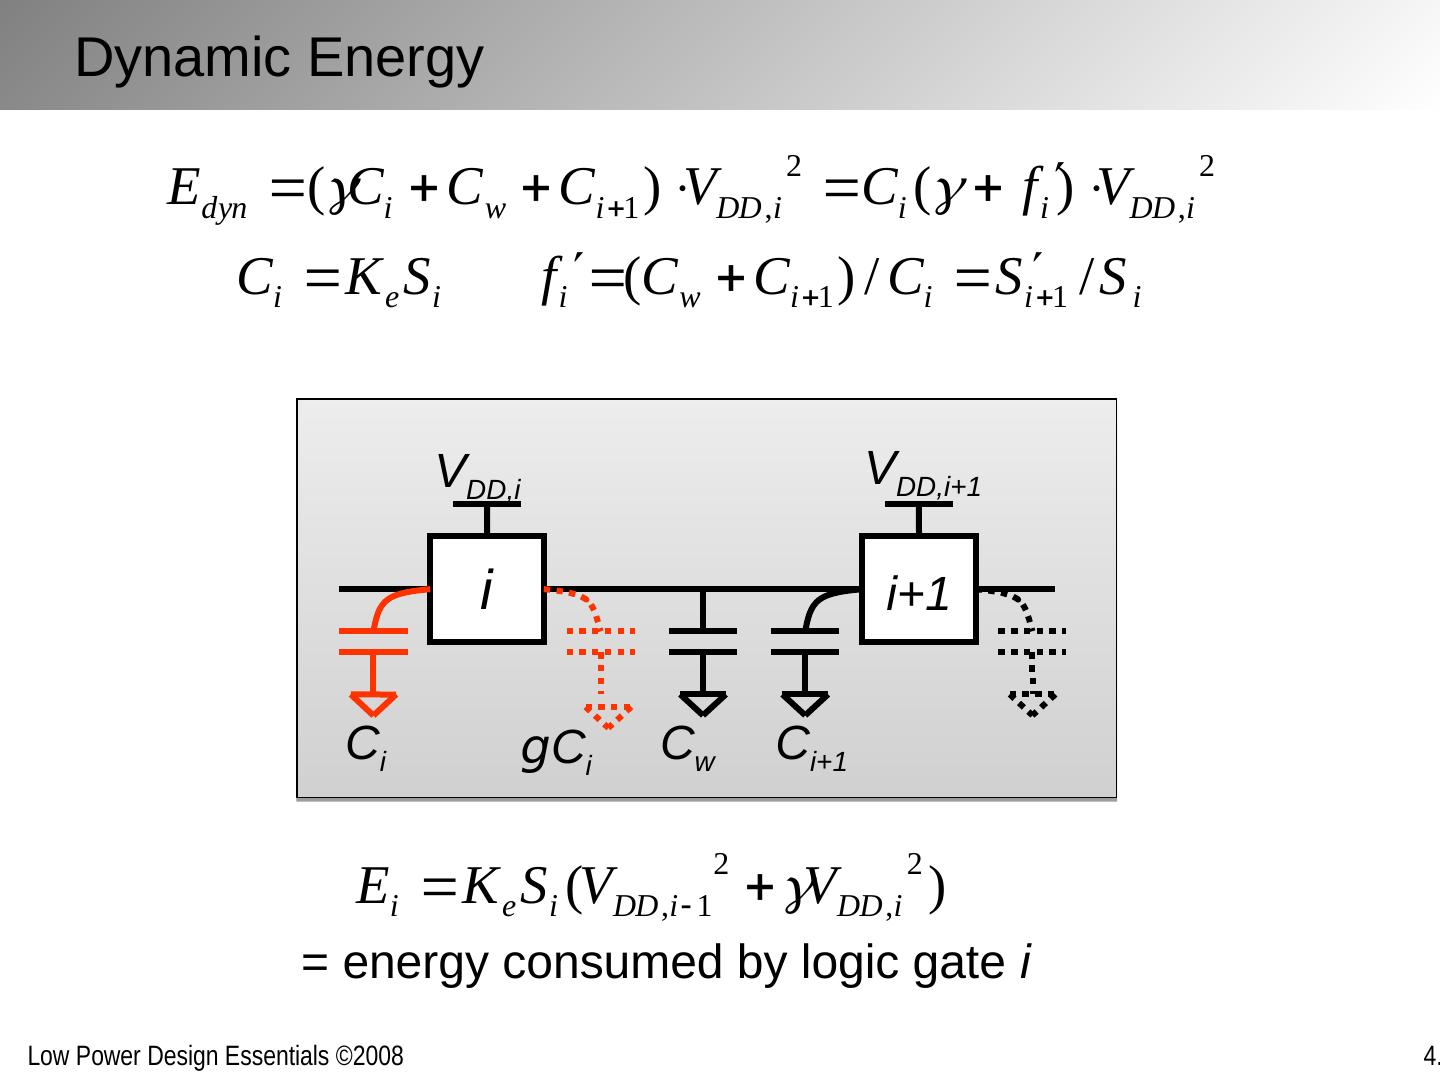
16 .= energy consumed by logic gate i Dynamic Energy i i+1 C w g C i C i C i+1 V DD,i+1 V DD,i
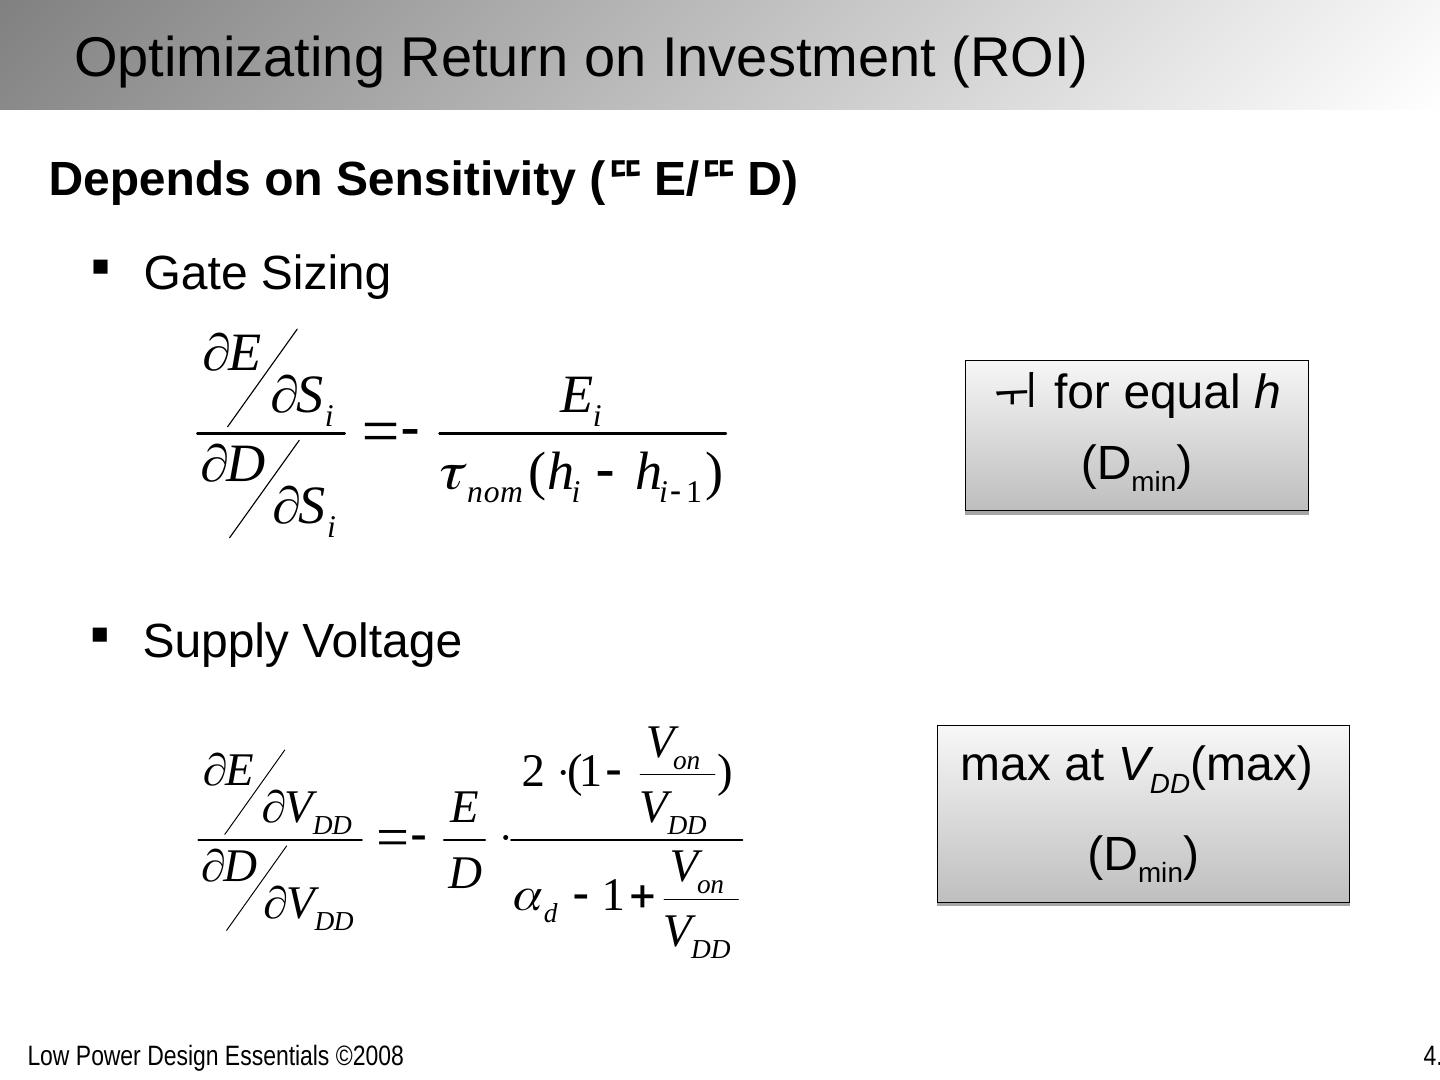
17 . for equal h (D min ) max at V DD (max) (D min ) Depends on Sensitivity ( E/ D) Optimizating Return on Investment (ROI) Gate Sizing Supply Voltage
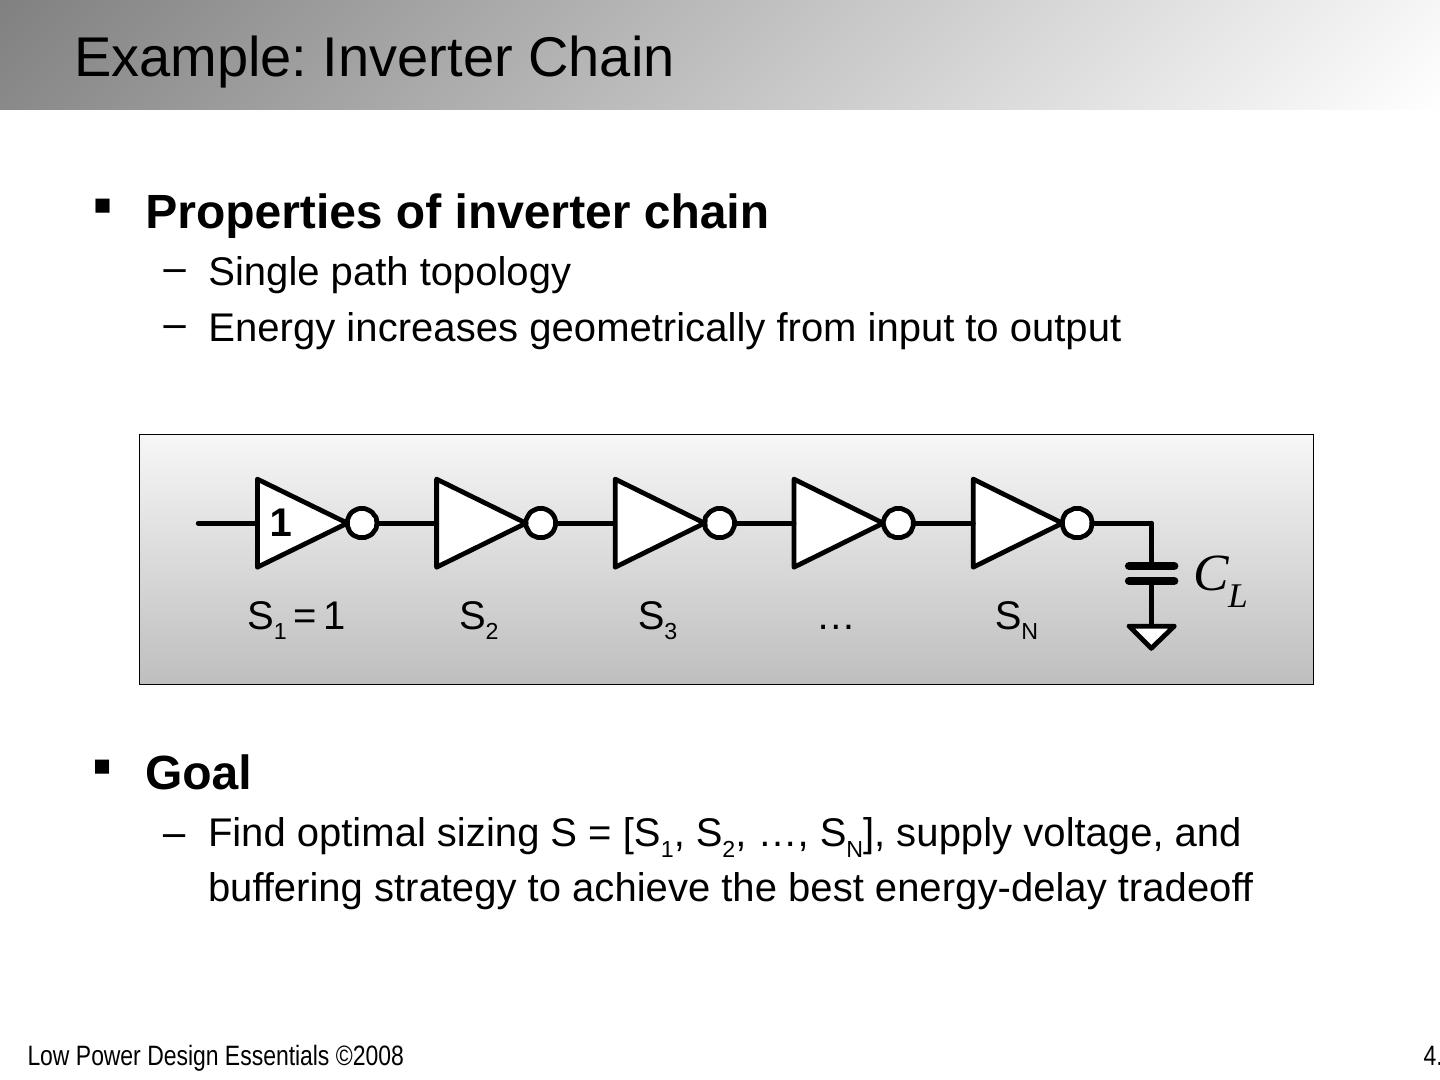
18 .Properties of inverter chain Single path topology Energy increases geometrically from input to output Example: Inverter Chain 1 S 1 = 1 S 2 … S N S 3 Goal Find optimal sizing S = [S 1 , S 2 , …, S N ], supply voltage, and buffering strategy to achieve the best energy-delay tradeoff
19 .Variable taper achieves minimum energy Reduce number of stages at large d inc [Ref: Ma, JSSC’94 ] Inverter Chain: Gate Sizing 1 2 3 4 5 6 7 0 5 10 15 20 25 stage effective fanout, h 0% 1% 10% 30% d inc = 50% nom opt
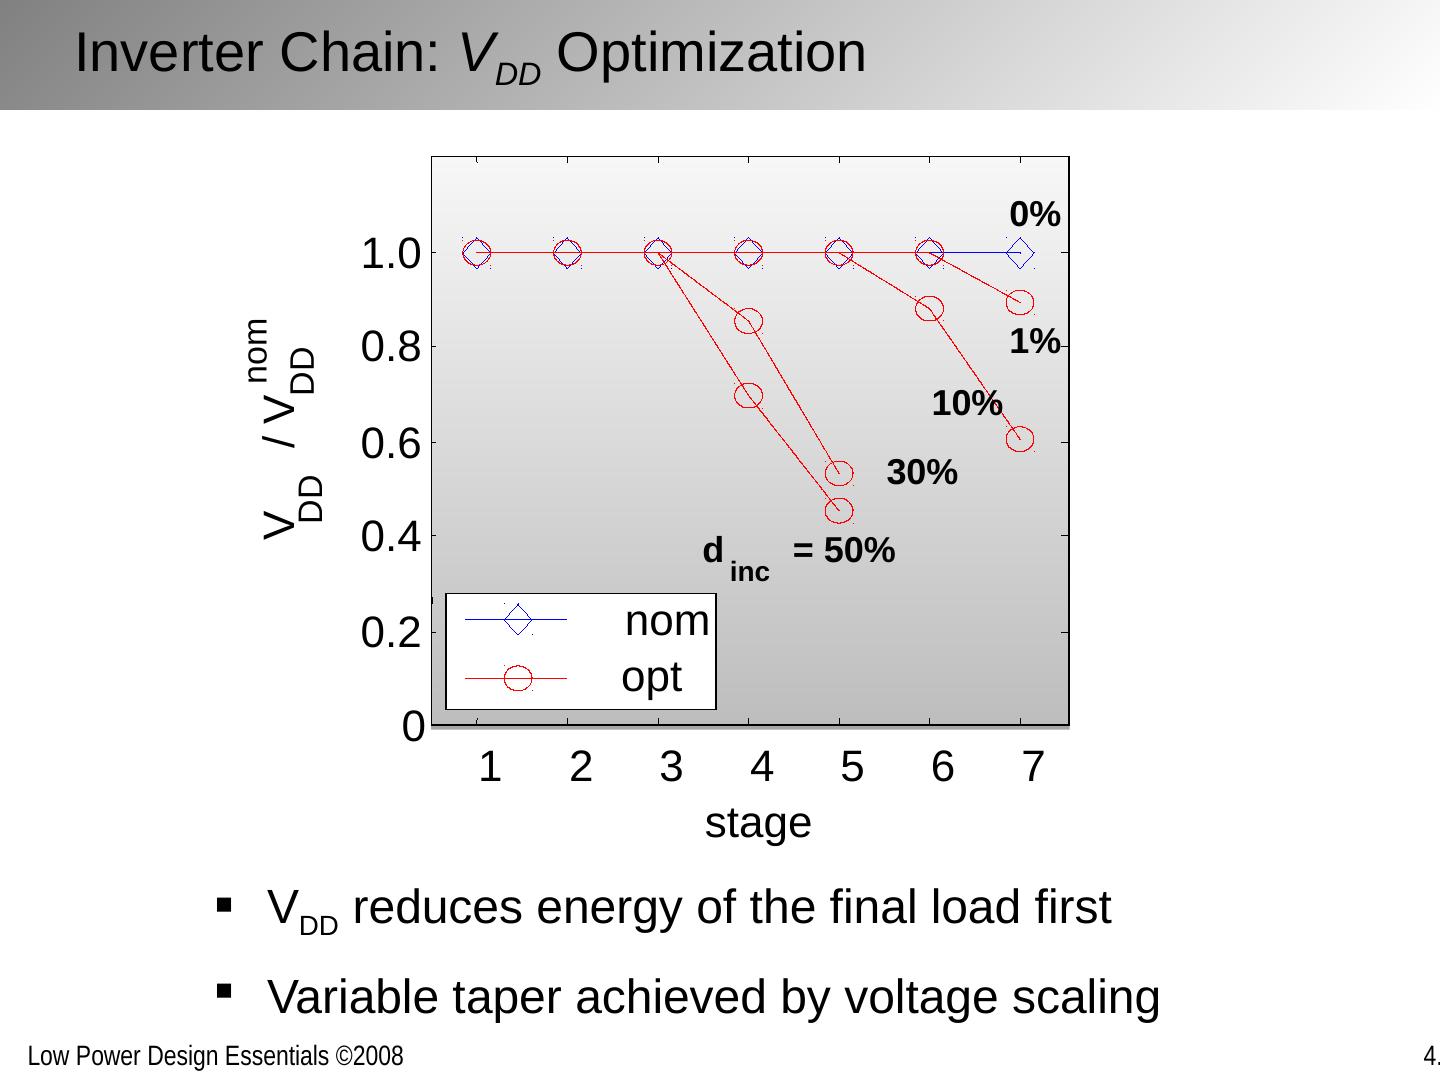
20 .V DD reduces energy of the final load first Variable taper achieved by voltage scaling Inverter Chain: V DD Optimization 1 2 3 4 5 6 7 0 0.2 0.4 0.6 0.8 1.0 stage V DD / V DD nom 0% 1% 10% 30% d inc = 50% nom opt
21 .Parameter with the largest sensitivity has the largest potential for energy reduction Two discrete supplies mimic per-stage V DD Inverter Chain: Optimization Results 50 inc 0 10 20 30 40 0 20 40 60 80 100 d (%) energy reduction (%) 0 10 20 30 40 50 0 0.2 0.4 0.6 0.8 1.0 d inc (%) Sensitivity (norm) cV DD S gV DD 2V DD
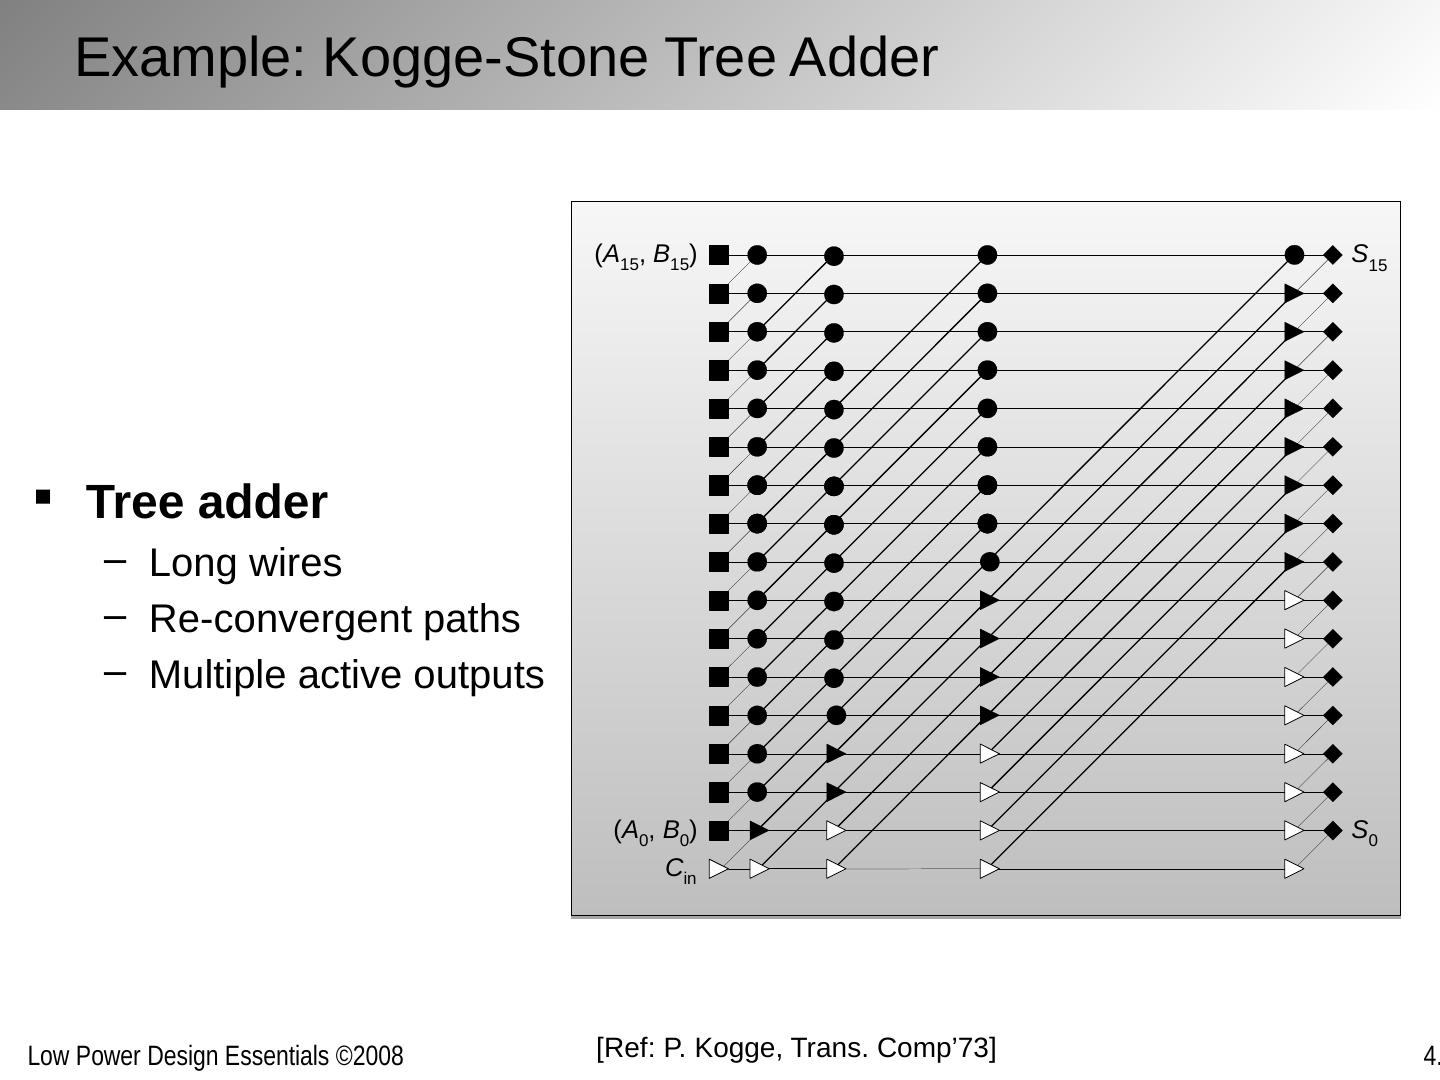
22 .Tree adder Long wires Re-convergent paths Multiple active outputs Example: Kogge-Stone Tree Adder [ Ref: P. Kogge , Trans. Comp’73]
23 .sizing: E (-54%) d inc =10% reference D=D min 2V dd : E (-27%) d inc =10% Tree Adder: Sizing vs. Dual-V DD Optimization Reference design: all paths are critical Internal energy S more effective than V DD S: E(-54%), 2V dd : E(-27%) at d inc = 10%
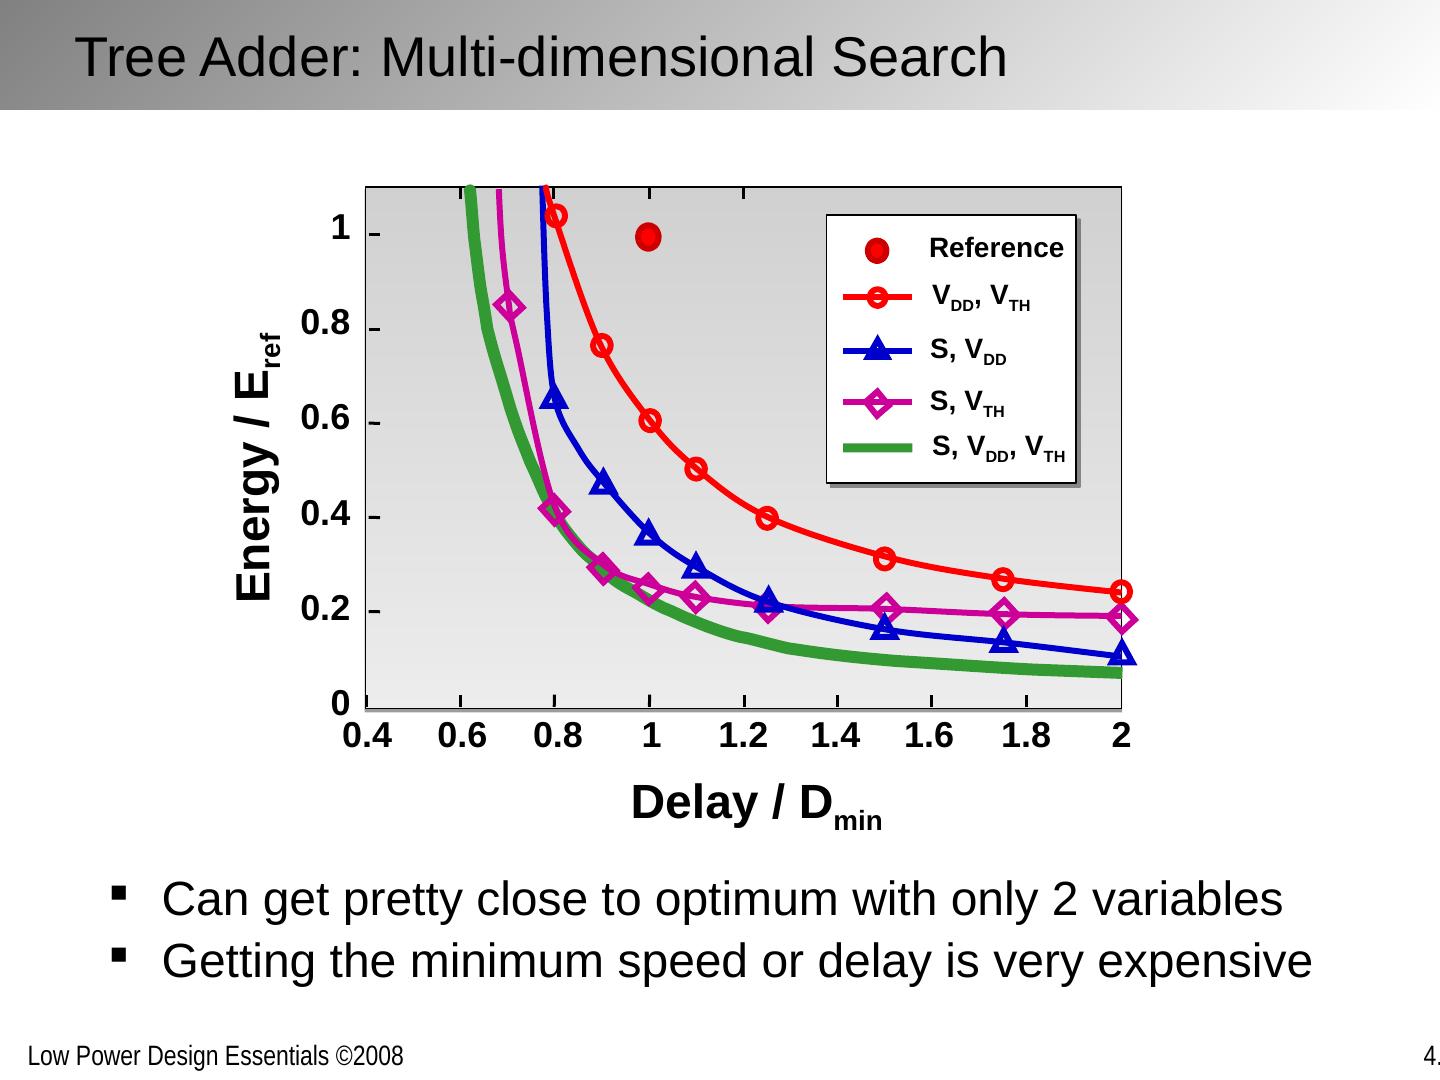
24 .Tree Adder: Multi-dimensional Search Can get pretty close to optimum with only 2 variables Getting the minimum speed or delay is very expensive Energy / E ref Delay / D min 0.4 0.6 0.8 1 1.2 1.4 1.6 1.8 2 0 0.2 0.4 0.6 0.8 1 Reference S, V DD V DD , V TH S, V TH S, V DD , V TH
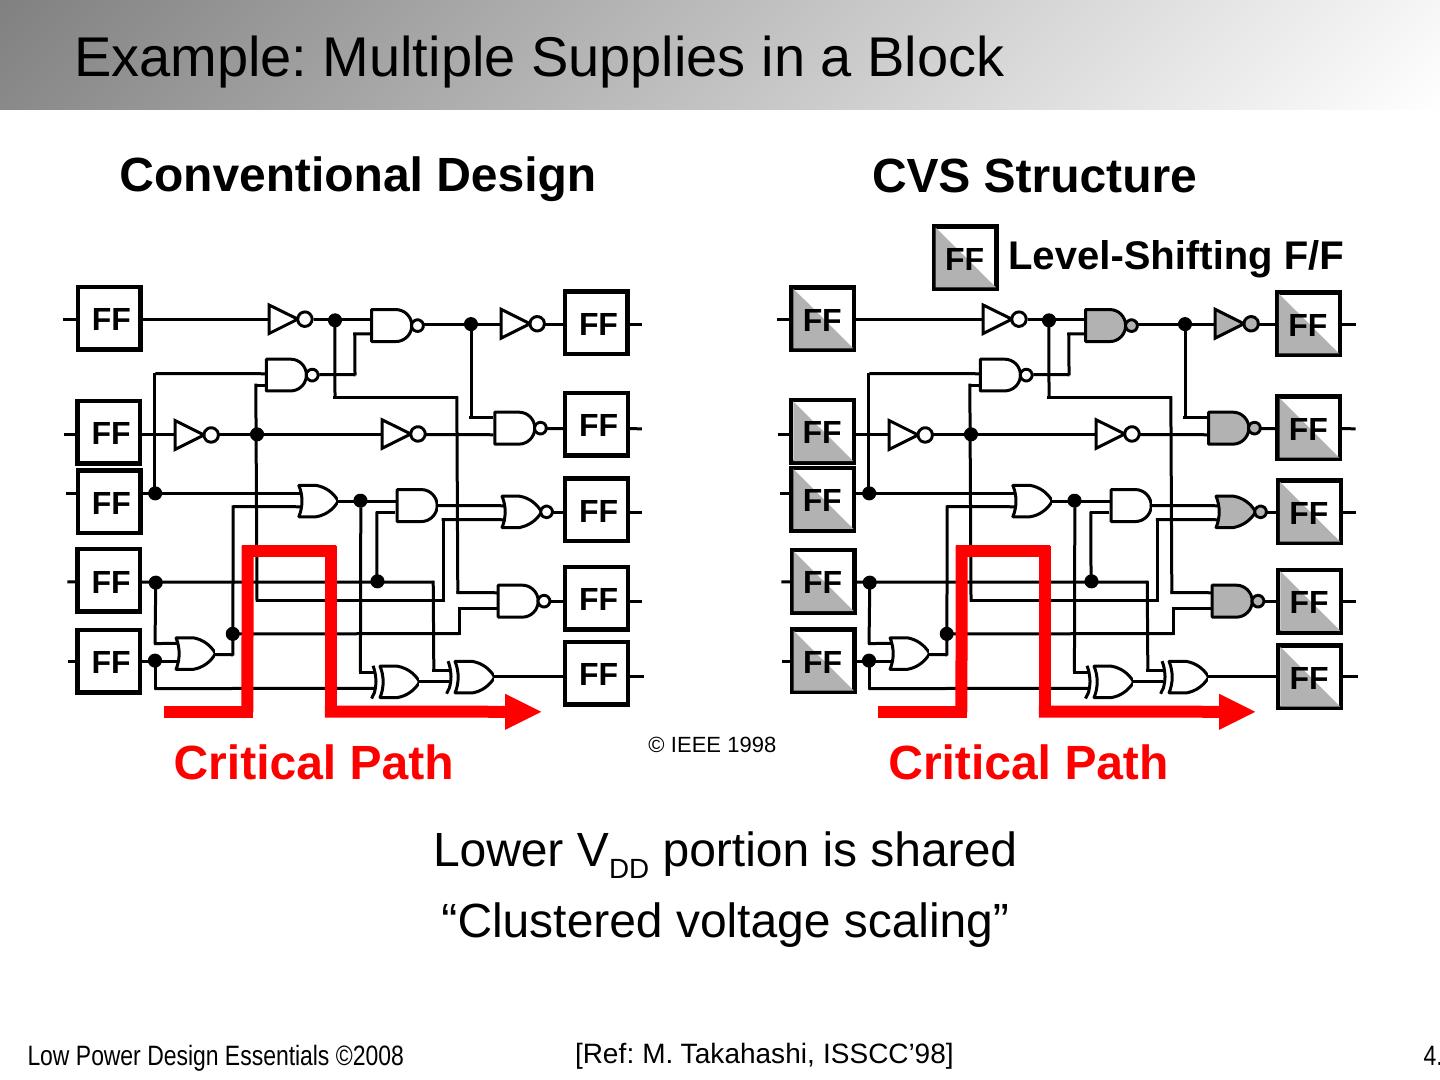
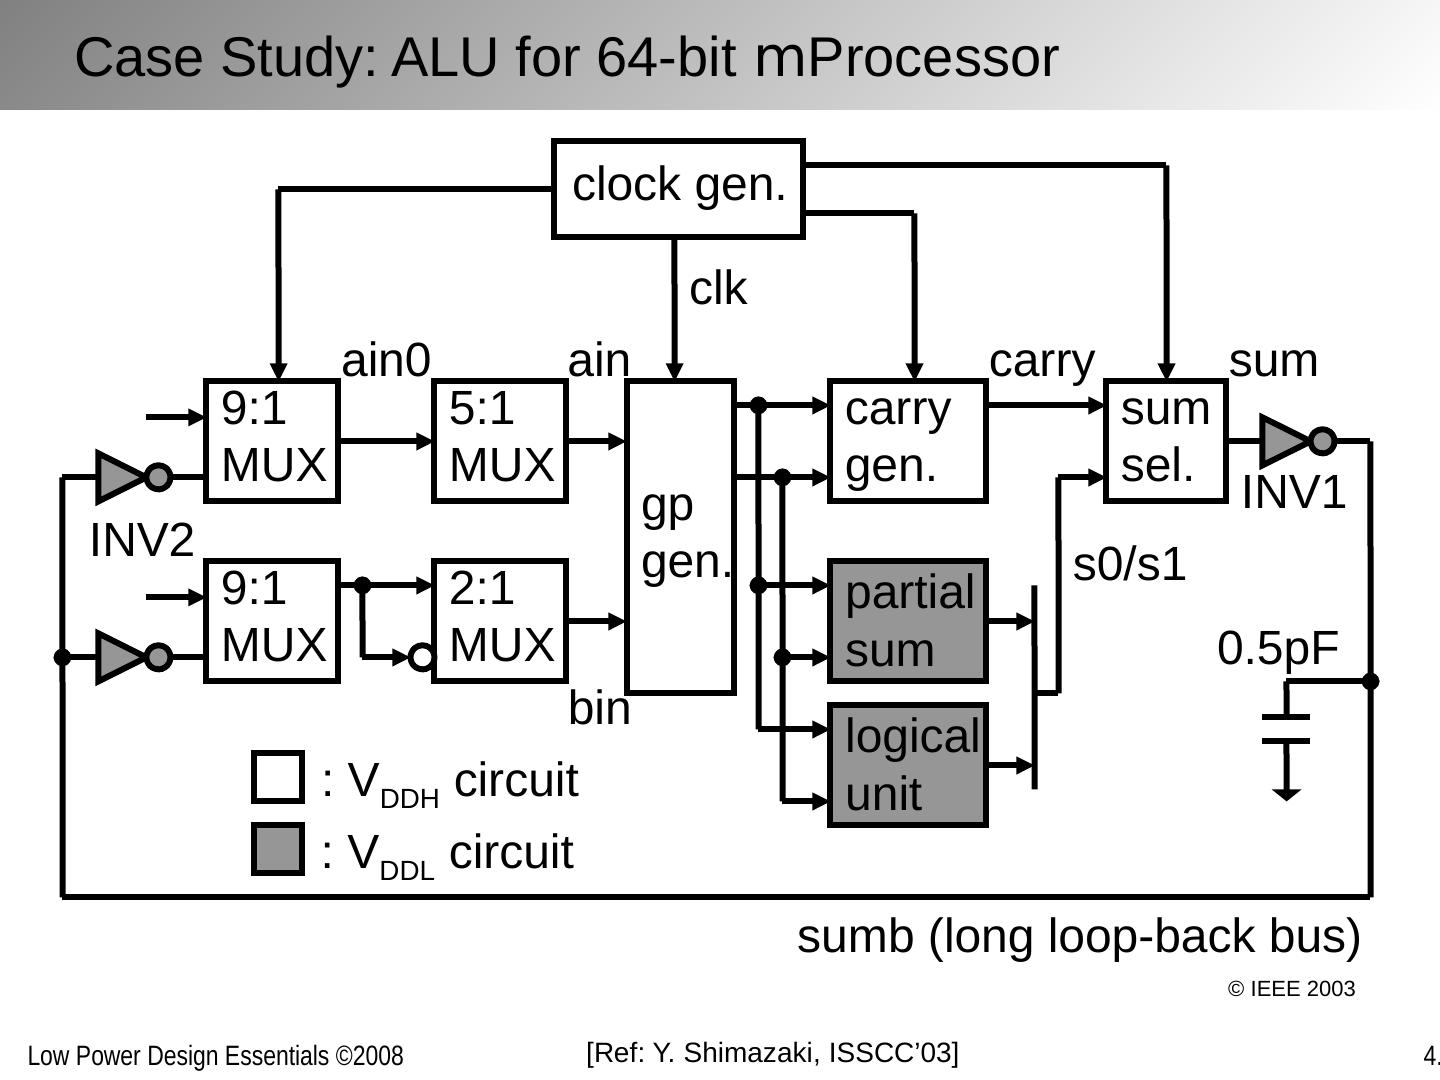
25 .Block-level supply assignment Higher throughput/lower latency functions are implemented in higher V DD Slower functions are implemented with lower V DD This leads to so-called “voltage islands” with separate supply grids Level conversion performed at block boundaries Multiple supplies inside a block Non-critical paths moved to lower supply voltage Level conversion within the block Physical design challenging Multiple Supply Voltages
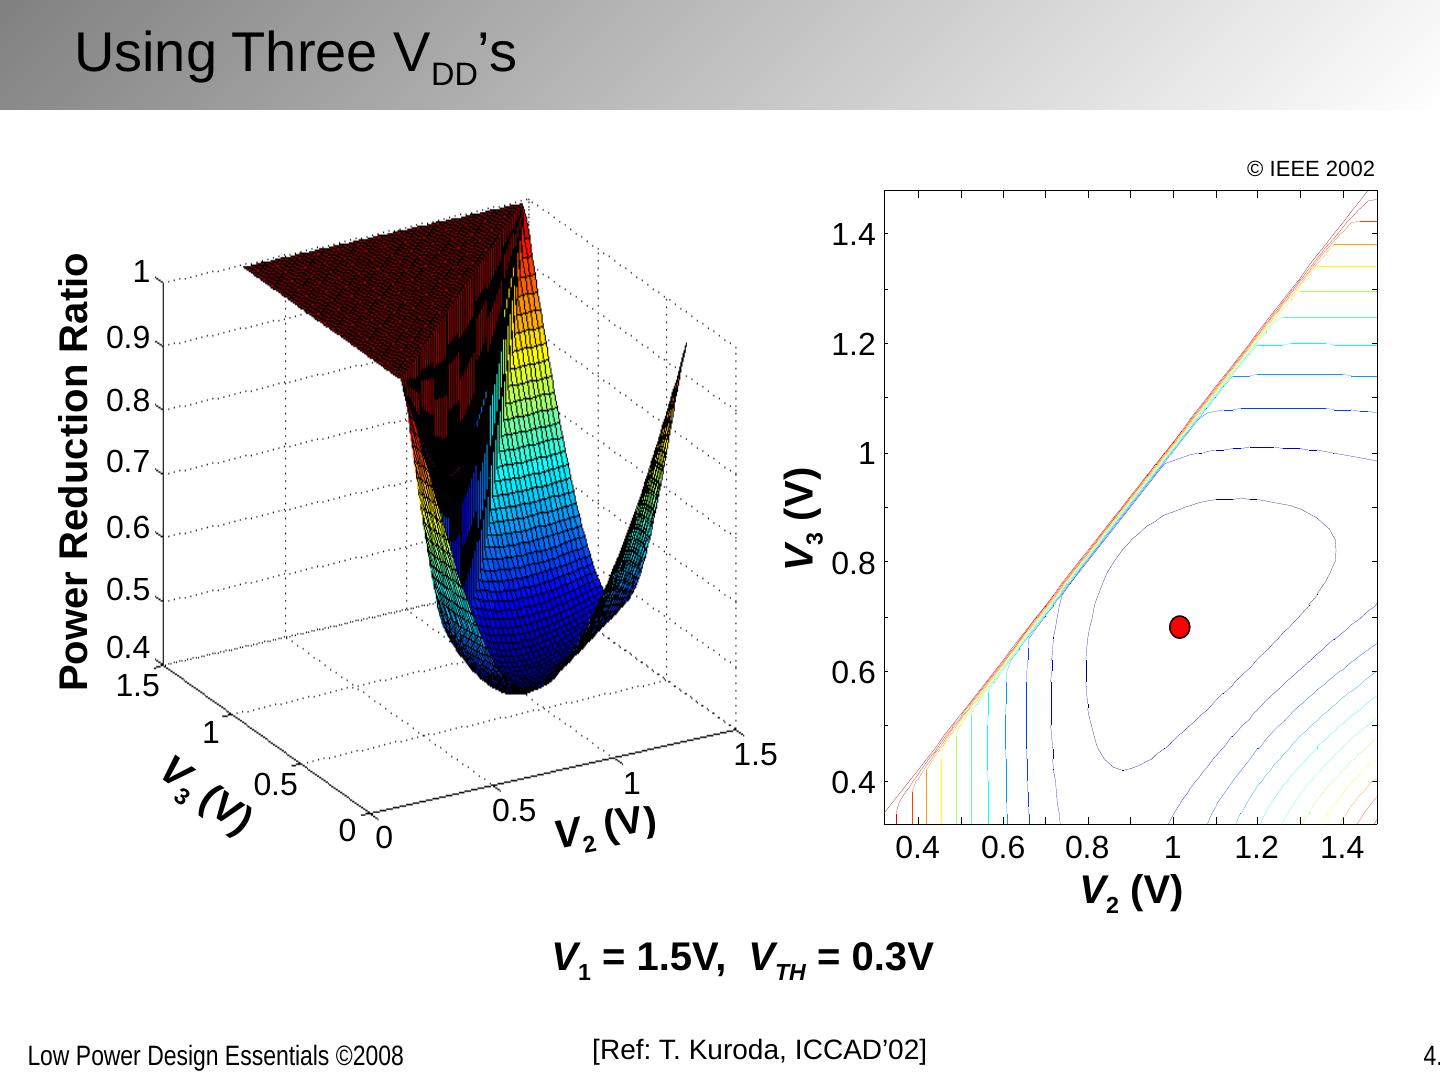
26 .V 1 = 1.5V, V TH = 0.3V Using Three V DD ’s + V 2 (V) V 3 (V) 0.4 0.6 0.8 1 1.2 1.4 0.4 0.6 0.8 1 1.2 1.4 V 2 (V) V 3 (V) Power Reduction Ratio 0 0.5 1 1.5 0 0.5 1 1.5 0.4 0.5 0.6 0.7 0.8 0.9 1 [Ref: T. Kuroda, ICCAD’02 ] © IEEE 2002
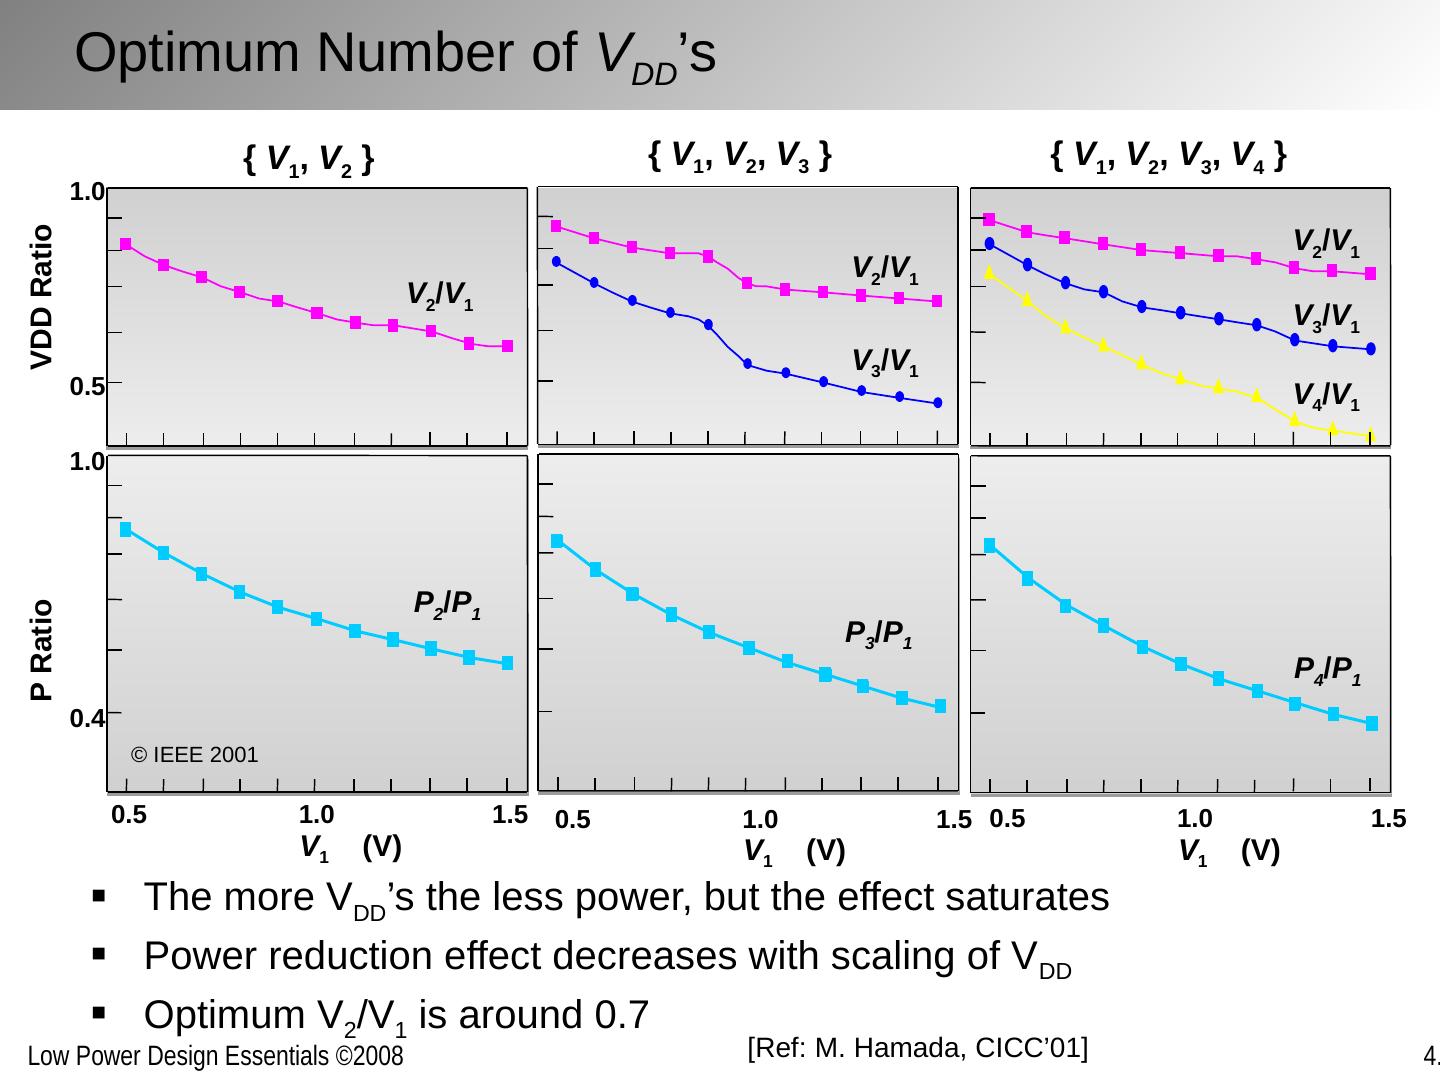
27 .1.0 0.5 VDD Ratio 1.0 0.4 0.5 1.0 1.5 V 1 (V) P Ratio V 2 / V 1 P 2 / P 1 { V 1 , V 2 } V 2 / V 1 V 3 / V 1 { V 1 , V 2 , V 3 } 0.5 1.0 1.5 V 1 (V) P 3 / P 1 V 2 / V 1 V 3 / V 1 V 4 / V 1 0.5 1.0 1.5 V 1 (V) P 4 / P 1 { V 1 , V 2 , V 3 , V 4 } [Ref: M. Hamada, CICC’01] Optimum Number of V DD ’s The more V DD ’s the less power, but the effect saturates Power reduction effect decreases with scaling of V DD Optimum V 2 /V 1 is around 0.7 © IEEE 2001
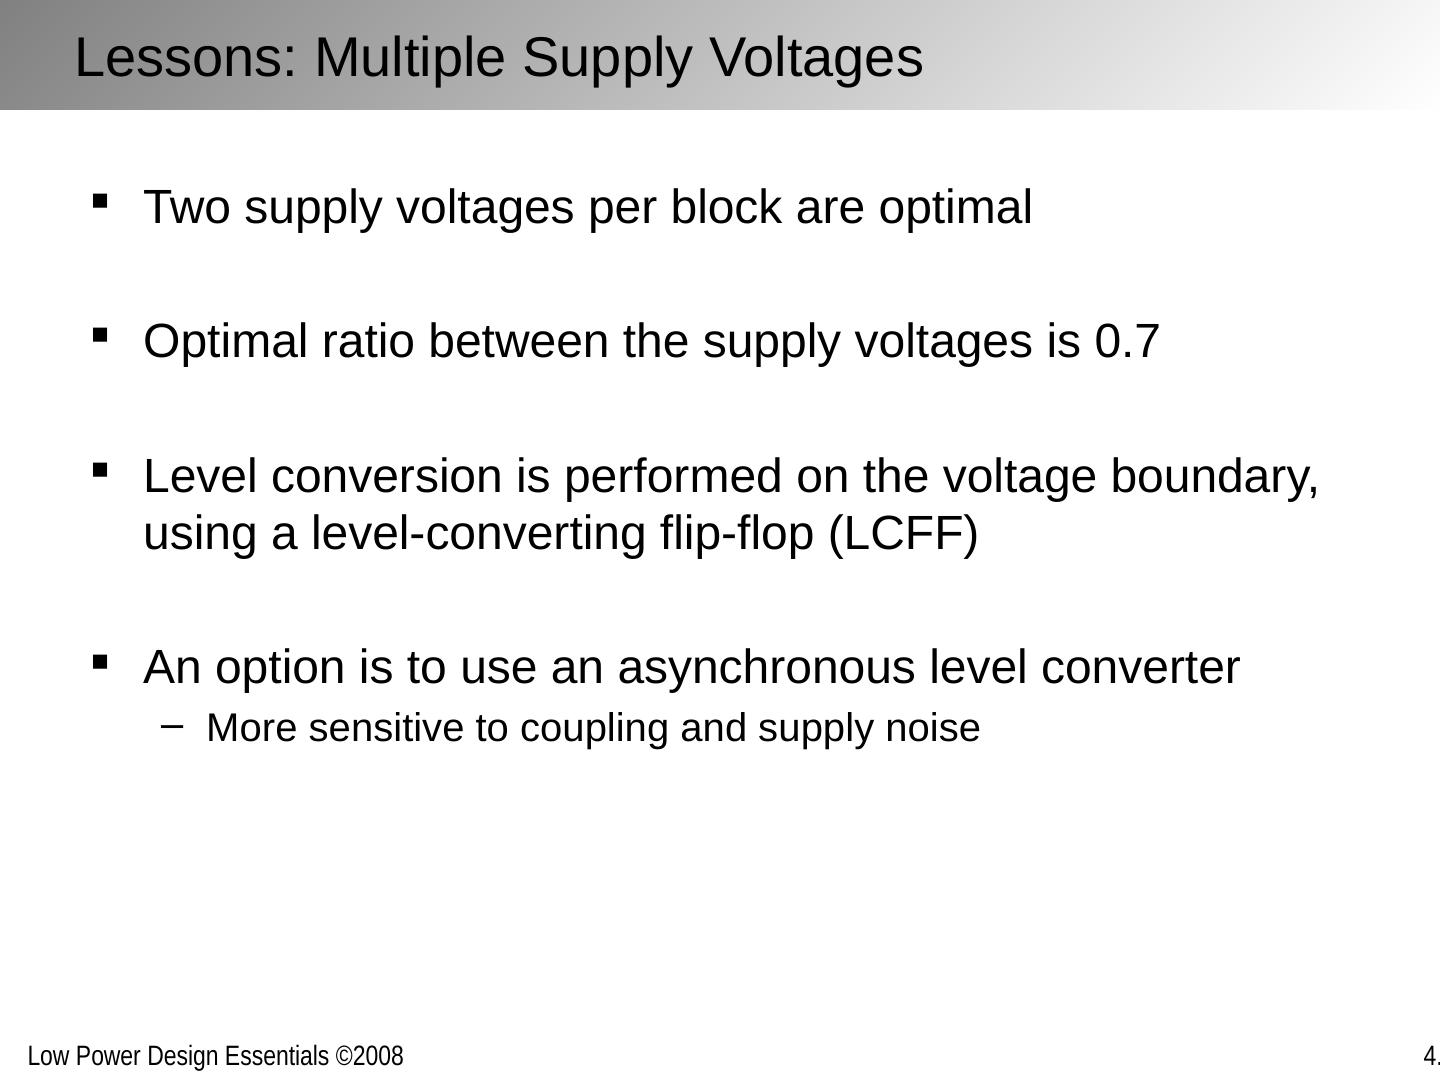
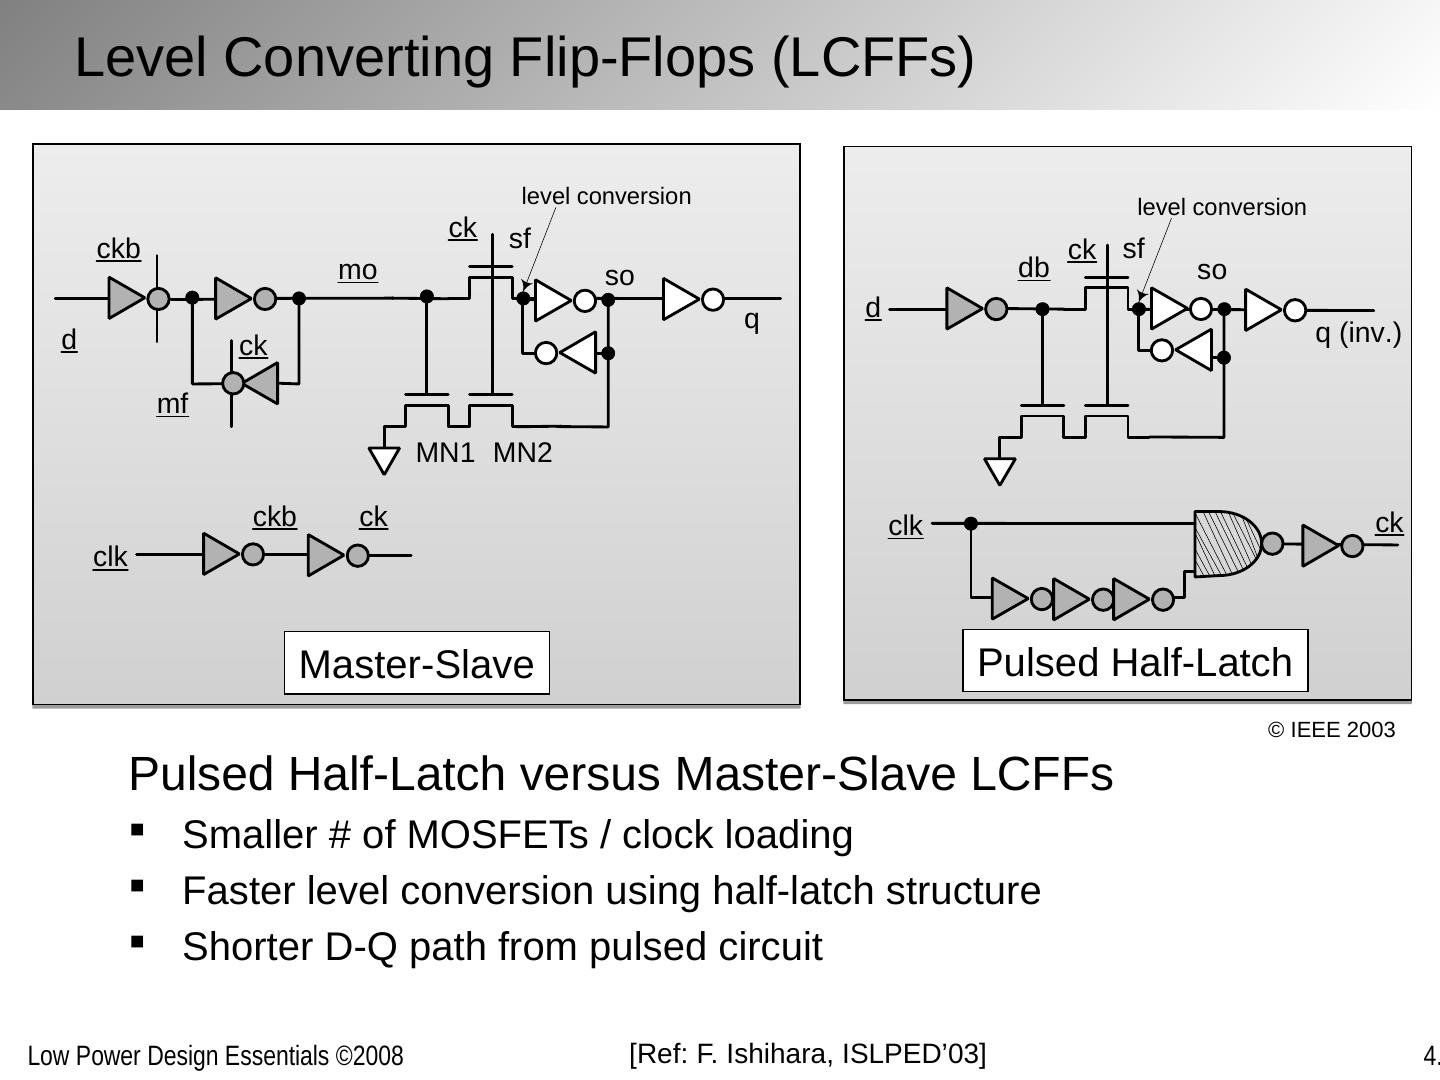
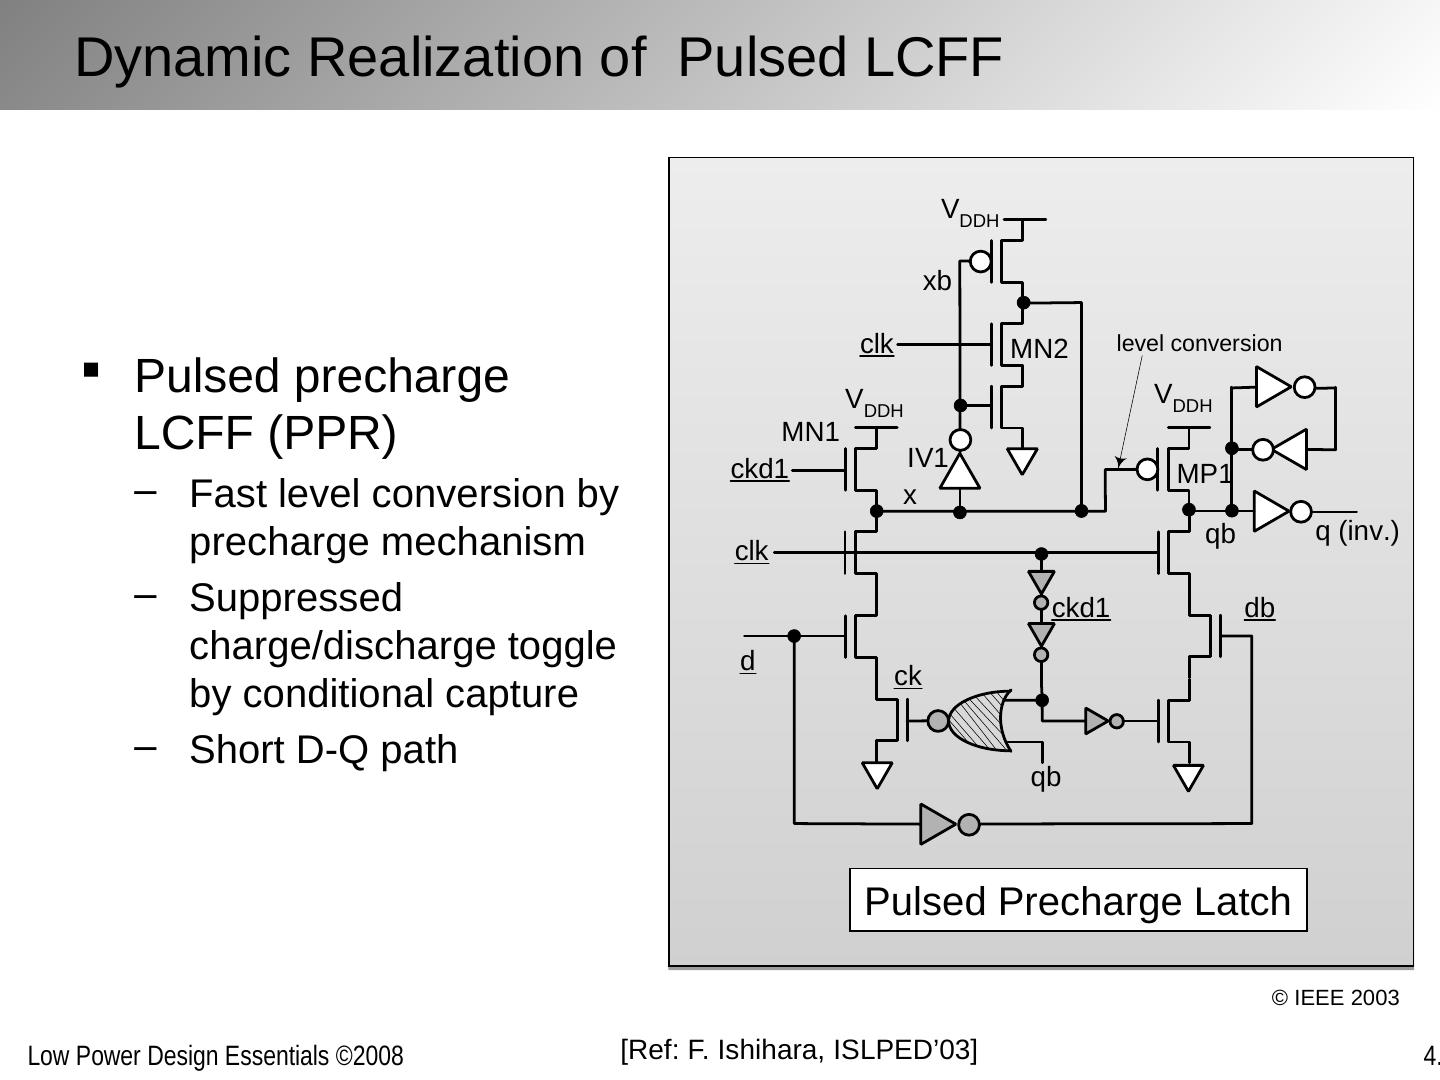
28 .Two supply voltages per block are optimal Optimal ratio between the supply voltages is 0.7 Level conversion is performed on the voltage boundary, using a level-converting flip-flop (LCFF) An option is to use an asynchronous level converter More sensitive to coupling and supply noise Lessons: Multiple Supply Voltages
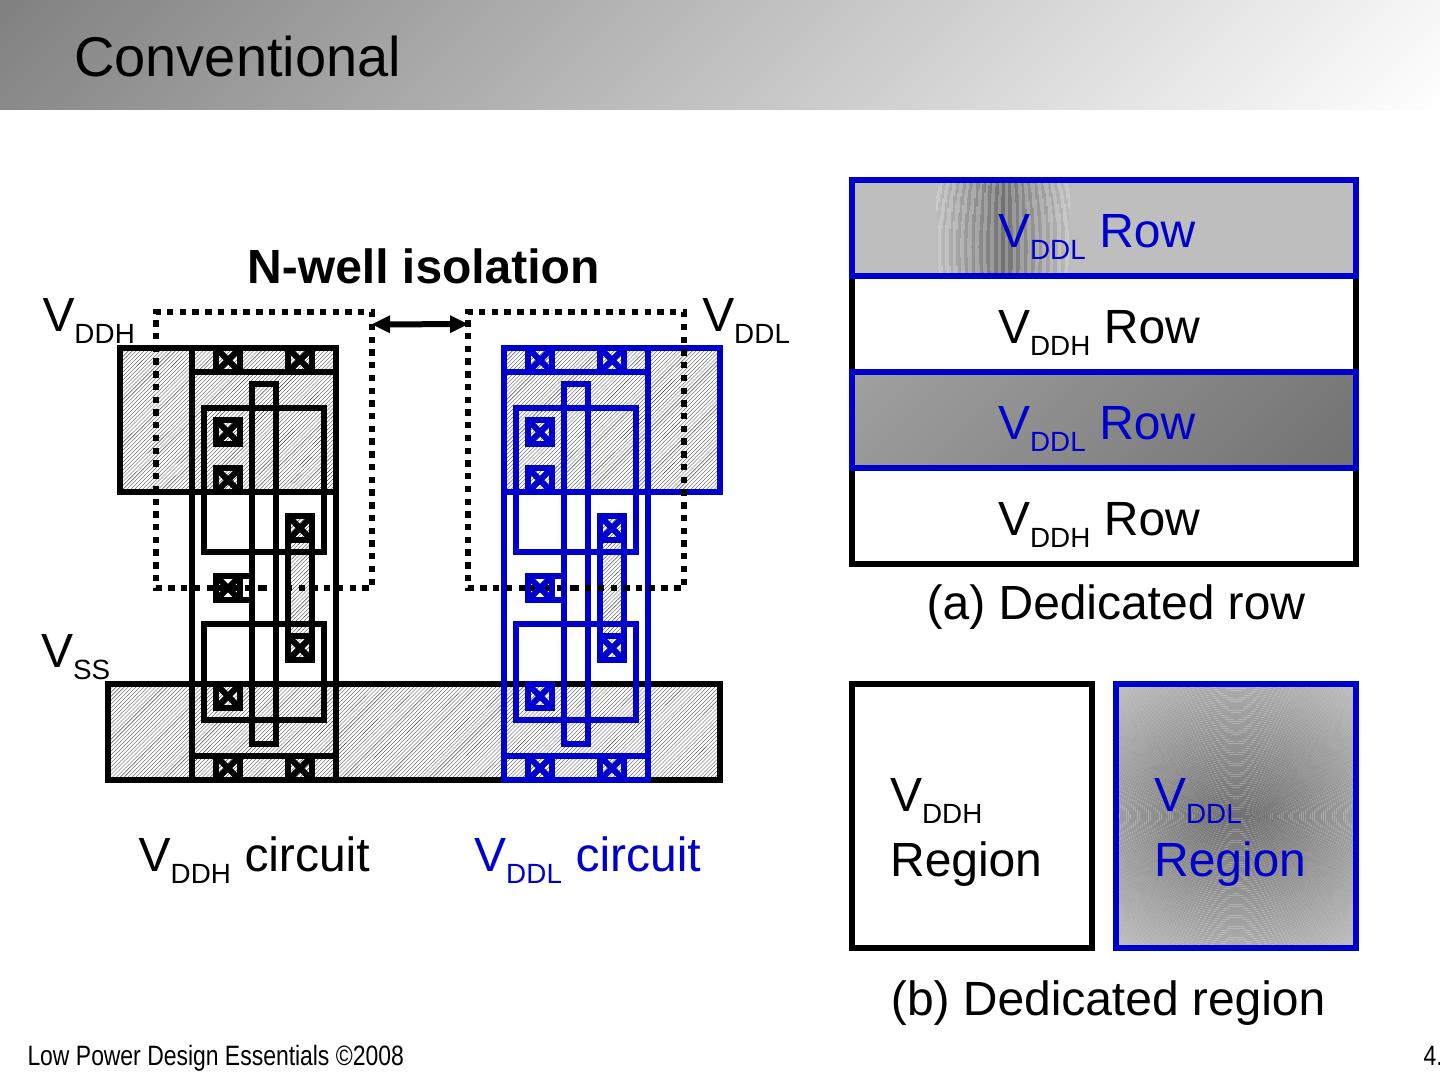
29 .i1 o1 V DDH V DDL V SS Conventional V DDH circuit V DDL circuit i2 o2 i1 o1 V DDH V DDL V SS Shared N-well V DDH circuit V DDL circuit i2 o2 Distributing Multiple Supply Voltages


